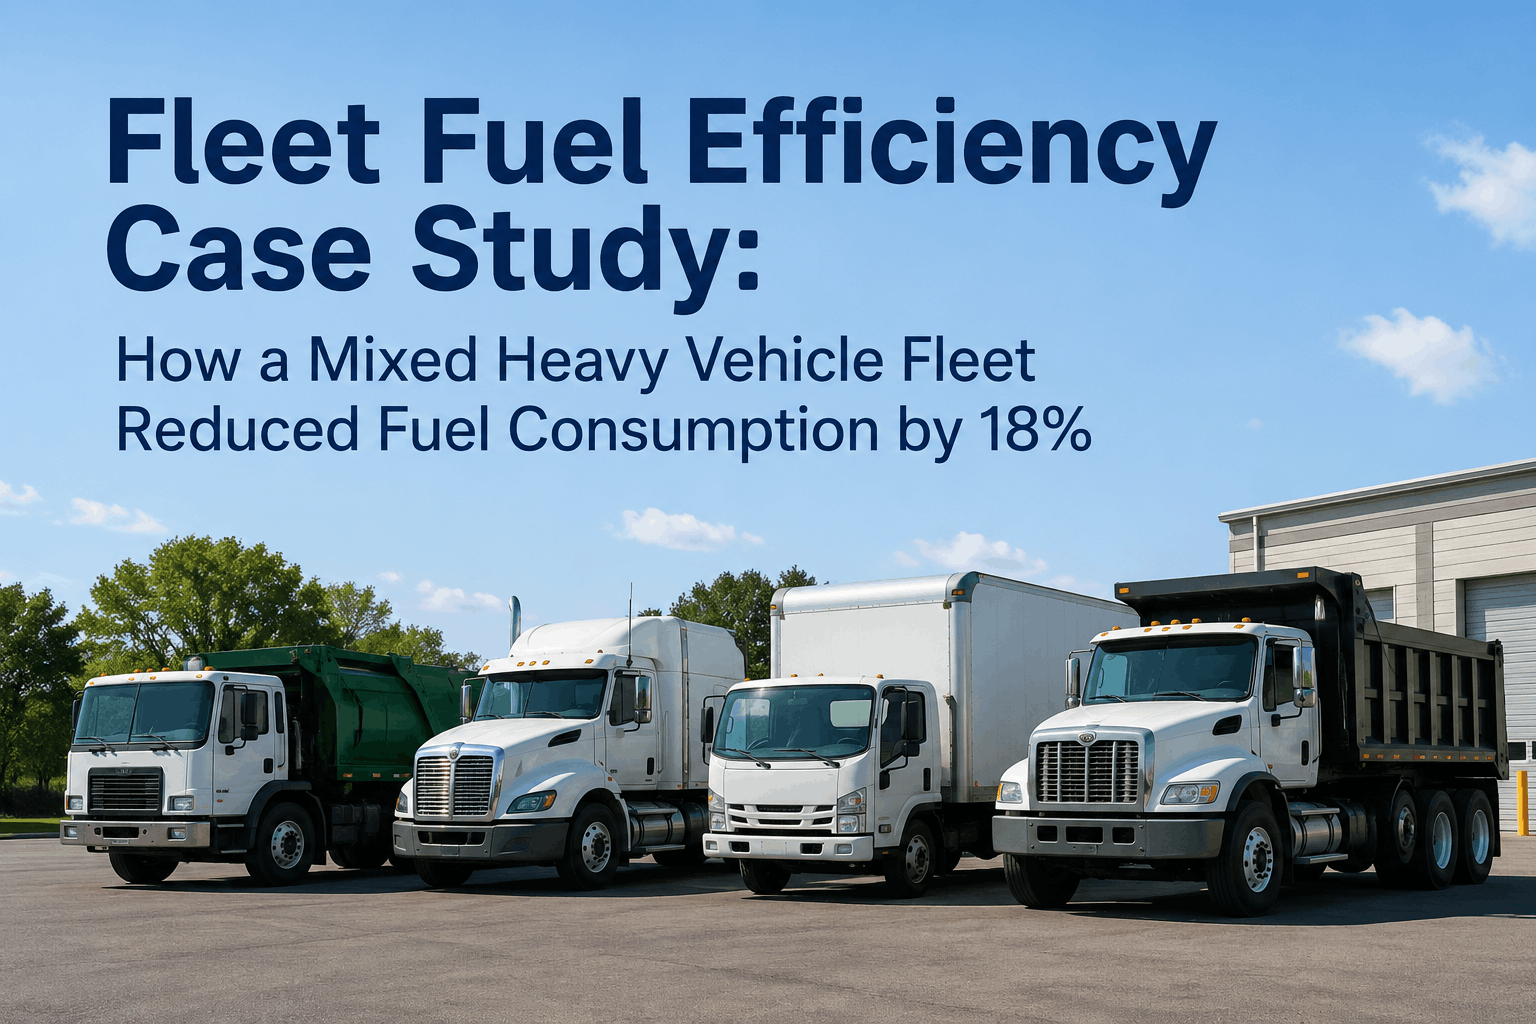
Fuel represented 24% of this fleet's total operating budget—$2.6 million per year across 110 mixed heavy vehicles including refuse trucks, vacuum tankers, flatbeds, and utility boom trucks. Each vehicle type had different consumption profiles, different routes, and different drivers—making fleet-wide optimization seem impossible. By implementing a five-pillar approach combining route optimization, idle reduction, preventive maintenance discipline, driver performance monitoring, and fuel analytics, the fleet reduced fuel consumption per mile by 18% in 8 months and recaptured $468,000 annually—without replacing a single vehicle. Start your free trial to start tracking your fuel efficiency, or book a demo to see HVI's fuel analytics dashboard.
Fleet Profile
Unlike single-purpose fleets, this mixed operation runs vehicles with wildly different fuel profiles—a refuse truck averaging 3.2 MPG on stop-start routes versus a utility truck averaging 7.8 MPG on highway runs. One-size-fits-all fuel management doesn't work here.
Mixed Fleet Overview
Vehicle Type Mix and Baseline Fuel Profiles
Where Fuel Was Being Wasted
The fleet installed telematics and fuel sensors across all 110 vehicles for a 30-day diagnostic period before making any changes. The data revealed five distinct waste streams—each addressable through different interventions. Schedule a consultation to run a similar diagnostic on your fleet.
The Five-Pillar Optimization Program
Instead of chasing fuel savings with a single tactic, the fleet deployed five interventions simultaneously—each targeting a different waste stream and measured independently. Start your free trial to implement these same strategies.
Refuse routes redesigned from 8 zones to 12 tighter clusters. Tanker dispatching switched to proximity-first logic. Average daily mileage dropped 14% across affected units.
Auto-shutdown timers at 5 minutes for all vehicles. Boom trucks received auxiliary power units. Fleet-wide idle dropped from 48 to 16 minutes per day average.
Monthly scorecards ranking MPG by vehicle class. Bottom-quartile drivers coached on throttle, RPM, and braking. Top performers recognized with fuel bonus program.
Digital inspections added tire-pressure and filter-status fields. MPG drop alerts triggered maintenance work orders automatically when a vehicle's efficiency fell 10%+.
Fuel card transactions matched to GPS locations and tank-level sensors. After-hours fills and capacity mismatches flagged immediately. Nine unauthorized-use cases resolved.
What Would an 18% Fuel Reduction Mean for Your Fleet?
Most mixed fleets discover 15-25% in recoverable fuel waste across idling, routing, driving, and maintenance gaps.
8-Month Results
The fleet measured fuel consumption per mile—not just total gallons—to account for seasonal volume changes. After 8 months, fuel cost per mile dropped 18% across all vehicle classes while total miles driven increased 3% due to new service contracts.
MPG Improvement by Vehicle Class
Annual Savings by Intervention
"Running a mixed fleet is different—you can't compare a refuse truck's MPG to a service truck's and draw any conclusions. The game-changer was tracking fuel per mile by vehicle class. When we could finally see that our refuse trucks were burning 19% more fuel than they should for their routes, and our boom trucks were idling three hours a day on-site, the action plan wrote itself. Five pillars, 8 months, $468,000 saved. The CFO signed off on the program expansion in one meeting."
Optimize Your Fleet's Fuel Efficiency
Every gallon your fleet wastes on idling, poor routes, aggressive driving, and deferred maintenance is money that never had to be spent. A mixed fleet makes optimization harder—but also means the savings opportunity is larger because each vehicle class has its own efficiency ceiling. Start your free trial and see where your fuel is actually going.
18% Less Fuel. $468K Saved. Same Fleet.
Route optimization, idle reduction, driver coaching, PM-linked tracking, and fuel analytics — a five-pillar program for mixed heavy fleets.