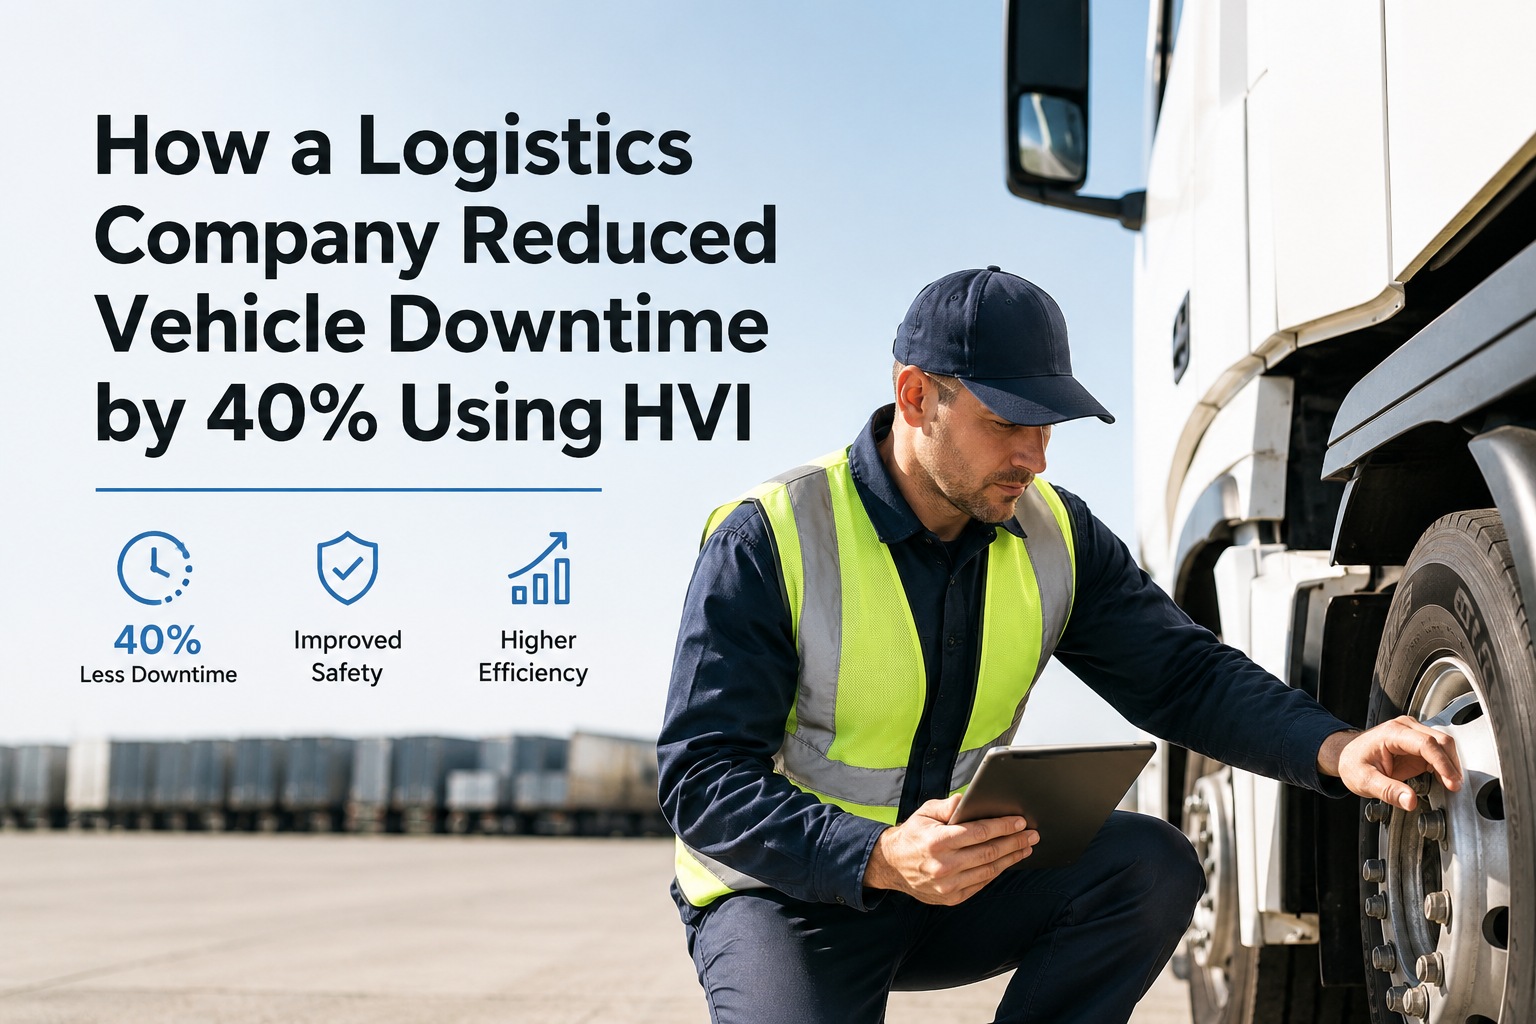
This logistics company was losing $1.4 million per year to unplanned vehicle downtime—vehicle breaking down mid-route, missed delivery windows, emergency tow calls, and expedited repairs at premium rates. Across their 120-vehicle fleet, the average vehicle spent 8.7 days per year out of service for unplanned repairs, and every idle day cost $580 in lost revenue, emergency fixes, and customer penalties. After implementing HVI's digital pre-trip inspections, automated maintenance scheduling, and real-time defect routing, they cut unplanned downtime by 40%—from 8.7 days to 5.2 days per vehicle per year—recovering $560,000 annually while improving on-time delivery from 88% to 96%. Start your free trial to start reducing your fleet's downtime, or book a demo to see HVI's maintenance workflow in action.
Fleet Profile
This regional LTL and dedicated contract carrier operates a mix of day cabs, sleeper tractors, and straight vehicles across a 6-state service area with 3 terminals—running 16 hours per day, 6 days per week.
Logistics Fleet Overview
The True Cost of Downtime
Fleet managers see the repair invoice. What they don't see is the cascade of costs that surround every unplanned breakdown: the stranded driver's wages, the missed delivery penalty, the emergency tow, and the customer who starts calling competitors.
What You See
What You Don't See
Top Five Breakdown Causes (Pre-HVI)
HVI Implementation: Three Connected Systems
The fleet didn't just digitize inspections—they connected inspections to maintenance scheduling and maintenance to real-time fleet availability. The result was a closed loop where defects found during pre-trips automatically triggered work orders that updated fleet availability dashboards. Start your free trial to build the same connected workflow.
Digital Pre-Trip Inspections
Every driver completes a guided inspection on their phone before each shift. Defects are photo-documented and severity-rated. Critical defects lock the vehicle out of service instantly.
Automated Work Order Routing
Defects route instantly to the correct terminal's shop with photos, severity, and vehicle location. Mechanics see the problem before the vehicle arrives. No phone calls, no paper handoffs.
Fleet Availability Dashboard
Operations sees real-time vehicle status: green (available), yellow (minor defect scheduled), red (out of service). Dispatchers make informed route assignments instead of guessing.
How Many Revenue-Days Is Your Fleet Losing to Breakdowns?
At $580 per day per vehicle, even a small downtime reduction pays for the entire platform in weeks.
12-Month Results
After 12 months on the HVI platform, unplanned downtime dropped 40% across all 120 vehicles—and the improvements compounded as the maintenance team shifted from reactive firefighting to planned, scheduled service.
Complete Before / After Comparison
| Metric | Before HVI | After HVI |
|---|---|---|
| Unplanned downtime days/vehicle/year | 8.7 | 5.2 |
| Fleet availability | 87.6% | 94.2% |
| On-time delivery rate | 88% | 96% |
| Roadside breakdowns per month | 14 | 4 |
| Defect-to-repair time | 28 hours | 4.2 hours |
| Pre-trip completion rate | 62% | 98% |
| Emergency tow calls per month | 9 | 2 |
| Annual maintenance cost per vehicle | $12,400 | $8,900 |
Where the $560K Came From
"We were running our maintenance department like a fire station—waiting for something to break and then scrambling. Drivers would call in a defect, dispatch would write it on a whiteboard, and the shop might see it 24 hours later. HVI closed that gap to 4 hours. Now when a driver flags a soft brake pedal at 5 AM, the mechanic has the photo and the parts pulled before the vehicle arrives at the terminal. We went from 14 roadside breakdowns a month to 4. Our on-time delivery went from 88% to 96%. Our biggest shipper noticed before we even told them—they renewed a contract we were about to lose."
Stop Losing Revenue to Downtime
Every day a vehicle sits in the shop is $580 in lost revenue, wasted labor, and customer risk. Digital inspections don't just find defects—they route them instantly to the right mechanic with photos, creating a closed loop that turns reactive maintenance into planned maintenance. Start your free trial and see how many breakdowns your pre-trips are missing.
40% Less Downtime. $560K Saved. 96% On-Time.
Digital inspections, automated work orders, and real-time fleet availability — built for logistics fleets that can't afford to stop.