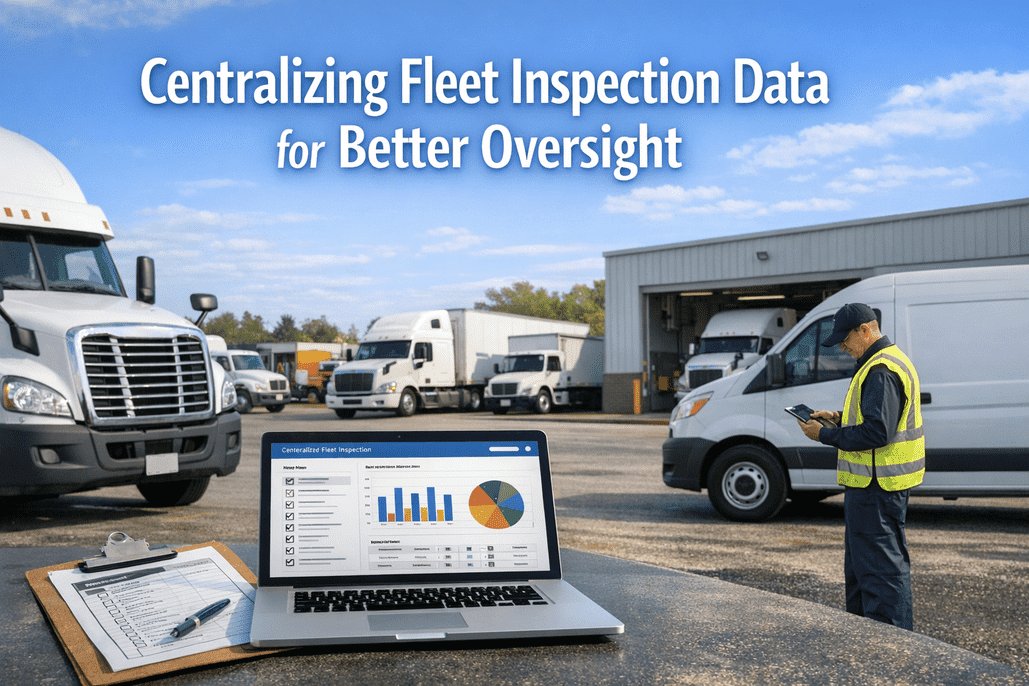
A 289-vehicle fleet operating across 5 locations discovered that its biggest compliance risk wasn't missing inspections — it was missing the data from inspections that had already been completed. With each location running its own system — paper at two sites, a basic app at one, spreadsheets at another, and email-based reporting at the fifth — fleet leadership had no unified view of vehicle health, defect trends, or compliance status. Pulling records for a single DOT audit required 14 days and involvement from staff across all locations. After centralizing all inspection data into a single cloud-based platform, the fleet reduced audit preparation from 14 days to under 2 hours, gained real-time visibility across every location, and identified recurring defect patterns that had been invisible for years — saving $198,000 in preventable repairs within the first 12 months. Fleet directors, compliance managers, and multi-location operations leaders will find a proven framework for diagnosing data fragmentation, implementing centralized inspection systems, and measuring the oversight improvements that follow.
Fragmented Inspection Data
Five locations, five systems, zero connection between them. Every site had evolved its own way of recording inspections — none of which could talk to the others. The fleet was generating thousands of inspection records annually, but the data lived in silos that made fleet-wide analysis impossible. When a pattern of brake failures appeared across locations, nobody could see it — because the information existed in five incompatible formats across five disconnected systems. Schedule a consultation to assess your fleet's data fragmentation, or start your free trial to see centralized inspection data in action.
5 Locations, 5 Disconnected Systems
Filed in binders. 3-5 day lag before data reached management. 35% illegible. No searchable history.
Carbon copies sent to regional office weekly. Frequently lost in transit. 18% never received.
Pass/fail checkboxes only. No photos, no severity ratings. Data exportable but format incompatible with other sites.
Emailed to supervisor weekly. Version conflicts constant. 27% of entries had formula errors or missing fields.
Drivers texted or emailed photos to shop. No structured format. Zero audit trail. Records lived on personal phones.
Lack of Central Oversight
Fleet leadership didn't have a data problem — they had a blindness problem. Without centralized inspection data, there was no way to see which locations were underperforming, which vehicle types had recurring issues, or whether compliance standards were being met consistently across the operation. Management decisions were based on phone calls, gut feelings, and quarterly summaries that arrived weeks late. Discover how inspection best practices can restore fleet-wide visibility.
The Oversight Gap: What Leadership Couldn't Answer
Which location has the lowest inspection completion rate?
No cross-location comparison possible. Each site reported to its own manager in its own format.
What are the top 5 recurring defects fleet-wide?
Defects categorized differently at each site. "Brake wear" at one location was "brake issue" at another.
Are we audit-ready right now?
Nobody knew. Gathering compliance records required contacting all 5 locations and manually compiling documents.
How fast are reported defects being repaired?
No defect-to-repair tracking existed. Defect reports and work orders lived in separate, unlinked systems.
Which vehicles should be flagged for replacement?
Maintenance history scattered across systems. Total cost of ownership calculations were impossible.
Are drivers actually performing thorough inspections?
No quality scoring, no time tracking, no photo verification. Pencil-whipping was undetectable.
Management Visibility Score Before Centralization
Your Fleet Data Shouldn't Live in 5 Different Places
See how one centralized platform gives you real-time inspection visibility, cross-location analytics, and audit-ready records — instantly.
Data Centralization Approach
The fleet didn't just switch software — they redesigned how inspection data flowed from drivers to management. Every location migrated to a single cloud-based inspection platform with unified templates, mandatory photo documentation, automated defect routing, and role-based dashboards. The migration followed a 12-week phased rollout. Try our centralized inspection platform to see unified fleet data management in action.
The Centralization Blueprint
Data Audit & Template Design (Weeks 1-3)
Mapped all 5 existing systems, identified data gaps, built unified inspection templates by vehicle class, defined standardized defect categories and severity levels
Platform Configuration & Pilot (Weeks 4-6)
Configured cloud platform with role-based dashboards (driver, supervisor, fleet director, compliance). Piloted at Central Hub location with 47 drivers
Fleet-Wide Rollout (Weeks 7-10)
Remaining 4 locations migrated in pairs. Each site received on-site training. Legacy data from all systems archived and indexed for historical reference
Validation & Optimization (Weeks 11-12)
Fleet-wide data quality audit. Dashboard calibration based on management feedback. Automated reporting schedules configured for weekly and monthly cadence
One Platform
All 5 locations feeding a single cloud system. Same templates, same data structure, same language.
One Dashboard
Fleet director sees all locations in a single view. Drill down by site, vehicle, driver, or defect type.
One Workflow
Defect reported, alert triggered, work order created, repair tracked, driver notified. Automatic, everywhere.
One Record
Every inspection timestamped, GPS-verified, photo-documented, and stored in a searchable cloud archive.
Visibility Improvements
Within 60 days, fleet leadership had something they'd never had: a real-time pulse on the entire operation. The same questions that were previously unanswerable — which locations are underperforming, what are the most common defects fleet-wide, are we audit-ready — now had instant answers. Book a demo to see how centralized dashboards transform fleet oversight.
Before vs. After: Management Capabilities
| Capability | Before | After |
|---|---|---|
| Fleet-wide inspection status | Weekly phone calls to 5 managers | Real-time dashboard |
| Cross-location defect comparison | Not possible | Instant analytics |
| Audit documentation retrieval | 14 days, 5 staff involved | Under 2 hours, 1 person |
| Defect-to-repair cycle time | Untracked | Auto-tracked, avg. 1.8 days |
| Driver inspection quality scoring | None | Individual scores + fleet avg. |
| Recurring defect pattern detection | Anecdotal | Automated trend alerts |
Management Outcomes
Centralized data didn't just make reporting easier — it made the fleet smarter. Patterns that had been invisible for years surfaced within weeks. Three vehicle models accounted for 58% of all air brake defects. One location's inspection completion rate was 23 points below the fleet average. These weren't new problems — they were old problems that finally had data behind them. Learn more at the HVI Learning Center.
12-Month Outcomes After Centralization
Centralization Investment vs. Return
How HVI Solves Fleet Data Fragmentation
The challenges in this case study — disconnected systems, invisible defect patterns, audit nightmares, and zero cross-location visibility — are exactly what HVI's digital inspection platform is built to eliminate. Here's how HVI turns fragmented inspection data into a centralized command center for your fleet.
Single Cloud Platform for All Locations
Every driver, every location, every vehicle — one system. HVI replaces paper, spreadsheets, apps, and email threads with a single source of truth that syncs in real time. Role-based dashboards let drivers see their assignments, supervisors see their site, and fleet directors see everything.
Standardized Digital DVIRs with Photo Proof
Vehicle-specific inspection templates ensure every driver checks the same items in the same order. Mandatory photo uploads, GPS timestamps, and digital signatures eliminate pencil-whipping and create audit-ready records automatically with every inspection.
Automated Defect-to-Repair Workflow
When a driver flags a defect, HVI instantly alerts maintenance, creates a prioritized work order based on severity, and tracks the repair from report to resolution. No defect falls through the cracks between a text message and a shop foreman's memory.
Real-Time Fleet Health Dashboards
See inspection completion rates, defect trends, compliance status, and repair cycle times across all locations on a single screen. Drill down by site, vehicle class, driver, or defect category. Identify underperforming locations before they become audit liabilities.
Compliance Analytics & Audit Readiness
HVI maintains a complete, searchable digital archive of every inspection, defect report, repair record, and sign-off. Pull any record in seconds — not days. Automated compliance alerts flag expiring certifications, overdue inspections, and documentation gaps before auditors find them.
Pattern Detection & Predictive Insights
HVI's analytics engine identifies recurring defect patterns across your entire fleet — the kind of cross-location intelligence that saved this fleet $198,000 in preventable repairs. See which vehicle models, components, and operating conditions generate the most issues.
Ready to see HVI in action for your fleet?
Centralize First, Optimize Second
You can't improve what you can't see. Get all inspection data into one platform before trying to optimize processes.
Standardize the Inputs
Unified templates and mandatory fields ensure data is comparable across locations from day one.
Automate the Connections
Defect-to-repair workflows, compliance alerts, and reporting schedules should run without human intervention.
Measure Across Locations
The real value of centralization is cross-location benchmarking — identifying your best and worst performers instantly.
Ready to Centralize Your Fleet's Inspection Data?
Replace disconnected systems with a single platform that gives you real-time visibility, automated compliance, and fleet-wide intelligence.
Free 14-day trial. No credit card required.