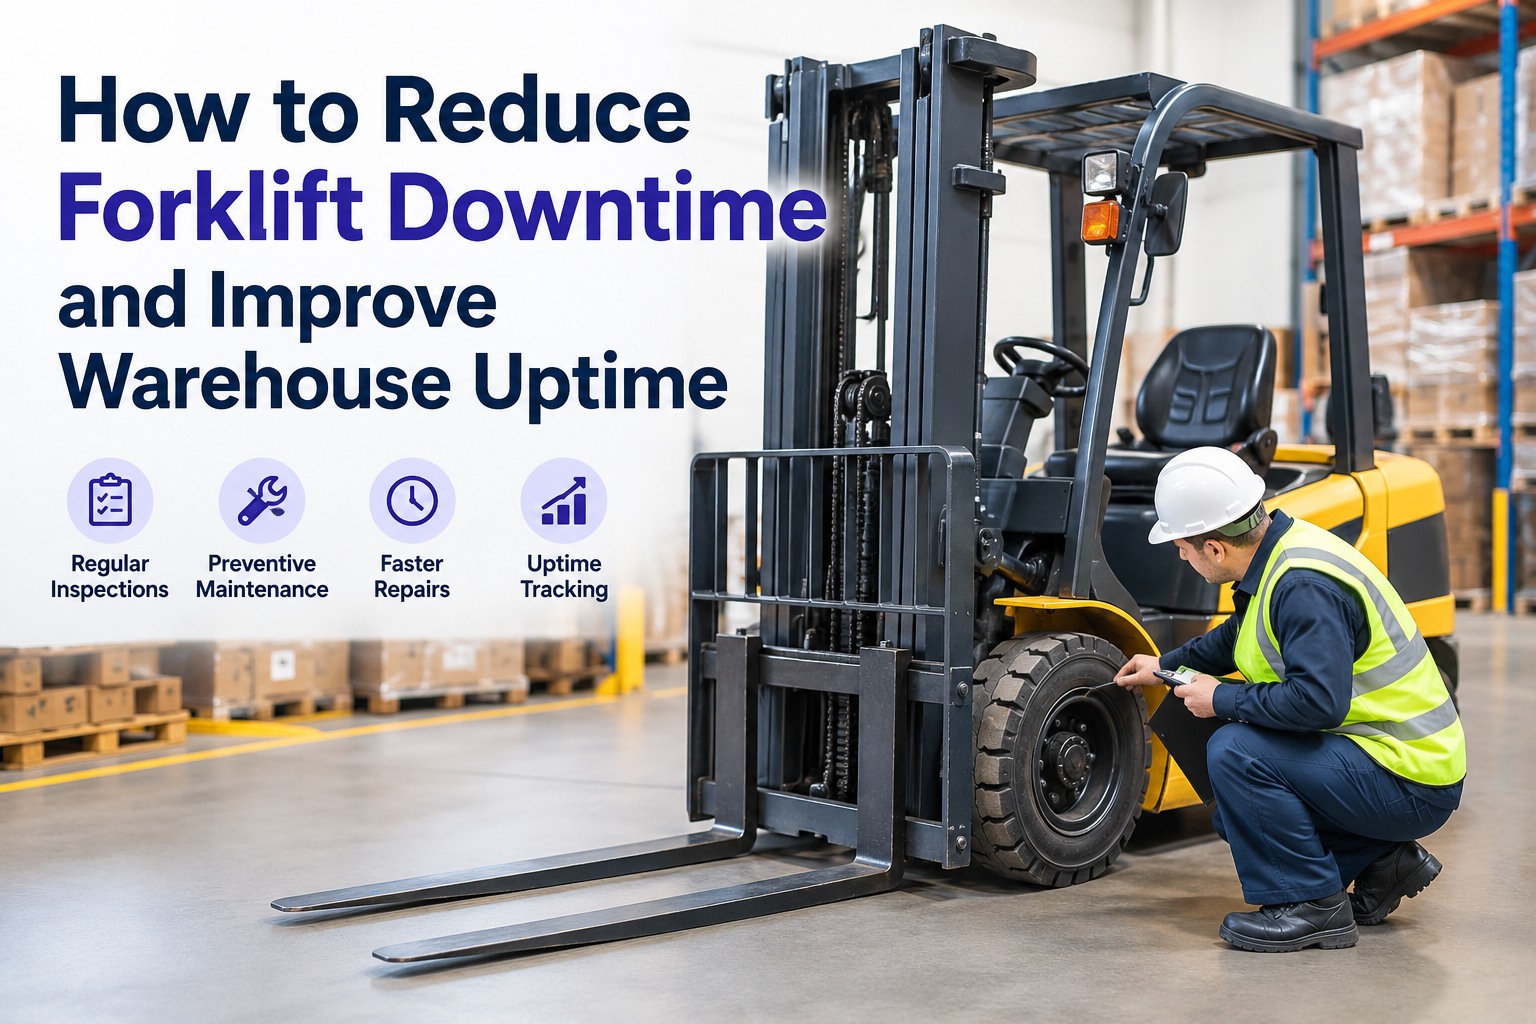
A forklift down on the warehouse floor isn't one problem — it's a chain of them. Picking slows, replenishment backs up, a trailer waits at the dock, and other trucks absorb work they weren't sized for. To reduce forklift downtime you pull two levers together: make failures happen less often, and fix them faster when they do. That's the equation behind equipment availability — and it's more measurable than most warehouses realize. This guide covers the causes, the math, and the workflow changes that keep trucks running. Book a demo to see uptime tracked in one place.
Two Levers Decide Your Forklift Uptime
Every hour of forklift downtime traces to one of two things: a failure that happened, or a repair that took too long. Uptime improves by pulling both levers.
If you're a warehouse, fleet, or MHE manager, forklift downtime is a throughput problem wearing a maintenance costume. A truck that's out costs not just the repair but the picks not made, the labor reshuffled, and the schedule that slips. The good news: most forklift downtime is predictable and preventable, and the levers are concrete — earlier defect detection, hour-accurate PM, and a faster defect-to-repair cycle, all measured so you know what's working.
Downtime, Uptime & Availabilitythree related terms that aren't the same
Before you can reduce downtime, it helps to be precise about what you're measuring, because these three get used loosely and they mean different things.
The key distinction: downtime is a raw duration, while availability is the ratio that lets you compare trucks and track improvement. A forklift down 8 hours means one thing over a light week and another over a heavy one — availability normalizes it so a 40-truck fleet's reliability is a number you can actually manage.
What Actually Takes Forklifts Downthe common causes, and which lever they answer to
Forklift downtime clusters around a handful of systems. Knowing where failures come from tells you where inspections and PM pay off — the "fail less often" lever.
Notice that most of these announce themselves before they fail outright — a weeping hydraulic hose, a battery losing runtime, a tire chunking, a fault code flickering. That's the opening: a defect caught on a daily inspection is a scheduled fix, while the same defect ignored is an unplanned breakdown at the worst possible moment. Start free and catch these defects on a daily operator inspection
The "Fail Less Often" Leverinspections and hour-based PM
The cheapest downtime is the breakdown that never happens, and two habits prevent most of them. First, daily operator inspections. OSHA already requires powered industrial trucks to be examined before each shift or after each use, so the checklist is part of the job — the question is whether it produces data. A digital inspection turns "the horn's out" into a tracked defect that gets fixed on schedule, instead of a verbal note that's forgotten until the truck fails.
Second, preventive maintenance timed to hours, not the calendar. Forklifts wear by how hard they run, not by the date. A three-shift truck hits its service intervals far faster than a light-use one, so calendar PM either over-services the light truck or dangerously under-services the heavy one. Hour-based PM ties the service to accumulated operating hours — when the software knows a truck's hours, it flags the 250- or 500-hour service as it comes due and generates the work order automatically. Accurate hours are the foundation; get those wrong and every PM decision downstream is off. Book a demo to schedule forklift PM by operating hours
The "Fix It Faster" Levershortening the defect-to-repair cycle
The second lever is speed. When a truck does go down, every hour until it's back is downtime you're paying for — and most of that time isn't the wrench turning, it's the waiting. A defect reported verbally that sits until someone acts, a part that isn't stocked, a work order nobody prioritized: those gaps are the real MTTR killers. Compressing them is where a workflow earns its keep.
- 1DetectOperator spots and reports the defect — instantly and digitally, not "I'll mention it later."
- 2RouteThe defect becomes a work order and reaches maintenance automatically, prioritized by severity.
- 3PartsThe needed part is in stock or already on order — the most common cause of a repair that drags.
- 4Repair & returnTech fixes it, closes the work order, and the truck is back — with the whole cycle timed so you can shorten it.
The single biggest lever inside MTTR is usually parts availability — a truck waiting days for a part is down for reasons that have nothing to do with the repair itself. That's why downtime reduction and parts inventory are the same problem: stock the consumables your fleet actually fails on, and the defect-to-repair cycle collapses. Book a demo to move defects into prioritized work orders automatically
The Math: MTBF, MTTR & Availabilitythe three numbers, with simple examples
You can't improve what you don't measure, and three linked metrics turn "the trucks break too much" into something you can track. They're simpler than they sound.
A few honest cautions so the numbers stay meaningful: use operating hours, not calendar time, or a lightly-used truck looks artificially reliable; don't count scheduled PM as a failure, since MTBF is about breakdowns; and measure MTTR as the full time to restore the truck, not just active wrench time, because the waiting is the part you most want to see. Track these per truck and the fleet's weak points become a ranked list. Start free and let availability calculate itself from your work-order data
Planned vs Unplanned Downtimenot all downtime is a problem
One distinction changes how you read your numbers: planned downtime is a scheduled PM you chose, done at a convenient time with the truck deliberately offline. Unplanned downtime is a breakdown you didn't choose, at the worst possible moment, disrupting the schedule. The goal isn't zero downtime — it's shifting the mix from unplanned to planned.
A fleet with high planned downtime and low unplanned downtime is actually healthy — it's catching problems on its own terms. A fleet with low total downtime but almost all of it unplanned is a fleet running on luck, one breakdown away from a bad day. When you shift hours from the unplanned column to the planned column — by catching defects early and servicing on time — total downtime often drops and the remaining downtime stops surprising you. That's the real win: not just less downtime, but downtime you control.
Find the Trucks and Causes Eating Your Uptimeroot-cause analysis and the high-downtime few
Downtime is rarely spread evenly. In most fleets a handful of trucks and a handful of failure types account for the majority of lost hours — and finding them is where the biggest gains hide. This is only possible when downtime is tracked, because you can't rank what you don't record.
Start by identifying your high-downtime assets. Rank trucks by downtime hours or availability, and the worst offenders jump out — often one or two aging units drag the whole fleet's numbers, and when a single truck's repair costs and downtime keep climbing, that's the objective signal it's cheaper to replace than keep fixing. Then do root-cause analysis on failure types: if the same component keeps failing across trucks, the fix isn't another repair but addressing the cause — an operator-training issue, a wrong part, a PM interval set too long. Attack the few failure modes causing most downtime first. Book a demo to rank trucks by downtime and spot recurring failures
Forklift downtime reduction checklist
A working checklist, organized by the two levers plus the measurement that tells you it's working.
- Digital daily operator inspection on every truck
- PM scheduled by operating hours, not calendar
- Accurate hour capture feeding the PM schedule
- Root-cause fixes for recurring failures
- Address operator-damage patterns with training
- Defects auto-route into prioritized work orders
- Stock the parts your fleet actually fails on
- Time the full defect-to-repair cycle
- Track availability, MTBF, and MTTR per truck
- Rank high-downtime assets and act on the worst
The two columns aren't separate projects — they're the same system. Catch defects early, service on hours, route repairs fast, stock the right parts, and measure it all, and the trucks simply spend more time working.
From an operations director who cut unplanned downtime
We weren't actually breaking down more than anyone else — we just never knew a truck was in trouble until it stopped. Every failure was a surprise, and a surprise at 2 p.m. on a heavy day is the most expensive kind.
Two changes did it. The operators started doing real digital inspections, so we caught the weeping hoses and the tired batteries before they quit. And defects went straight to a work order with the parts flagged, so repairs stopped waiting three days for someone to notice. I can't give you a magic percentage, but our downtime moved from mostly unplanned to mostly planned — and that changed everything about how the floor runs.
Reducing forklift downtime: the takeaway
Reducing forklift downtime isn't a single fix — it's a system built on two levers you pull at once. Catch defects early and service by hours so failures happen less often; route repairs fast and stock the right parts so they're resolved quickly when they do; and measure availability, MTBF, and MTTR so you know which trucks and causes to attack first. Do that and unplanned breakdowns give way to planned maintenance, the floor stops absorbing surprises, and your equipment spends its hours doing what you bought it to do. Book a demo to see forklift reliability and uptime in one HVI dashboard
Frequently asked questions
How do you reduce forklift downtime?
Forklift downtime comes down to two levers, and reducing it means pulling both. The first is making failures happen less often: run a digital daily operator inspection on every truck to catch defects like weeping hydraulic hoses, worn tires, or a fading battery before they cause a breakdown, and schedule preventive maintenance by operating hours rather than the calendar so each truck is serviced based on how hard it actually works. The second lever is fixing failures faster when they do happen: route reported defects straight into prioritized work orders so nothing sits waiting to be noticed, keep the parts your fleet commonly fails on in stock so repairs don't stall waiting for components, and time the full defect-to-repair cycle so you can shorten it. Underpinning both is measurement — tracking availability, MTBF, and MTTR per truck reveals which assets and failure types cause the most downtime, so you fix the biggest problems first rather than spreading effort evenly.
How do you calculate forklift uptime and availability?
Availability is the percentage of time a forklift is operational, and the standard formula is Availability = MTBF ÷ (MTBF + MTTR). MTBF (Mean Time Between Failures) is operating hours divided by the number of failures — for example, a truck that runs 1,000 hours and fails 4 times has an MTBF of 250 hours. MTTR (Mean Time To Repair) is total repair time divided by the number of repairs — if those 4 repairs took 20 hours total, MTTR is 5 hours. Plugging in: 250 ÷ (250 + 5) = 0.98, or about 98% availability. You can also calculate availability directly as uptime divided by total time (uptime plus downtime). A few cautions keep the numbers honest: use operating hours rather than calendar time so a lightly-used truck doesn't look artificially reliable, don't count scheduled preventive maintenance as a failure since MTBF measures breakdowns, and measure MTTR as the full time to restore the truck, including waiting, not just active wrench time.
What is MTBF and MTTR for forklifts?
MTBF and MTTR are the two reliability metrics that together determine equipment availability. MTBF, Mean Time Between Failures, measures how long a forklift typically runs between breakdowns — calculated as operating hours divided by the number of failures. A higher MTBF means the truck fails less often, and it's improved by earlier defect detection, on-time preventive maintenance, and fixing the root causes of recurring failures. MTTR, Mean Time To Repair, measures how long it takes to get a failed truck back in service — calculated as total repair time divided by the number of repairs. A lower MTTR means faster recovery, and it's improved by routing defects quickly into work orders, stocking the right parts so repairs don't wait, and streamlining the repair workflow. The two work in opposite directions on the same goal: raising MTBF reduces how often you have downtime, while lowering MTTR reduces how long each downtime lasts. Availability = MTBF ÷ (MTBF + MTTR) ties them together, so improving either one raises uptime.
How does preventive maintenance reduce forklift downtime?
Preventive maintenance reduces downtime by converting unplanned breakdowns into planned service, which is the core of downtime reduction. An unplanned breakdown happens at the worst possible moment, disrupts the schedule, and often takes longer to resolve because it's unexpected and the parts may not be on hand. Planned PM, by contrast, happens on your schedule, at a convenient time, with the truck deliberately taken offline and the work anticipated. By servicing components before they fail — replacing wear parts, checking hydraulics, maintaining batteries on their proper cycle — PM directly raises MTBF, meaning failures occur less often. The key to effective PM on forklifts is timing it to operating hours rather than the calendar, because a truck running three shifts wears far faster than one used a few hours a day. When maintenance is tied to actual accumulated hours, each truck is serviced exactly when its usage warrants, preventing both the over-servicing of light-use trucks and the dangerous under-servicing of heavy-use ones. The result is fewer surprise failures and downtime you control.
How do you identify which forklifts cause the most downtime?
You identify high-downtime forklifts by tracking downtime per asset and ranking the fleet, which requires recording every defect, repair, and its duration in one system rather than relying on memory. Once downtime is tracked, rank trucks by total downtime hours or by availability percentage, and the worst offenders become obvious — in most fleets a small number of assets account for a disproportionate share of lost hours. Aging units with climbing repair costs and frequent failures usually top the list, and when a single truck's cumulative downtime and repair spending keep rising, that's the objective basis for a replace-versus-repair decision. Beyond individual trucks, analyze failure types across the fleet through root-cause analysis: if the same component fails repeatedly on multiple machines, the solution isn't another repair but addressing the underlying cause, whether that's an operator-behavior pattern, a wrong or low-quality part, or a preventive-maintenance interval that's set too long. The principle is to attack the few trucks and failure modes causing most of the downtime first, rather than spreading maintenance effort evenly across problems of very different sizes.
Turn surprise breakdowns into planned maintenance
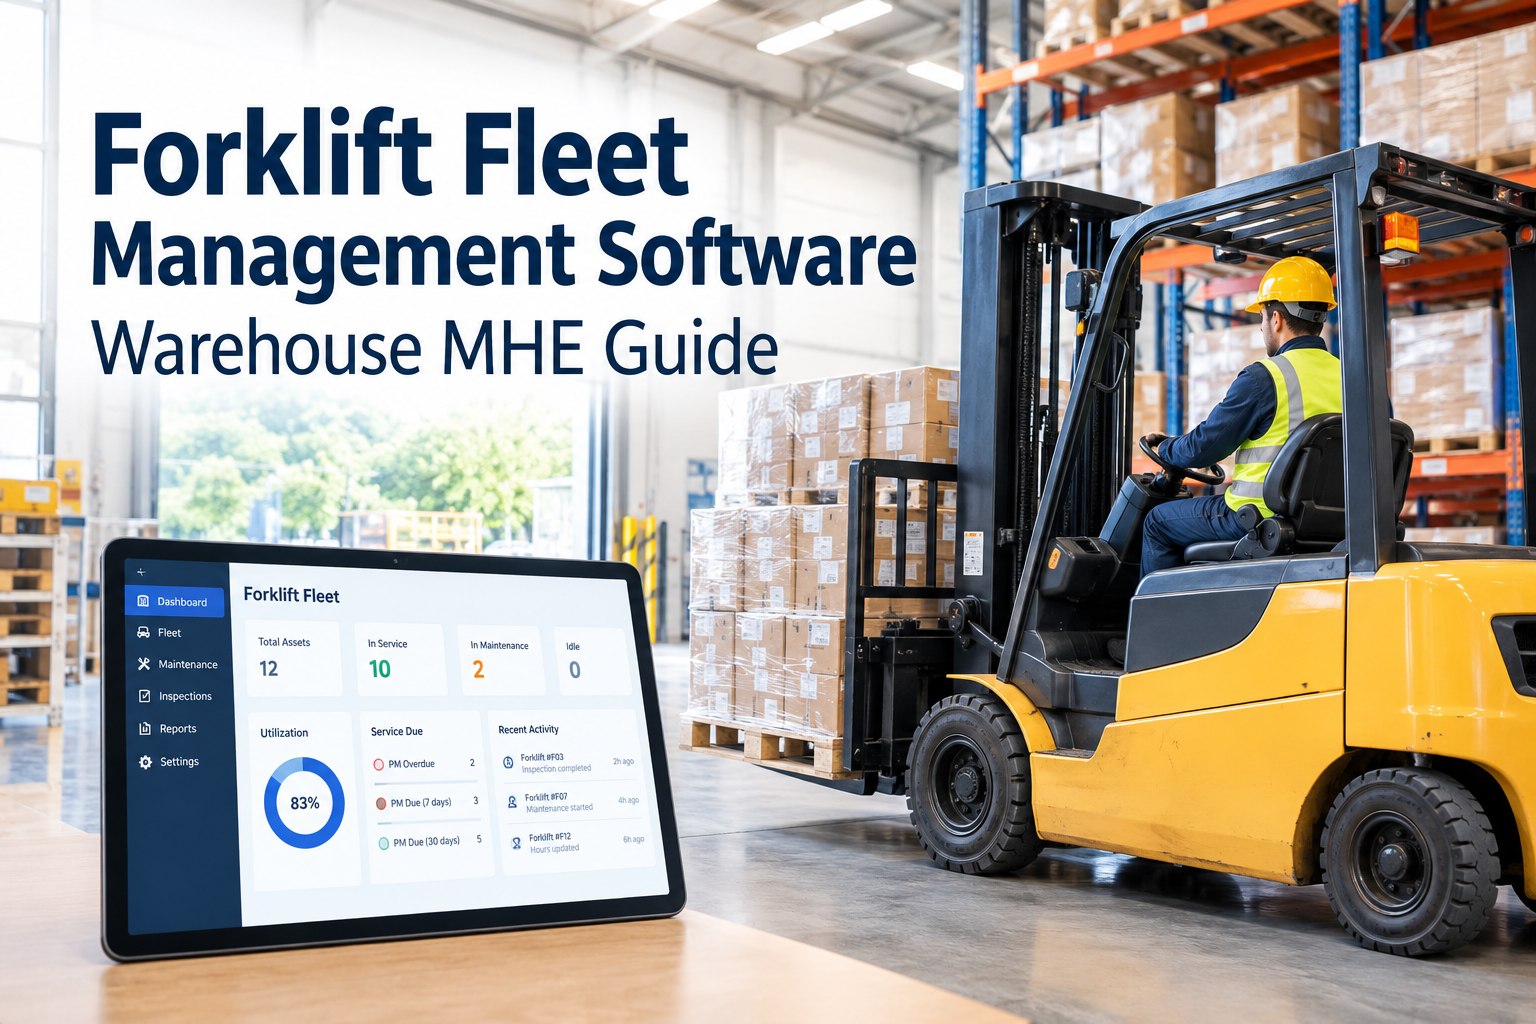
HVI pulls both uptime levers in one platform — daily operator inspections and hour-based PM to make failures rarer, plus defect-to-work-order routing and parts tracking to make repairs faster — and surfaces availability, MTBF, MTTR, and your highest-downtime trucks so you know exactly where to act. Less unplanned downtime, more time on the floor, all measured.
No credit card · No hardware required to start · Reliability analytics on day one