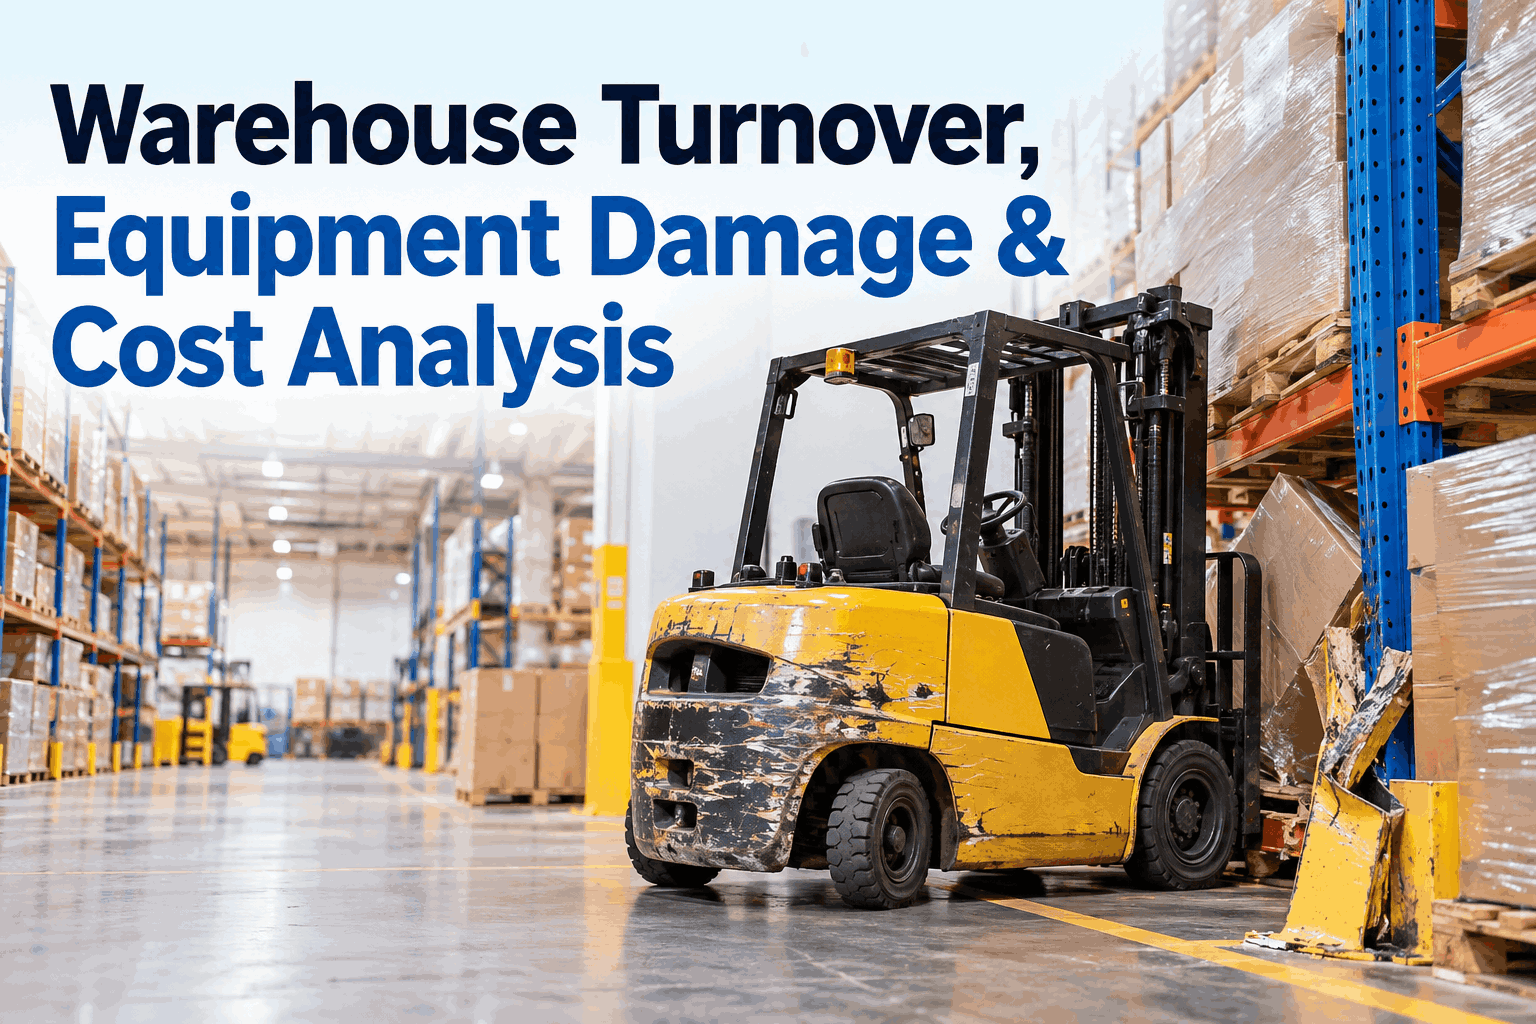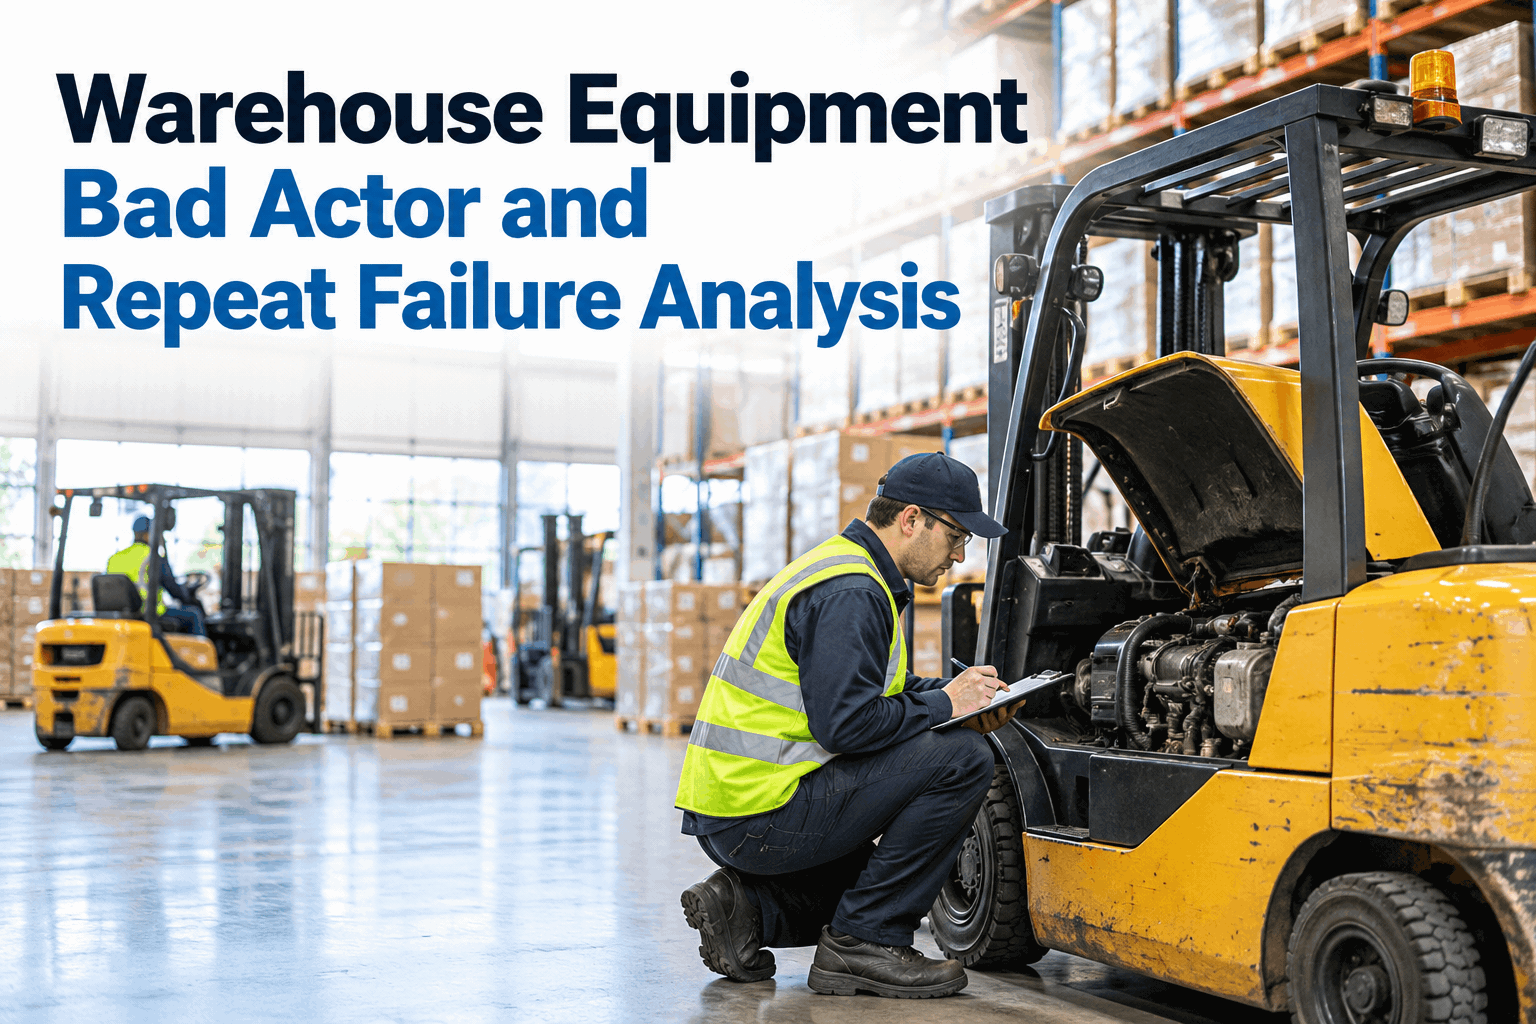
You know the feeling: the same reach truck is back in the bay for the third time this quarter, same hydraulic complaint, another repair you've already paid for twice. Warehouse equipment repeat failure analysis — finding the "bad actors" quietly eating your budget — turns that gut feel into ranked data. This guide shows how to spot the chronic offenders and fix the cause, not the symptom. Book a bad-actor analysis demo to see it on your fleet.
A few machines are burning most of your maintenance budget
On almost every warehouse fleet, a small cluster of forklifts and reach trucks accounts for a huge share of downtime and repair cost. Rank them, find out why, and stop paying for the same breakdown twice.
-
1
FL-07 · Reach truck$9,400
-
2
FL-12 · Counterbalance$6,100
-
3
FL-21 · Pallet truck$3,250
You don't fix a reliability problem by working harder on every machine equally — you find the few that are dragging the whole fleet down and go after those first. That's bad actor analysis. Below is how to rank your equipment three different ways, tell a chronic machine apart from a chronic fault, and run the investigation that actually ends the repeat.
80 / 20why a handful of assets drives most of your repair bill
The Pareto principle holds in almost every maintenance operation: roughly 20% of your equipment generates about 80% of the downtime and cost. Bad actor analysis is simply finding that 20% — and a Pareto view makes it impossible to miss.
The repair invoice is usually the smallest number in a breakdown — the lost picks, the idle labor, the missed outbound truck cost far more. Which is why chasing the biggest Pareto bars, not the loudest complaint, is where real money gets recovered. Book a demo of failure-mode Pareto reporting on your own work-order data.
Three listsrank by downtime, cost and frequency — each finds a different risk
A single "worst equipment" list hides as much as it shows. Rank the same fleet three ways and three different bad actors surface — each one a different operational problem.
Surfaces the asset that's hurting throughput most — the one idling doors and picks even if each repair is cheap.
Surfaces the budget drain — maybe it runs fine but every fix is expensive, signaling end-of-life or wrong spec.
Surfaces the chronic repeater — small faults, over and over. Often a procedure, operator or root-cause problem.
The forklift that's cheap to fix but down constantly won't appear on a cost list; the one that costs a fortune per repair but rarely fails won't appear on a frequency list. Run all three and prioritize what shows up on more than one. See equipment performance reporting that ranks every asset across all three measures, or book a demo of three-way asset ranking.
Sick machine or sick fault?the difference that decides your corrective action
A repeat failure means one of two very different things — and they call for opposite fixes. Reading it wrong wastes the whole investigation.
One forklift keeps failing
The same unit fails repeatedly across different systems, or on one system other identical units don't share. The problem travels with the machine.
The same fault hits many machines
Several units of the same type fail the same way. The problem travels with the model, the duty or the procedure — not one machine.
Replace the hydraulic pump on FL-07 five times and you've treated a symptom; find that every reach truck on the frozen-aisle route fails the same seal because of cold-start duty, and you've found a fleet-wide fix. See work-order histories grouped by asset and fault to tell the two apart fast.
Garbage inthe data your analysis is only as good as
Bad actor analysis runs on clean records. Skip these and your rankings are noise — you'll chase the wrong machine with confidence.
"Hydraulic leak" logged five ways can't be grouped. One code set, used every time.
Every repair captured against the right unit, with parts and labor — not fixed off the books.
Cost per hour needs real meter readings — a cheap machine run 3x more isn't actually cheap.
Repeat failures only show up when past jobs on each asset are kept and searchable.
This is where a paper or spreadsheet system quietly fails: records scatter, codes drift, and the pattern never surfaces. A connected maintenance system keeps codes, hours and history tied to each asset by default. Sign up free and standardize your defect codes from the first work order.
The investigationa bad-actor equipment investigation checklist that ends the repeat
Once a machine or fault tops your list, don't just book another repair — run it through this. Each line is a question that points at a root cause instead of a symptom.
Application & load
- Is the machine spec'd for the load and lift height it actually runs?
- Is it carrying over-capacity or off-center loads regularly?
- Does its duty cycle match what it was bought for?
Operator practices
- Do failures cluster on one shift, route or operator?
- Is the unit logging impact or rough handling events?
- Are pre-use inspections being done and logged?
Environment
- Cold store, wet dock, dusty aisle, uneven floor?
- Does the failing component hate that environment?
- Is yard or floor surface damaging tires and frames?
PM & past repairs
- Is the PM task for this failure mode actually effective?
- Did a previous repair use the wrong part or skip a step?
- Was the last "fix" treating a symptom, not the cause?
Attach a photo of the failed component to each finding, log the corrective action, and schedule a follow-up inspection to confirm it held. That closes the loop — the repeat only counts as solved when it doesn't come back. See photographic defect evidence on work orders, and for the pre-use side there's a dedicated forklift daily inspection guide.
Four numbersthe reliability KPIs that measure whether you're winning
Track these per asset and the bad actors can't hide — and you can prove a corrective action actually worked.
Cost per operating hour is the one that settles arguments: a machine that looks cheap on a cost list but runs triple the hours may be your most expensive asset per hour of work. Book a demo of per-asset reliability KPIs trended over time.
In the systemwhat a repeat offender looks like on the asset record
- Aug 14Hydraulic lift — slow, won't hold$2,100
- Sep 02Hydraulic lift — same fault, reseal$2,400
- Oct 09Hydraulic lift — 3rd recurrence$2,900
Three hydraulic repairs on one unit in eight weeks, same fault, climbing cost — the system flags it as a bad actor and opens a review before a fourth invoice lands. That's the shift from repairing symptoms to killing root causes. See how PM optimization closes the loop after a root cause is found.
From the maintenance office
For years we just fixed whatever screamed loudest. When we finally ranked the fleet by cost per hour and repeat rate, four of our twenty-six trucks were eating more than half the budget — and three of them were the same hydraulic fault from one cold-aisle route. We fixed the route's PM task, not the trucks, and the repeat rate on that fault dropped to near zero. The data was sitting in our work orders the whole time; we just couldn't see it.
Warehouse equipment repeat failure analysis FAQs
What is bad actor equipment analysis?
It's finding the small number of assets — or failure modes — that cause a disproportionate share of your downtime and maintenance cost, then targeting them first. The name comes from reliability engineering, and the method rests on the Pareto principle: roughly 20% of equipment usually drives about 80% of the trouble.
Why rank equipment three different ways?
Because downtime, cost and frequency each reveal a different risk. A cheap-but-constantly-down machine hurts throughput; an expensive-per-repair one drains budget; a frequent small-fault repeater signals a procedure or root-cause issue. Ranking only one way hides the other two. Prioritize assets that appear on more than one list.
How do I tell a chronic machine from a common failure mode?
If one unit keeps failing across systems, or on a fault its identical siblings don't share, the problem travels with the machine — fix or retire it. If many units of the same type fail the same way, the cause is spec, duty, procedure or component quality — fix the process, not one unit.
What data do I need before I start?
Consistent failure codes, accurate work orders tied to the right asset, real operating hours, and full repair history. Without clean records the rankings are noise. This is where paper and spreadsheets break down — codes drift and history scatters, so the repeat pattern never surfaces.
Which KPIs measure repeat-failure progress?
Mean time between failures (MTBF), mean time to repair (MTTR), repeat failure rate, downtime hours, and maintenance cost per operating hour. Cost per hour is the fairest comparison between machines, and a falling repeat failure rate is the clearest proof a corrective action actually worked.
Find your bad actors before they bill you again
HVI ties every defect, work order, repair cost and operating hour to the asset — so repeat offenders rank themselves, root-cause reviews open automatically, and you fix the cause instead of the symptom. Photographic defect evidence, cost-per-hour reporting and PM optimization, live in under two weeks.
No credit card · Equipment reliability reporting from day one