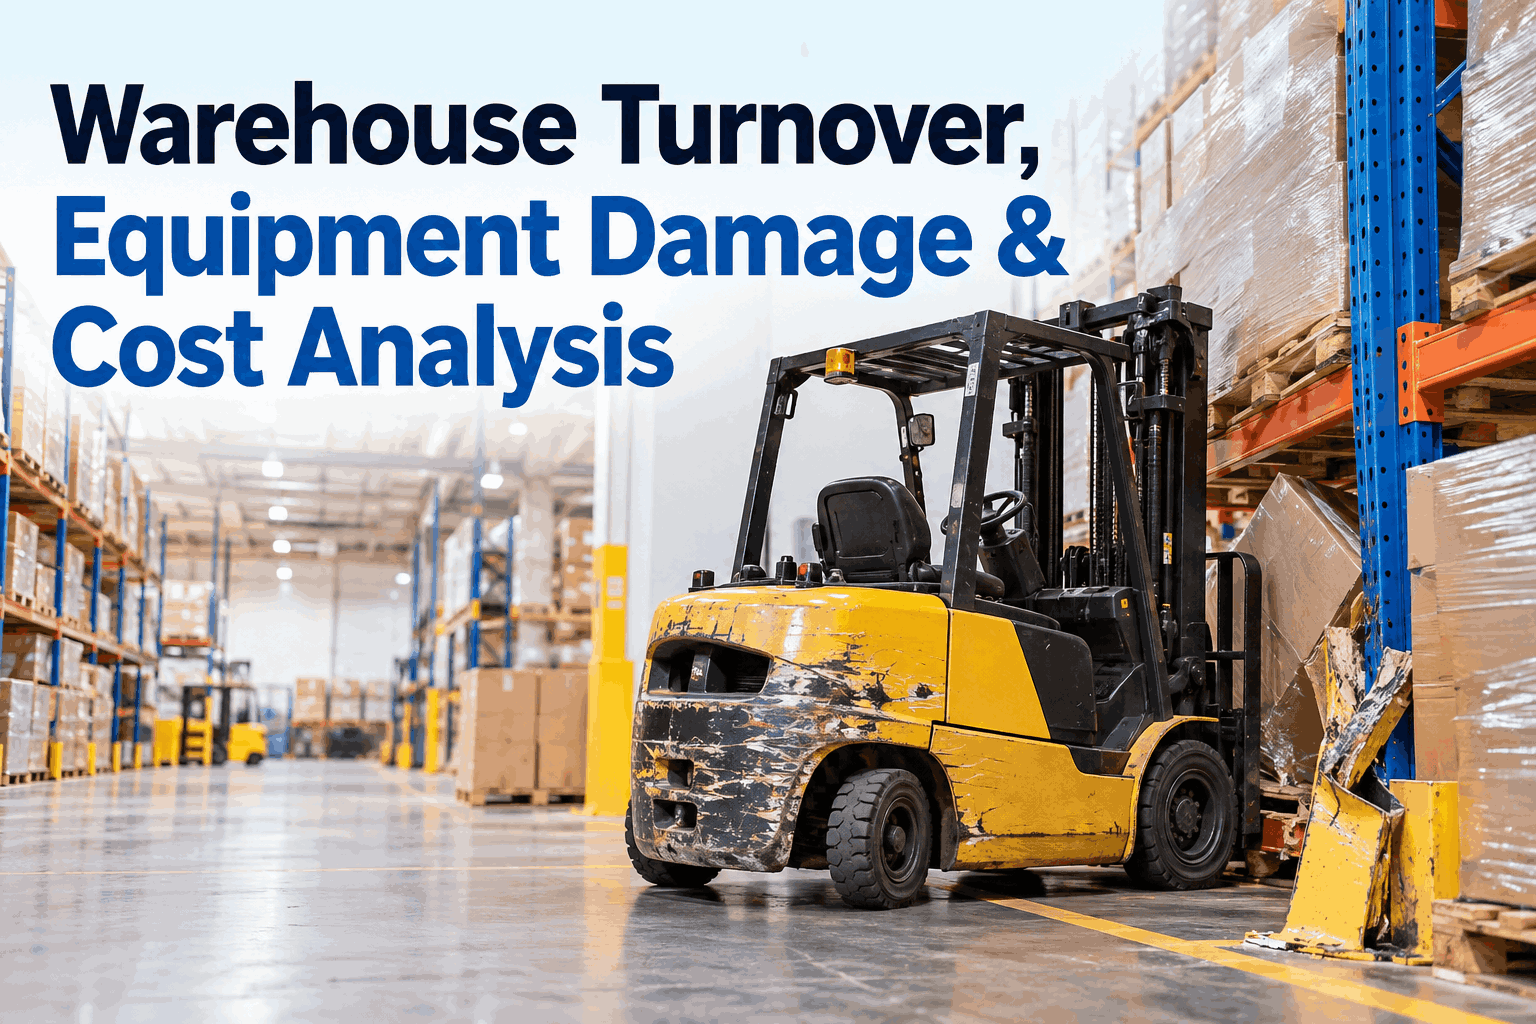
Warehouse turnover cost can extend beyond recruiting, onboarding and training expenses. Workforce changes may coincide with equipment damage, repair work, qualification gaps and operational disruption—but turnover alone does not prove what caused those losses. A stronger approach is to connect damage events, maintenance costs, operator experience and operating conditions, then test whether meaningful patterns actually exist.
What Is Equipment Damage Really Costing Your Warehouse?
Connect operator turnover, experience, qualifications, damage reports and repair costs to find patterns worth acting on—without assuming that newer operators are automatically the problem.
Compare multiple variables before drawing conclusions.
A warehouse may know its employee turnover rate and its annual forklift repair spend while still having no reliable way to determine whether the two are related. Equipment damage analysis becomes more useful when individual incidents are connected to asset condition, repair cost, operator experience, qualification status, shift, work area and exposure. HVI can help teams capture those operational records and bring them into a more consistent maintenance history. See how HVI can support warehouse damage and cost tracking.
Do Not Assume Warehouse Operator Turnover Causes Equipment Damage
A correlation may exist in a particular operation, but it should be measured rather than presumed. New operators, experienced operators and temporary workers can all operate under different levels of exposure, equipment condition, workload and supervision.
Analysis principle: operator experience is one variable. Equipment type, utilization, work area, shift, workload, traffic conditions, equipment condition and incident exposure can materially change the comparison.
Forklift Damage Cost Is More Than One Repair Invoice
The most useful starting point is a consistent incident and maintenance record. Separate costs that can be measured directly from operational effects that require additional evidence.
Capture Enough Context to Explain the Event Later
A repair total alone cannot explain why damage occurred. The incident record should preserve enough operational context to support later comparison without turning the report into an investigation based on memory.
Consistent damage reporting gives maintenance and operations teams a common starting point. It can also prevent later analysis from depending on incomplete work orders or informal explanations. Explore HVI safety and operational record workflows.
Compare Damage by Exposure, Not Just by Headcount
If one experience group operates twice as many hours, handles more difficult assignments or works in higher-traffic areas, raw incident totals can create a misleading comparison.
Bars illustrate why exposure should be considered; they do not represent expected damage rates.
Six Variables Can Change the Meaning of Equipment Damage Analysis
Before attributing a pattern to operator tenure or turnover, compare the surrounding operating conditions. Differences in exposure can be more informative than the workforce label alone.
Different forklifts and material handling equipment can have different assignments and operating environments.
Hours, cycles or another useful exposure measure can help normalize comparisons.
Tight aisles, docks, staging areas and high-traffic zones can create different operating conditions.
Staffing, traffic, workload and supervision may vary across operating shifts.
Connect the relevant operator qualification and training records to the analysis.
Volume, task complexity and peak periods can change exposure to equipment and infrastructure damage.
Stop Losing the Story Between the Incident Report and Repair Invoice
Connect damage events, asset histories, repair costs and qualification records so recurring patterns are easier to investigate.
Follow Warehouse Equipment Damage Through the Full Maintenance History
The initial damage report is only the beginning. Repair findings, parts, labor, repeat defects and return-to-service information can provide additional context that the incident record alone cannot show.
Record the event, asset, area and operating context.
Document findings and maintenance work performed.
Associate parts, labor and relevant external costs.
Compare recurring events across relevant operating variables.
Choose interventions supported by the observed pattern.
Connecting the maintenance history also helps distinguish a one-time operator event from repeated asset problems. A machine with recurring steering, braking, visibility or attachment issues should not automatically be treated as a workforce-performance problem. See HVI damage and maintenance workflows in a demo.
Patterns Become More Useful When You Can See Where Damage Concentrates
Instead of reviewing incidents as an undifferentiated total, segment them across the dimensions that can influence warehouse operations.
Training Records Add Context, but They Are Not a Shortcut to Cause
Qualification and training records can help answer whether the operator had completed the relevant process or whether a refresher action followed an event. They should be analyzed alongside equipment and operational evidence rather than used as the sole explanation.
Compare events using consistent experience or qualification categories.
Determine whether assigned onboarding or follow-up actions were completed.
A training record alone does not establish why a specific damage event occurred.
Different Patterns Should Lead to Different Damage-Prevention Measures
The purpose of analysis is not simply to produce a turnover-versus-damage chart. It is to identify the operational control most likely to address the observed pattern.
Evaluate whether initial task preparation, familiarization or supervised operating time needs adjustment.
Examine aisle constraints, intersections, staging practices and equipment interaction in that area.
Investigate asset history, suitability, visibility, controls and recurring maintenance findings.
Consider whether congestion, staffing, scheduling or task pressure changes exposure during peaks.
Build a Repeatable Review in Six Steps
Use the same structure over time so the operation can compare periods consistently instead of rebuilding the analysis after every costly incident.
Capture asset, location, shift, damage type and relevant operating context consistently.
Associate repair work, parts, labor and external service with the affected equipment.
Use appropriate experience bands, qualification status and other relevant records.
Consider utilization, assignments, work area, workload or another meaningful exposure measure.
Compare assets, shifts, areas and operator groups instead of focusing on isolated events.
After changing onboarding, traffic controls, maintenance or another process, continue tracking results.
HVI can help centralize damage reports, maintenance histories, repair costs and qualification records used in this process. Start building a more connected equipment record.
Measure the Relationship Before You Spend Money Solving the Wrong Problem
Warehouse turnover cost can include more than hiring and onboarding, but equipment damage should not automatically be attributed to workforce turnover. The stronger approach is to connect damage events with repair costs, equipment histories, operator experience, qualification records, work areas, shifts and meaningful measures of exposure.
That analysis can reveal very different problems. A pattern may support changes to onboarding or refresher training, but it may instead point toward traffic flow, congestion, equipment condition, workload, supervision or a specific warehouse zone. The value comes from identifying the pattern before choosing the intervention.
HVI helps warehouse teams capture damage and defects, maintain equipment service histories and costs, track operator qualifications and review recurring operational patterns across assets and locations. Book a demo to explore warehouse damage and maintenance cost tracking with HVI.
Warehouse Turnover & Equipment Damage FAQs
Does warehouse employee turnover increase equipment damage?
It should not be assumed automatically. A warehouse can compare damage events and repair costs with operator experience while also considering equipment type, utilization, work area, shift, workload and other exposure factors. The resulting operational data can show whether a meaningful pattern exists in that facility.
How should forklift damage cost be measured?
Start with costs that can be consistently associated with the event or asset, such as parts, maintenance labor and external repair. Other documented losses can be included when the organization has a consistent method for measuring them. Keep calculated or estimated indirect costs distinguishable from recorded repair spend.
What data is useful for equipment damage analysis?
Useful records can include equipment ID and type, damage type, date, shift, work area, maintenance findings, repair costs, operator experience or tenure band, relevant qualification status and an appropriate measure of operating exposure. The exact fields should reflect the warehouse's operations and analysis goals.
How can operator training records support damage prevention?
Training and qualification records can help segment incidents, verify whether relevant requirements or internal actions were completed, and identify where targeted onboarding or refresher activity may be appropriate. They should be interpreted with other operational evidence rather than treated as proof of incident cause.
How can HVI help track warehouse equipment damage and costs?
HVI can help teams capture equipment damage and defects, maintain service histories, associate maintenance costs with assets, retain operator qualification records and review recurring patterns across equipment, locations and operations.
Connect Every Damage Event to the Equipment History Behind the Cost
Bring damage reporting, repair histories, maintenance costs and qualification records into a more consistent operational picture.