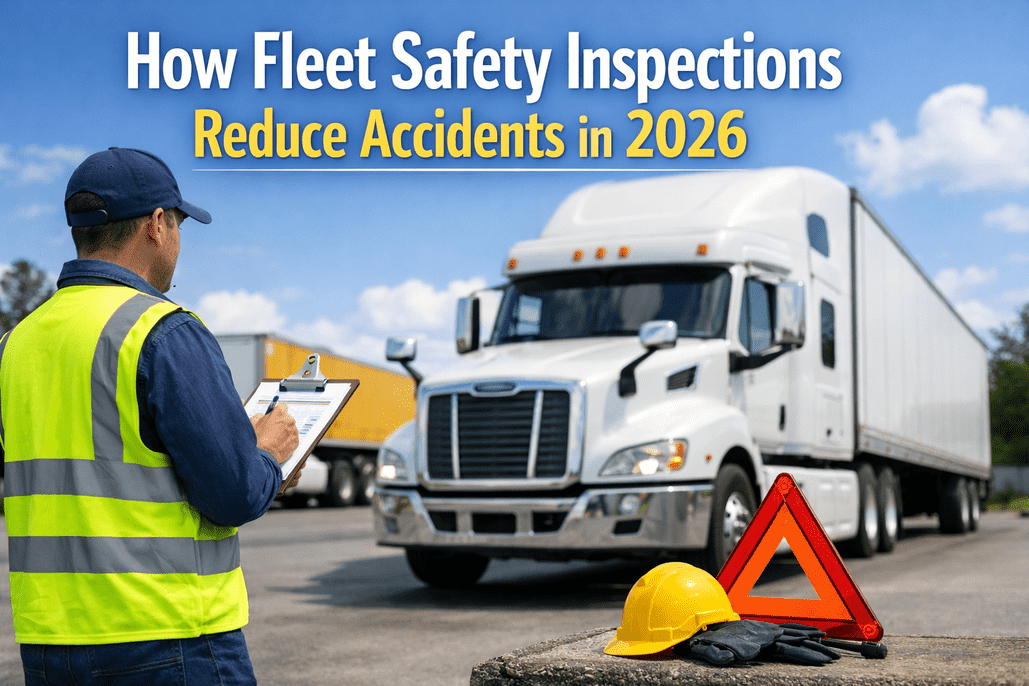
Vehicle crashes are the leading cause of workplace fatalities, costing U.S. employers $72 billion annually. Yet 80% of equipment failures show detectable warning signs 30-90 days before breakdown—signs that structured safety inspections are designed to catch. In 2026, with the new CSA scoring methodology placing greater accountability on driver-observed defects and AI-powered inspection technology achieving 95%+ accuracy, the connection between inspections and accident prevention has never been clearer. This guide shows how structured fleet safety inspections reduce accidents, which components pose the greatest risk, and how to build a safety culture where prevention becomes everyone's responsibility.
The True Cost of Unsafe Fleets
Avoiding even one serious crash can offset the entire annual cost of a safety inspection program.
Ready to strengthen your fleet's safety posture? Start your free trial with HVI and access digital inspection tools that catch defects before they cause accidents.
Safety Risks in Fleets
Understanding where accidents come from is the first step to preventing them. Fleet safety risks fall into three interconnected categories: vehicle condition, driver behavior, and operational factors. Inspections directly address vehicle condition and provide early warning signals for all three.
The Three Risk Categories
Vehicle Condition Risks
Mechanical failures that inspections are designed to catch: brake systems, tires, lights, steering, suspension, and coupling devices.
Driver Behavior Risks
Human factors: speeding, distraction, fatigue, HOS violations, and inadequate inspection practices.
Operational Risks
Systemic factors: inadequate maintenance schedules, poor route planning, cargo securement issues, and insufficient training.
The Safety Risk Pyramid
For every serious accident, there are hundreds of near-misses and thousands of at-risk conditions. Inspections intervene at the base of this pyramid—catching conditions before they become incidents.
2025 Roadcheck: The Safety Snapshot
CVSA's 2025 International Roadcheck inspected 56,178 vehicles and drivers across North America, revealing the current state of fleet safety:
Inspection as a Safety Tool
Inspections aren't paperwork—they're the front line of accident prevention. Every inspection is an opportunity to identify defects that could cause crashes, injuries, or fatalities. In 2026, digital inspection tools, AI-assisted detection, and real-time data make inspections more effective than ever at protecting drivers and the public.
How Inspections Prevent Accidents
Early Detection
80% of equipment failures show warning signs 30-90 days early. Inspections catch developing problems before they cause failures, preventing 60-80% of emergency breakdowns.
Condition Verification
Every inspection verifies safety-critical components meet standards before operation—catching the 18% of vehicles that would fail roadside inspection.
Driver Awareness
The act of inspecting builds awareness of vehicle condition. Drivers who inspect thoroughly report 20-30% more defects.
Accountability Chain
Documented inspections create accountability. 2026 CSA now tracks "Driver Observed" violations separately—drivers own what they should catch.
Safety-Focused Inspection Framework
Pre-Trip Inspection
Every TripRequired before operating any CMV. Verifies the vehicle is safe and roadworthy. This is the first line of defense against safety-critical defects.
Post-Trip Inspection
End of DayDocuments defects discovered during operation. Enables overnight repairs before the vehicle's next dispatch.
Technician Safety Check
WeeklyTrained technicians inspect components drivers can't fully evaluate: brake adjustment, under-vehicle inspection, suspension, steering play.
Annual DOT Inspection
Every 12 MonthsComprehensive inspection per 49 CFR 396 Appendix A. Verifies vehicle meets all federal safety standards.
The Digital Inspection Advantage
Paper inspections miss defects, create communication gaps, and provide no accountability. Digital inspections transform safety outcomes:
Photo Documentation
Visual evidence of component condition. Eliminates "pencil-whipping" and provides proof of inspection quality.
GPS/Time Verification
Confirms inspection occurred at the right place and time. Walk-around pattern verification prevents shortcuts.
Instant Defect Alerts
Failed items notify maintenance immediately. No waiting for paper to arrive—defects addressed same-day.
AI-Assisted Detection
AI systems achieve 95-99% defect detection vs. 70-80% manual. Technology catches what humans miss.
See how digital inspections improve safety outcomes. Book a demo with HVI to experience photo-documented, GPS-verified inspections.
High-Risk Components
Not all vehicle components carry equal safety risk. Some failures are inconvenient; others are catastrophic. Understanding which components pose the greatest danger—and inspecting them with appropriate rigor—is essential to accident prevention.
2025 Roadcheck: Vehicle Out-of-Service Violations
These are the components that failed inspection and required vehicles to be taken off the road:
Critical Safety Components
Brake Systems
HIGHEST RISK- Brakes out of adjustment (3,304 OOS in 2025)
- 20%+ of brakes defective (2,257 OOS)
- Air leaks at brake chamber
- Worn linings/pads
- Missing or inoperative brakes
- Daily: Visual check of connections, air lines, leaks
- Weekly: Brake adjustment measurement by technician
- Monitor: Stroke length, pad/shoe thickness
Tires
HIGH RISK- Insufficient tread depth (<4/32" steer, <2/32" other)
- Underinflation (<50% of max pressure)
- Exposed cord or belt material
- Cuts, bulges, or damage
- Improper repairs or load rating
- Daily: Visual check for damage, inflation, obvious wear
- Weekly: Tread depth measurement, pressure check
- Document: Wear patterns that indicate alignment issues
Lighting Systems
MODERATE RISK- Inoperative headlights, brake lights, tail lights
- Missing or defective turn signals
- Inoperative clearance/marker lights
- Missing reflective materials
- Defective or dirty lamps
- Daily: Function test of all lights before operation
- Pre-trip: Verify brake lights with helper or reflection
- Clean: Lenses as needed for visibility
Steering & Suspension
MODERATE RISK- Excessive steering wheel play
- Damaged or worn steering components
- Broken or missing suspension parts
- Leaking shock absorbers
- Cracked or broken springs
- Daily: Check for unusual handling, sounds, vibrations
- Weekly: Under-vehicle inspection by technician
- Measure: Steering play against FMCSA limits
Protect Your Fleet with Comprehensive Safety Inspections
HVI provides customizable safety checklists, photo documentation, instant defect alerts, and compliance tracking designed to catch high-risk component failures before they cause accidents.
Start Free Trial Book a DemoMeasuring Safety Outcomes
You can't improve what you don't measure. Effective fleet safety programs track specific metrics that connect inspection activities to accident prevention outcomes. In 2026, data-driven safety management transforms reactive responses into proactive prevention.
Leading vs. Lagging Indicators
Leading Indicators
Predict future safety performance. Focus on these to prevent accidents.
- Inspection completion rate
- Defect discovery rate
- Defect resolution time
- PM compliance rate
- Training completion rate
- Near-miss reporting rate
Lagging Indicators
Measure past performance. Use to validate program effectiveness.
- Accident frequency rate
- Accident severity rate
- Roadside OOS rate
- CSA scores
- Insurance claims
- Workers' compensation costs
Essential Safety KPIs
Inspection Completion Rate
Every required inspection completed on time. Non-negotiable for safety programs.
Defect Discovery Rate
Too low = pencil-whipping; too high = maintenance issues. Red flag: 0-2%.
Safety-Critical Resolution Time
Time to resolve defects that could cause accidents (brakes, steering, tires).
Safety Program ROI
Comprehensive safety programs deliver measurable financial returns beyond accident prevention:
Accident Cost Reduction
- 35-75% reduction in crash rates with full programs
- 24% accident reduction in first 12 months typical
- $26,000 average savings per prevented incident
- $78,000 average savings per prevented injury
Insurance Savings
- 20-40% accident reduction = lower premiums
- 15% premium reduction with dash cams (some providers)
- Faster claims resolution with documentation
- Better negotiating position at renewal
Operational Improvements
- Reduced vehicle downtime from breakdowns
- Lower emergency repair costs (25-40%)
- Extended asset life (15-20%)
- Improved CSA scores for bidding advantage
Human Capital Value
- Improved driver retention (safety culture)
- Reduced workers' compensation costs
- Lower hiring costs (safety reputation)
- Reduced litigation exposure
Track the metrics that matter. Start your HVI free trial and access real-time safety dashboards with automated KPI tracking.
Building a Safety Culture
Technology and processes matter, but culture determines whether they're used effectively. A safety culture means every person—from drivers to executives—prioritizes safety in every decision. In 2026, the most successful fleets treat safety not as a compliance burden but as a core value that drives operational excellence.
The Four Pillars of Safety Culture
Leadership Commitment
Safety culture starts at the top. Leaders must demonstrate commitment through executive involvement, resource allocation, and visible participation in safety activities.
Driver Engagement
Drivers are the front line. Engaged drivers champion safety through open communication, input on procedures, and recognition for safe behaviors.
Accountability
Everyone owns safety. Clear policies, documented training, consistent enforcement, and constructive response to violations at all levels.
Continuous Improvement
Safety culture evolves. Regular reviews, root cause analysis, proactive hazard identification, and technology adoption for prevention.
Build Your Safety-First Fleet in 2026
HVI provides the tools you need: digital inspection platforms, real-time defect tracking, safety analytics, and compliance management—all designed to prevent accidents before they happen.
Sign Up Free Schedule a Demo