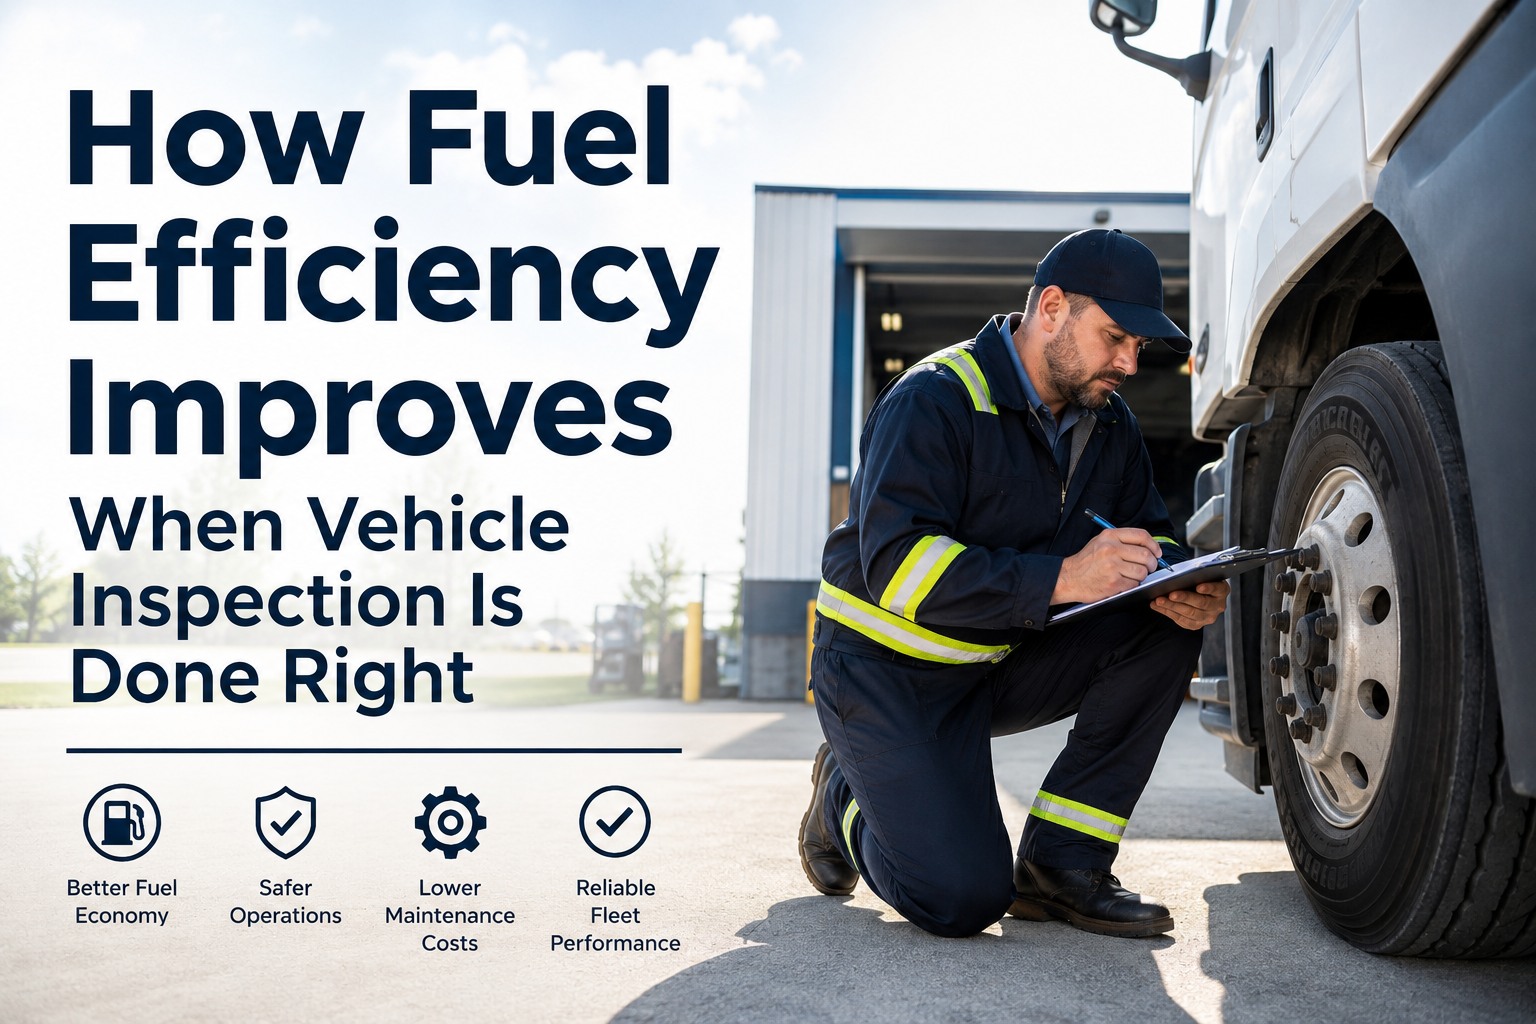
A single under-inflated tyre reduces fuel economy by 0.2% for every 1 PSI below optimal. A dirty air filter costs 3–5% in MPG. A dragging brake burns fuel every mile without the driver knowing. A misaligned steer axle creates rolling resistance that consumes 1–2% more diesel over thousands of miles. None of these are mechanical breakdowns — they are inspection items. Visible, measurable, fixable defects that a proper pre-trip walk-around catches in minutes but that cost fleets thousands in wasted fuel when missed. At $4.00/gallon diesel and 6 MPG, a 100-truck fleet burning just 3% more fuel than necessary wastes $320,000+ annually — money that evaporates invisibly because nobody connected the inspection checklist to the fuel bill. HVI's digital inspection platform closes this connection: guided walk-arounds that catch the specific defects that kill fuel economy, AI photo analysis that detects tyre and component issues drivers miss, and analytics that correlate inspection quality with MPG trends across your fleet.
Your Fuel Bill Is an Inspection Problem
3–8% of fleet fuel waste comes from defects a daily inspection should catch. HVI's guided walk-arounds with AI detection close the gap — saving $3,200–$8,500 per truck annually.
What Inspection Items Affect Fuel Economy Most?
Not every checklist item impacts fuel equally. These six components have the largest, most measurable effect on MPG — and every one is a standard inspection item.
Tyre Pressure & Condition
Every 10 PSI of under-inflation costs 1–2% fuel economy. Mismatched duals create drag. Worn tread increases rolling resistance. A 100-truck fleet with 5% average under-inflation wastes $50,000–$80,000/year in fuel alone.
Inspection action: Pressure gauge check (not visual), tread depth measurement, dual gap verification. HVI AI estimates tread depth from photos and flags approaching minimums.
Air Filter Condition
A clogged air filter restricts airflow, forcing the engine to work harder and consume more fuel. Replacement costs $30–$80 but saves hundreds in fuel over the replacement interval.
Inspection action: Visual check during PM. Restriction indicator inspection during daily walk-around. HVI PM scheduling triggers replacement at optimal intervals.
Dragging Brakes
A brake that does not fully release creates constant friction — burning fuel every mile while accelerating wear. Often undetectable from the cab. Brake drag is one of the most expensive hidden fuel thieves in heavy vehicle operations.
Inspection action: Check for heat at wheel hubs during walk-around (hot hub = possible drag). Pushrod travel check. HVI guided checklist includes brake-specific photo verification at every inspection.
Wheel Alignment
Misaligned steer axles create lateral resistance that the engine must overcome on every mile. Over 100,000 miles, a 0.5-degree misalignment costs $2,000–$4,000 in excess fuel plus accelerated tyre wear.
Inspection action: Check for uneven tyre wear patterns (feathering, shoulder wear). HVI AI photo analysis detects abnormal tread wear patterns that indicate alignment issues before MPG drops.
Aerodynamic Damage
Missing mud flaps, damaged fairings, loose side skirts, and broken trailer seals disrupt airflow — adding drag that compounds at highway speeds. A missing side skirt alone can cost 1–2% fuel economy at 65 MPH.
Inspection action: Full exterior walk-around checking all aero components. HVI's guided sequence includes aerodynamic component verification with photo evidence at every pre-trip.
Engine & Coolant System
Low coolant causes engines to run hotter and less efficiently. Fluid leaks reduce lubrication. Dirty fuel filters restrict flow. An engine running 10–15 degrees above optimal burns 5–10% more fuel — and inspection catches the visible symptoms before sensors react.
Inspection action: Fluid level check, leak detection under vehicle, coolant colour verification. HVI photo capture at fluid checkpoints creates visual comparison across inspections — showing progressive leaks over time.
HVI's guided inspection covers every fuel-critical component with photo-required checkpoints and AI analysis — catching the defects that cost your fleet 3–8% in wasted fuel.
Start free or
schedule a demo to see fuel-impact tracking.
The Fuel Savings Math
Small inspection improvements create large fuel savings at fleet scale. Here is what the numbers look like.
Average Class 8 fuel consumption
20,000 gallons/year @ 6 MPG
Fuel cost per truck (@ $4.00/gal)
$80,000/year
3% waste from inspection-detectable defects
$2,400/truck/year wasted
50-truck fleet annual waste
$120,000/year in preventable fuel cost
100-truck fleet annual waste (3–5% range)
$240,000–$400,000/year recoverable
How HVI Connects Inspections to Fuel Performance
HVI does not just find defects — it connects inspection data to the fuel performance outcomes that matter to your bottom line. Sign up free and start correlating inspections with fuel efficiency today.
Fuel-Critical Checkpoint Coverage
Guided templates include every fuel-impacting component: tyres (pressure + tread), brakes (drag check), fluids (levels + leaks), air filter, aerodynamic components. Photo-required at each — making verification genuine, not checkbox.
AI Tyre & Component Analysis
Computer vision analyses inspection photos for tread depth estimation, uneven wear patterns indicating alignment issues, and visible fluid seepage — the defects most correlated with fuel waste that drivers miss 20–30% of the time.
Defect-to-Repair Speed
Every day a fuel-wasting defect goes unrepaired is another day of excess fuel consumption. HVI auto-routes defects to maintenance in real time — compressing defect-to-repair time from 18–30 hours to 2–4 hours.
PM Scheduling for Fuel Efficiency
Air filter replacement, tyre rotation, brake adjustment, and coolant service — all scheduled at optimal intervals through HVI's multi-trigger PM system. Every on-time PM protects fuel economy; every missed PM degrades it.
The Cheapest Fuel You Will Ever Buy Is the Fuel You Do Not Waste
Fuel accounts for 24% of total trucking operating costs — the single largest controllable expense. And 3–8% of that fuel is wasted on defects that a proper daily inspection catches in minutes: under-inflated tyres, dragging brakes, clogged filters, fluid leaks, damaged aero components. These are not complex diagnostics — they are walk-around items that pay for themselves every mile. HVI ensures these items are checked with photo verification every day, detected by AI when drivers miss them, repaired within hours through automated work orders, and tracked over time to show the direct correlation between inspection quality and fuel performance. Start free today — or schedule a demo and see how inspection data connects to your fuel bill.
Stop Wasting Fuel on Inspection-Detectable Defects
Guided walk-arounds. AI tyre analysis. Instant defect routing. PM automation. Fuel-correlated analytics. Trusted by 25,000+ users.
Frequently Asked Questions
Q: How do vehicle inspections improve fuel efficiency?
Daily inspections catch the physical defects that waste fuel: under-inflated tyres (1–2% loss per 10 PSI), clogged air filters (3–5% loss), dragging brakes (2–4% loss), coolant issues (5–10% loss), and aerodynamic damage (1–2% loss). Catching and fixing these defects through proper walk-arounds recovers 3–8% fuel efficiency that would otherwise be wasted invisibly.
Start free with HVI.
Q: What inspection items affect fuel economy most?
In order of impact: engine/coolant system issues (5–10% MPG loss), tyre pressure and condition (3–5%), air filter condition (3–5%), dragging brakes (2–4%), wheel alignment (1–3%), and aerodynamic damage (1–2%). Tyres have the highest ROI for daily checking because pressure changes daily and the fuel impact is immediate and measurable.
Q: How much fuel can proper inspections save per truck?
At $4.00/gallon and 6 MPG, a Class 8 truck consuming 20,000 gallons/year saves $2,400–$6,400 annually by eliminating the 3–8% fuel waste from inspection-detectable defects. For a 50-truck fleet, that is $120,000–$320,000/year in recoverable fuel cost.
Schedule a demo for fleet-specific projections.
Q: Can AI detect fuel-wasting defects during inspections?
Yes. HVI's AI analyses inspection photos for tread depth estimation (under-inflation indicator), uneven wear patterns (alignment issues), and visible fluid seepage (coolant/oil leaks) — all directly correlated with fuel waste. AI catches defects that visual-only checks miss 20–30% of the time, recovering fuel that would otherwise be wasted between PM intervals.