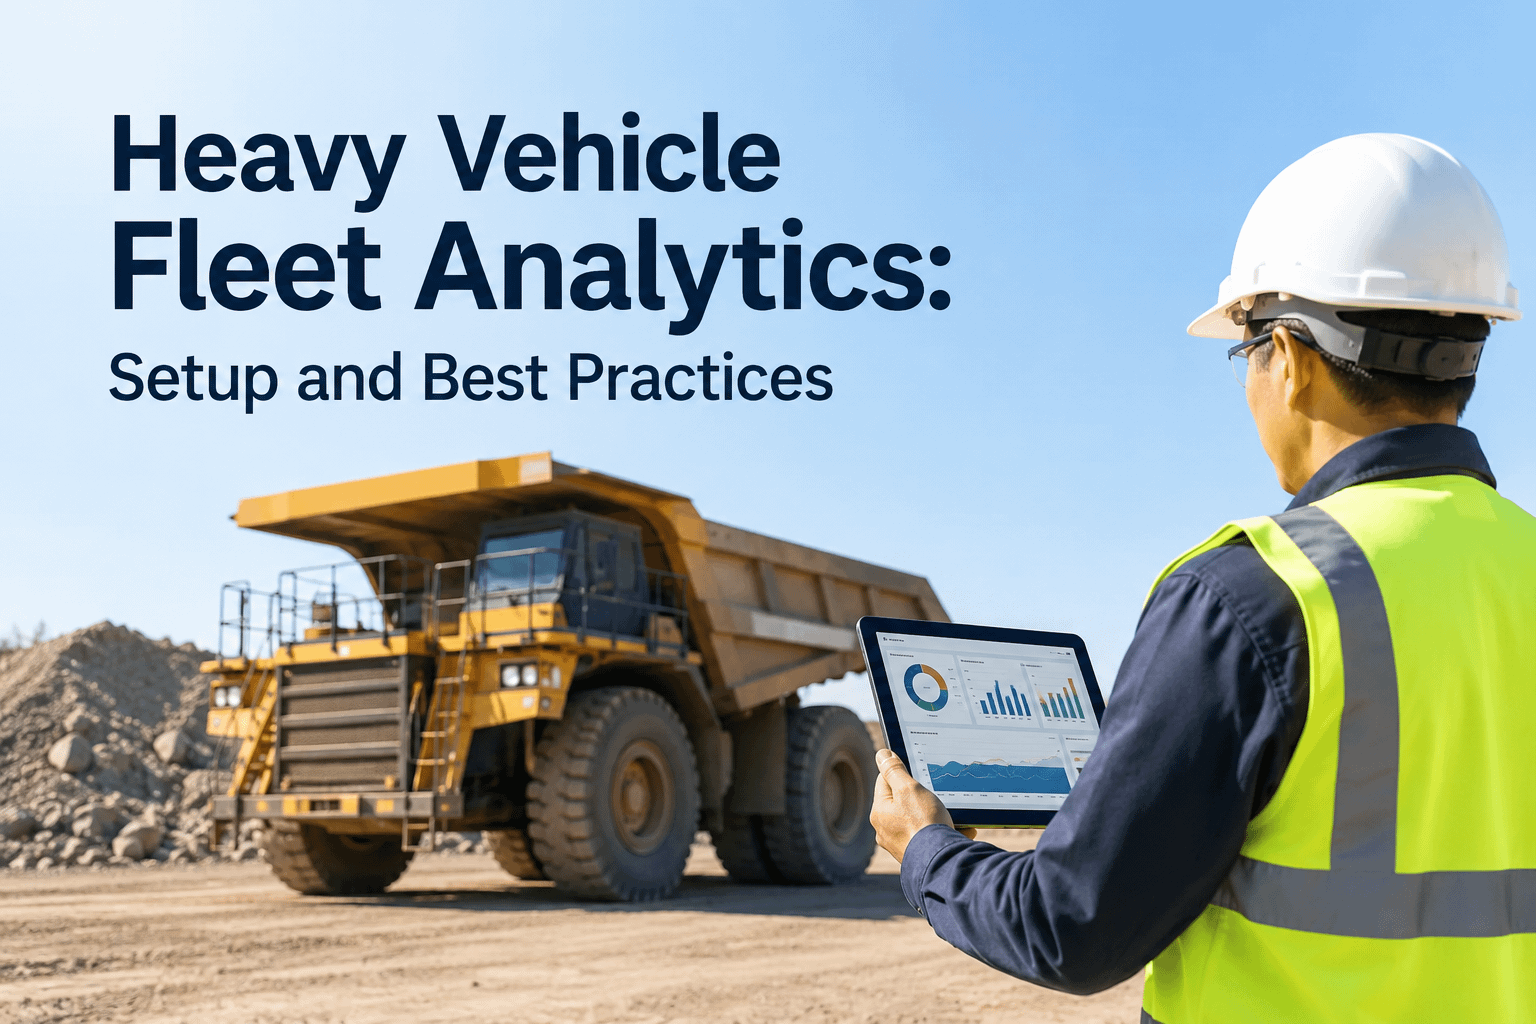
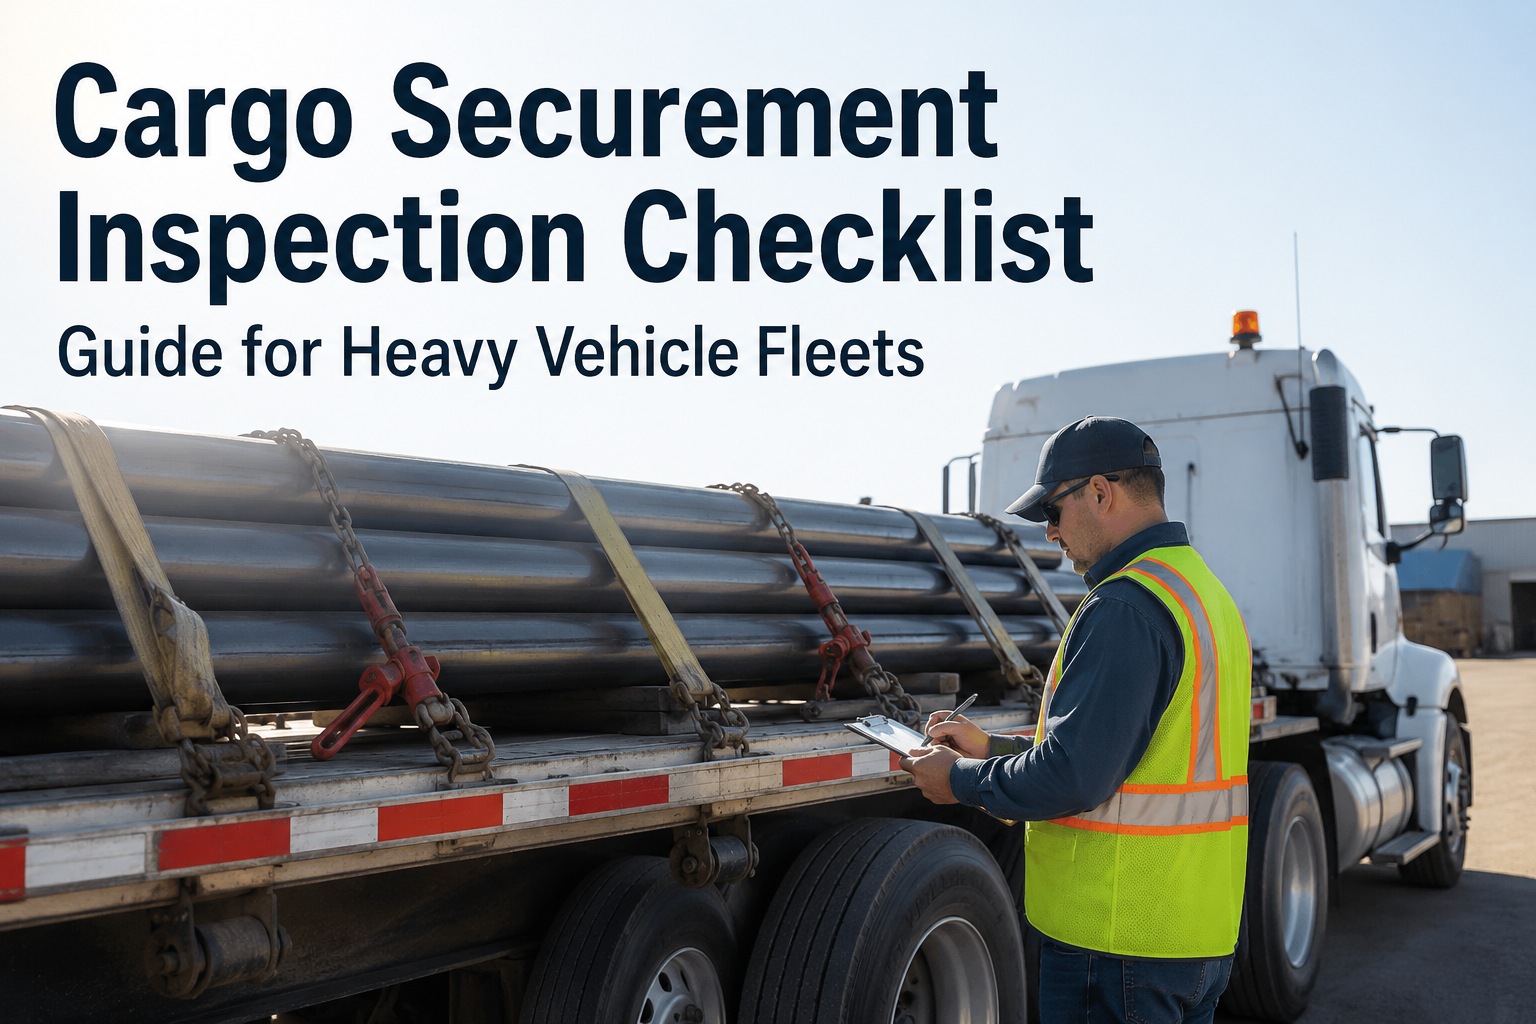
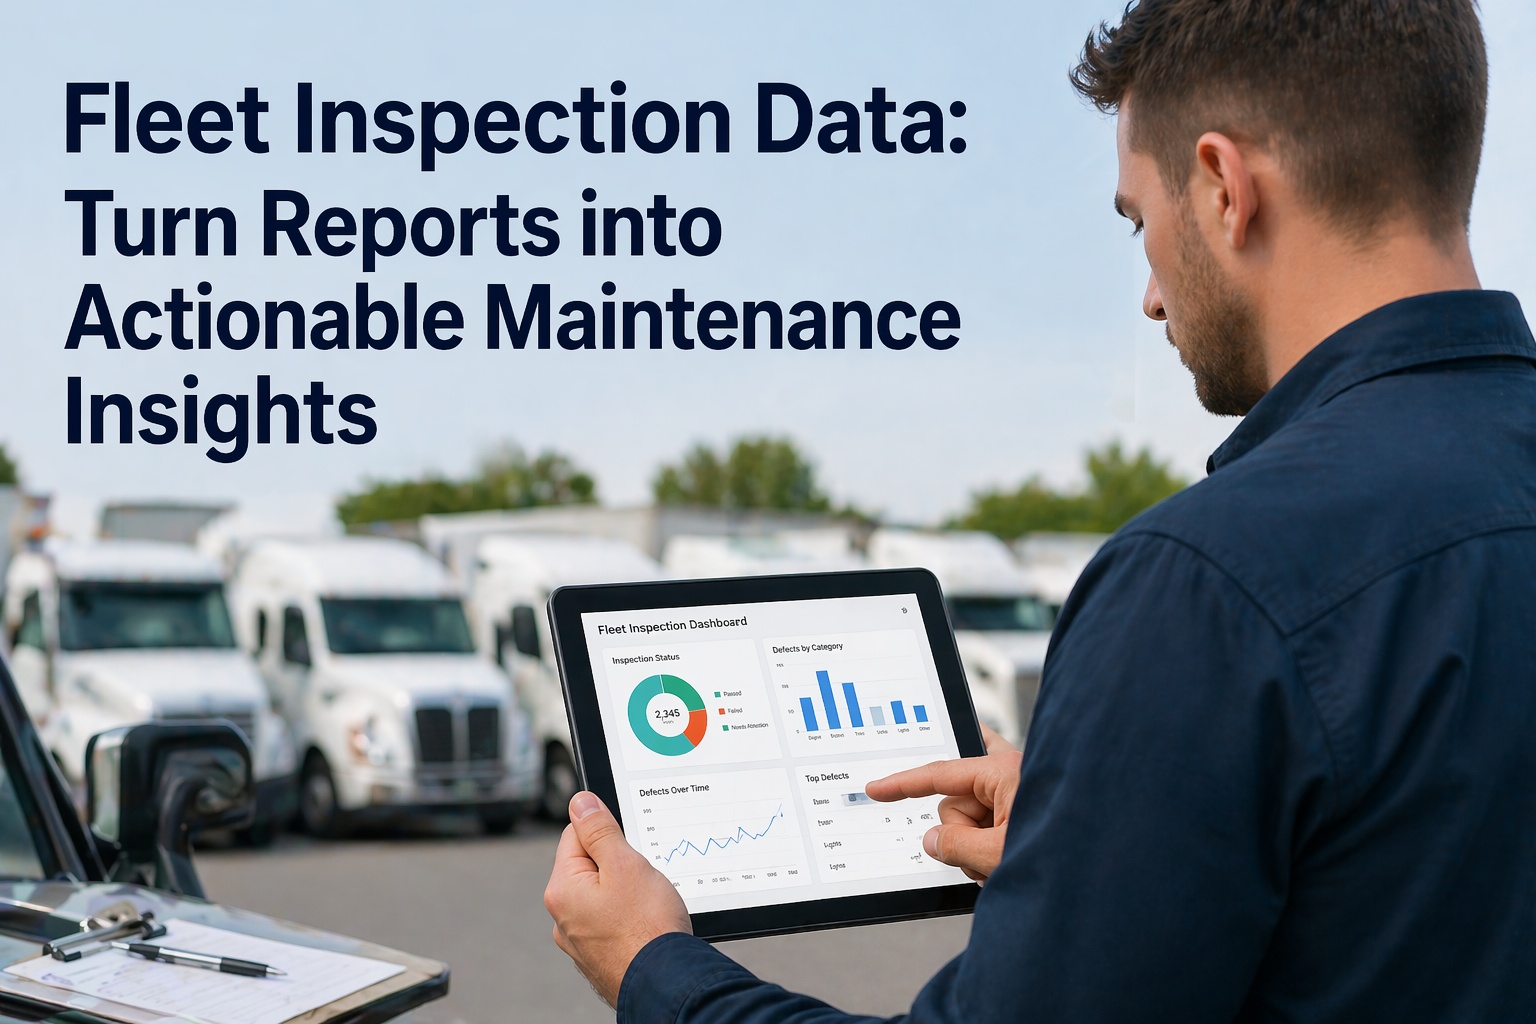
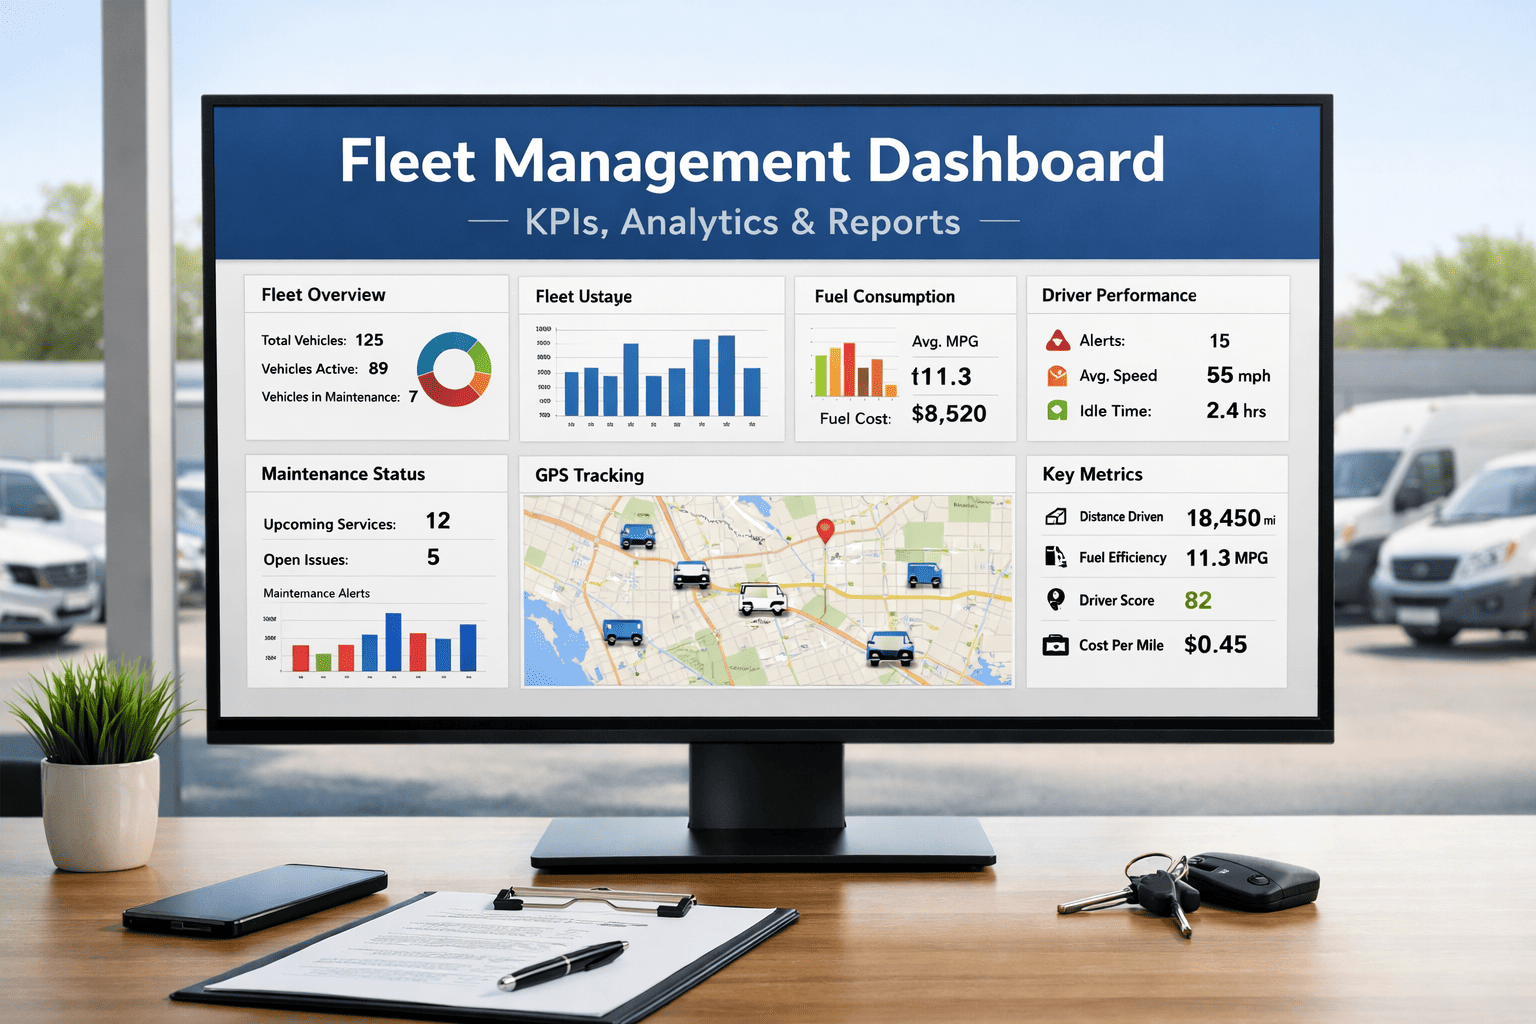
Most fleets are drowning in data and starving for insight. Telematics streams location and engine hours, the maintenance system logs work orders, fuel cards record every gallon, inspections pile up — and almost none of it is connected into a view a manager can actually act on. The result is a familiar paradox: more data than ever, and decisions still made on gut feel. Fleet analytics fixes that, but only if it's built deliberately. The failure mode is the "everything dashboard" — fifty metrics on one screen that nobody reads — or vanity numbers that look impressive and change no decision. Good fleet analytics does the opposite: it answers four specific questions a manager actually has, in four focused dashboards, each tied to an action. Is the fleet available to work? What is it costing me? Are we compliant? And how are operators performing? Heavy vehicle fleet analytics done right turns the data exhaust your fleet already produces into those four answers — and the fleets that build it well report materially lower downtime and cost because they finally act on patterns instead of reacting to crises. This page covers the four dashboards to build, the metrics that belong on each, and the rollout sequence that gets analytics adopted instead of ignored.
More Data Than Ever. Still Deciding on Gut Feel.
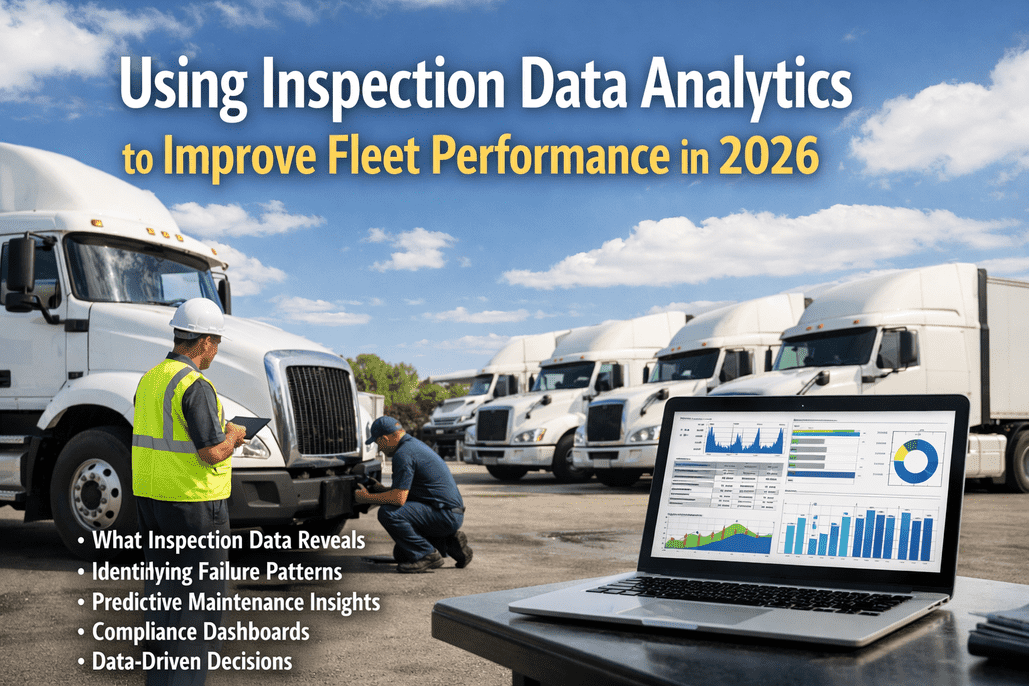
HVI pulls inspections, work orders, fuel, and usage into four focused dashboards — uptime, cost, compliance, and operator performance — so every screen answers a real question and drives a real decision, instead of burying the signal under fifty vanity metrics.
The Four Dashboards Every Fleet Needs
Don't build one dashboard with everything — build four that each answer a distinct question a manager actually asks. These are the four, what they measure, and the decision each one drives.
"Is my fleet available to work?"
Equipment availability %
Unplanned downtime hours
MTBF & MTTR
Open work orders & backlog
Drives: which assets to service, repair-vs-replace
"What is my fleet costing me?"
Cost per mile / per hour
Maintenance cost per asset
Reactive vs. planned spend
Total cost of ownership
Drives: budget, lifecycle, vendor decisions
"Are we audit-ready?"
PM compliance %
Inspection completion rate
Open defects & overdue items
DVIR / DOT record status
Drives: audit prep, risk reduction, CSA protection
"How are operators performing?"
Inspection quality & completion
Idle & fuel efficiency by driver
Defect-catch rate
Safety events & coaching flags
Drives: coaching, recognition, training focus
Vanity Metrics vs. Decision Metrics
The fastest way to kill an analytics rollout is to fill it with numbers that look good and change nothing. The test for every metric is simple: does it drive a decision? Here's the difference.
VANITY METRICS
Total miles driven this month
Number of inspections completed
Total fuel spend (no context)
Lifetime work orders closed
DECISION METRICS
Cost per mile per asset vs. fleet average
Defect-catch rate by operator
Fuel cost per ton against baseline
Reactive-vs-planned ratio trending up
The Analytics Rollout: 5 Steps That Get Adopted
Analytics projects fail on adoption, not technology. The fleets that succeed follow a sequence: start small, prove value, then expand. Here's the rollout that sticks.
1
Pick One Question
Start with the single decision that hurts most — usually "which assets cost us the most?" One dashboard, one question, fast win.
2
Connect the Source Data
Pull from systems you already run — inspections, work orders, fuel, usage. Analytics is only as good as the data feeding it, so clean inputs first.
3
Set Benchmarks
A number means nothing without a target. Compare each asset to its own history and to peers, so outliers surface instead of hiding in averages.
4
Tie Every Metric to an Owner
A dashboard nobody owns gets ignored. Each metric needs a person responsible for acting on it — that's what turns a chart into a change.
5
Expand on Proven Value
Once the first dashboard saves money, add the next. Build the four domains one at a time on momentum, not all at once on hope.
What Good Analytics Changes
The payoff isn't prettier charts — it's the shift from reacting to crises to acting on patterns. These are the outcomes fleets report once analytics is driving decisions.
Reactive → Predictive
The core shift: trends flag a failing asset or rising cost before it becomes a breakdown or a budget overrun.
Outliers Surface
Per-asset benchmarking exposes the truck costing 5× the fleet average — invisible in a lump-sum total.
Decisions Get Faster
Repair-vs-replace, route-vs-coach, service-now-vs-later — answered on data in minutes, not debated for weeks.
Accountability Sticks
When every metric has an owner and a benchmark, performance becomes visible and improvable across the team.
Build Four Dashboards That Actually Get Used
Uptime, cost, compliance, and operator-performance dashboards built from the inspection, work-order, fuel, and usage data your fleet already produces — benchmarked, owned, and tied to decisions. Skip the fifty-metric screen nobody reads. Trusted by 25,000+ users worldwide.
Frequently Asked Questions
What dashboards should a heavy vehicle fleet build first?
Build four focused dashboards rather than one crowded screen, each answering a distinct manager question: Uptime (is the fleet available to work — availability %, downtime, MTBF/MTTR, work-order backlog), Cost (what's it costing — cost per mile/hour, maintenance cost per asset, reactive-vs-planned spend, TCO), Compliance (are we audit-ready — PM compliance, inspection completion, open defects, DVIR status), and Operator Performance (how are drivers doing — inspection quality, idle and fuel efficiency, defect-catch rate, safety events). Start with whichever question hurts most, usually cost.
Sign up for a free HVI trial to build them.
What's the difference between a vanity metric and a decision metric?
A vanity metric looks impressive but changes no decision — total miles driven, number of inspections completed, lifetime work orders closed. A decision metric points to a specific action: cost per mile per asset against the fleet average tells you which truck to investigate; defect-catch rate by operator tells you who to coach; a reactive-vs-planned ratio trending up tells you the maintenance program is slipping. The test for every metric on a dashboard is simple — does it drive a decision? If not, it's clutter that buries the signal.
Schedule a demo to see decision-focused dashboards.
Why do fleet analytics rollouts fail?
Almost always on adoption, not technology. The common failures are the "everything dashboard" with fifty metrics nobody reads, vanity numbers that change no decision, dirty source data that undermines trust, and metrics with no owner so nothing gets acted on. The fix is a disciplined rollout: start with one high-value question, connect clean source data, set benchmarks so outliers surface, give every metric an owner responsible for acting on it, and expand only after the first dashboard proves value. Momentum beats a big-bang launch.
Sign up for a free HVI trial to roll out the right way.
Where does the data for fleet analytics come from?
From systems your fleet already runs — you rarely need new data sources, just connected ones. Inspections supply defect and compliance data, the maintenance system supplies work orders and repair costs, fuel cards or on-site pumps supply consumption, and telematics or engine-hour meters supply usage. The value of analytics comes from joining these into one view so, for example, a fuel-economy drop links to a maintenance trend and an operator. HVI builds the four dashboards directly from this existing data exhaust.
Schedule a demo to see your data connected.
How does analytics actually reduce cost and downtime?
By shifting the fleet from reacting to crises to acting on patterns. Per-asset benchmarking surfaces the truck costing several times the fleet average that a lump-sum report hides, so you can fix or replace it. Trend lines flag a rising reactive-vs-planned ratio or a creeping cost-per-mile before it becomes a budget overrun. Compliance dashboards catch overdue PM before it becomes a breakdown or a violation. The mechanism is always the same — making the outlier and the trend visible early enough to act, instead of discovering them in a year-end total.
Sign up for a free HVI trial to act on the patterns.