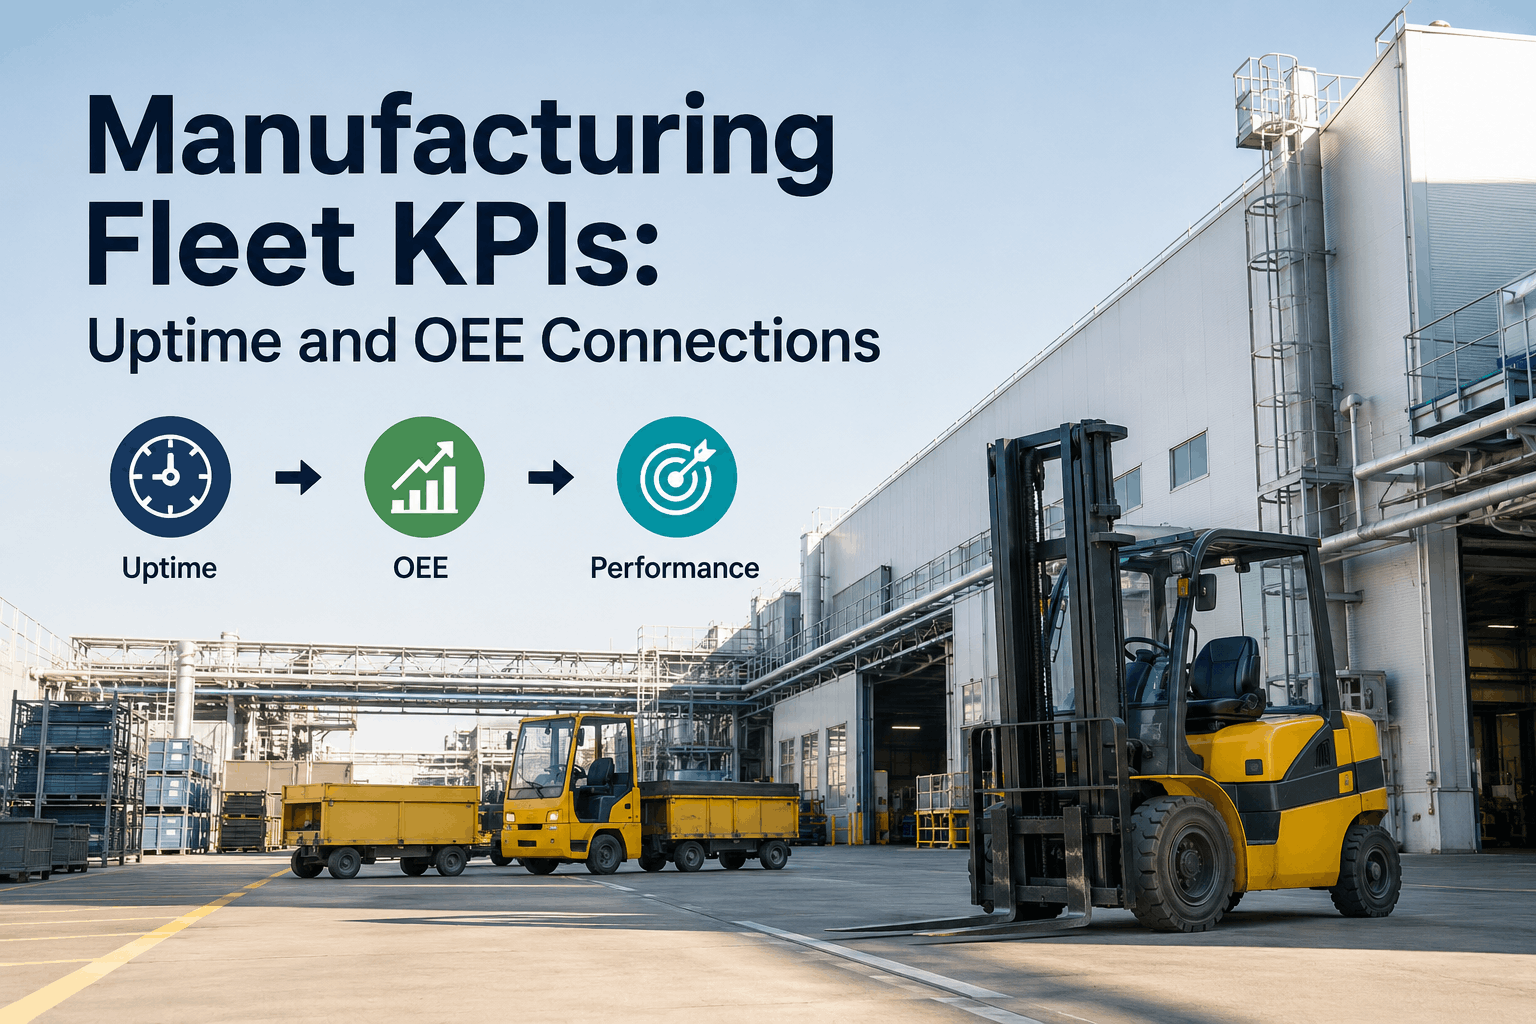
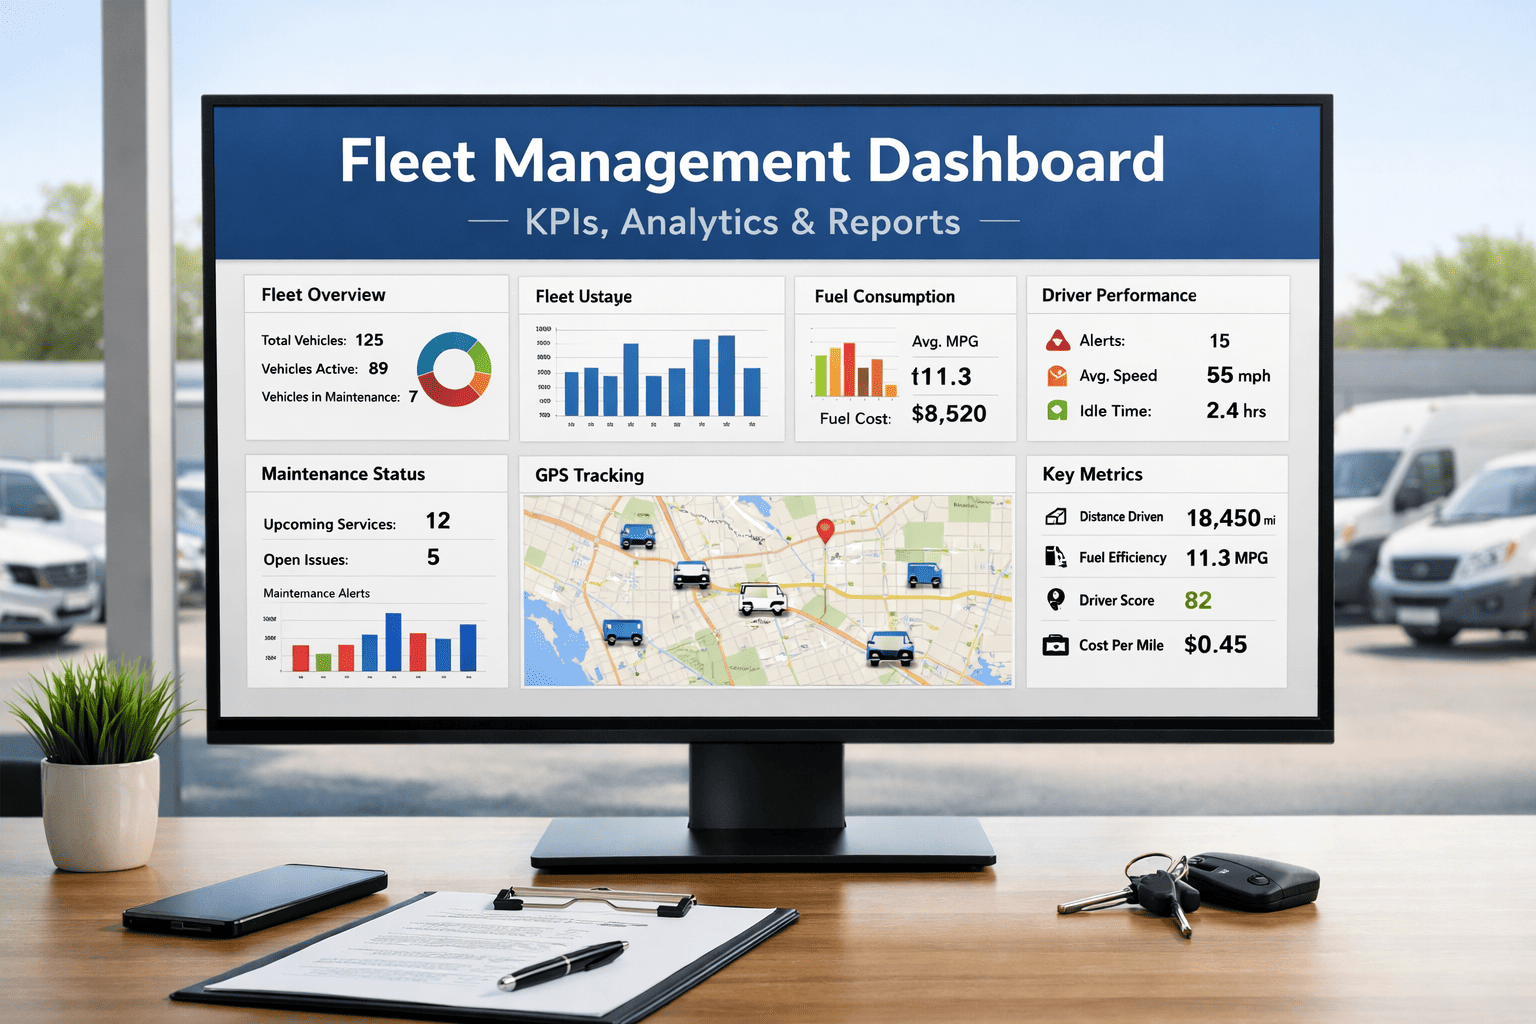
Most plants treat their mobile equipment fleet and their OEE numbers as two separate worlds. The fleet — the forklifts, reach trucks, tuggers, and yard equipment that move material — gets managed by maintenance, while OEE belongs to production. But that division hides a direct, measurable link: when a forklift goes down, the line it feeds eventually starves, and the plant's Overall Equipment Effectiveness drops. OEE is the master manufacturing metric, the product of three factors — Availability × Performance × Quality — and mobile equipment uptime touches all three. A material-handling shortfall stalls the line (Availability), slows its rhythm (Performance), and can even introduce defects through mishandling or delay (Quality). Yet most fleet KPIs — utilization, work orders closed, cost per hour — are tracked in a maintenance silo that never connects to the OEE dashboard the plant manager actually watches. Closing that gap is how fleet management earns a seat at the production table: by showing, in OEE terms, exactly what a reliable fleet is worth. Tracking fleet KPIs that map to OEE turns mobile-equipment uptime from a maintenance cost into a production lever. This page breaks down the OEE framework, how fleet KPIs feed each factor, and the metrics to track.
When a Forklift Goes Down, OEE Goes Down. Most Plants Never Connect the Two.
HVI tracks the mobile-equipment KPIs that actually drive plant OEE — availability, MTBF/MTTR, utilization, and defect capture — and links fleet uptime to the Availability, Performance, and Quality factors so maintenance and production finally read from the same scorecard.
OEE in One Equation
Overall Equipment Effectiveness is the single most important production metric, and it's the product of three factors. A perfect score is 100%; world-class is around 85%. Each factor is a place mobile equipment can quietly drag the number down.
Availability
Is the line running when it's scheduled to? Lost to downtime — including waiting on material a downed forklift can't deliver.
×
Performance
Is it running at full speed? Lost to slow cycles and minor stops — like a line throttled by slow material replenishment.
×
Quality
Is output good the first time? Lost to defects and rework — including damage from mishandling or delayed material.
=
OEE
The multiplication is what makes OEE unforgiving: 90% Availability × 90% Performance × 90% Quality is only 73% OEE, not 90%. A fleet problem that nicks two factors at once compounds — which is exactly why mobile-equipment reliability matters more to OEE than most plants realize.
How Fleet Uptime Feeds Each OEE Factor
Mobile equipment isn't outside the OEE equation — it's woven through all three factors. Here's the direct line from a fleet problem to each part of the score.
→ AVAILABILITY
Downed Equipment Starves the Line
When the forklift or tugger that feeds a line goes down and no spare covers it, material stops arriving and the line eventually halts. That's pure Availability loss — production scheduled but not running, traced directly to fleet downtime.
Fleet KPIs: availability %, MTBF, MTTR, unplanned downtime
→ PERFORMANCE
Slow Replenishment Throttles the Pace
A fleet that's running but under-resourced — too few trucks, poor routing, low utilization — replenishes material slower than the line consumes it, forcing reduced speed and minor stops. The line runs, but below rate. That's Performance loss.
Fleet KPIs: utilization %, cycle time, throughput per truck
→ QUALITY
Mishandling & Delay Cause Defects
Damaged loads from poorly maintained forks or rushed handling, and material that sits too long waiting on transport, both introduce defects and rework. A reliable, well-run fleet protects Quality; a struggling one quietly erodes it.
Fleet KPIs: defect-catch rate, damage incidents, on-time delivery
The Fleet KPIs That Map to OEE
Not every fleet metric connects to production. These are the ones that do — each tied to an OEE factor, each driving a decision a plant manager cares about.
Equipment Availability %
Share of scheduled time the fleet is ready to work. The most direct line to OEE Availability — a fleet at 95% protects the lines it serves.
MTBF & MTTR
Mean time between failures and mean time to repair. Rising MTBF and falling MTTR mean fewer, shorter interruptions to material flow.
Utilization %
How hard each truck actually works. Too low wastes capital; too high signals you're under-resourced and throttling line Performance.
Defect-Catch Rate
How many equipment issues operators flag before failure. High capture keeps trucks healthy and protects both Availability and Quality.
PM Compliance %
Share of scheduled maintenance done on time. The leading indicator of future availability — high compliance today is uptime tomorrow.
Cost Per Hour
Total operating cost per engine hour, per asset. The financial frame that turns uptime gains into a budget and capital argument.
The Compounding Math, Made Visible
Because OEE multiplies, a fleet problem that touches two factors hurts far more than it looks. This is why connecting the metrics changes the conversation about what fleet reliability is worth.
FLEET STRUGGLING
90% Avail × 88% Perf × 98% Qual
77.6% OEE
Downtime dents Availability and slow replenishment dents Performance — two small hits compound into a big gap.
FLEET RELIABLE
97% Avail × 95% Perf × 99% Qual
91.2% OEE
A reliable fleet lifts two factors at once — and the multiplication turns that into a 13-point OEE swing.
Illustrative figures — but the principle holds: because the three factors multiply, lifting fleet-driven Availability and Performance even a few points each produces an outsized OEE gain. That's the number that justifies investment in fleet reliability.
Connecting Fleet to OEE in Three Steps
Turning the link into a working dashboard is straightforward: measure the fleet, map it to the factors, and put it where production can see it.
1
Measure the Fleet
Track availability, MTBF/MTTR, utilization, PM compliance, and defect capture per asset — the OEE-relevant KPIs, automatically.
2
Map to the Factors
Tie fleet downtime to Availability, replenishment speed to Performance, and handling quality to Quality — so each KPI has an OEE home.
3
Share One Scorecard
Put fleet KPIs on the same dashboard as OEE so maintenance and production act on one connected view, not two silos.
Make Your Fleet a Visible Driver of OEE
Per-asset availability, MTBF/MTTR, utilization, PM compliance, and defect capture — the mobile-equipment KPIs that feed plant OEE, tracked in one platform and mapped to Availability, Performance, and Quality. Turn fleet reliability from a maintenance cost into a production lever leadership can see. Trusted by 25,000+ users worldwide.
Frequently Asked Questions
How does mobile equipment uptime affect plant OEE?
Directly, across all three OEE factors. OEE is Availability × Performance × Quality, and a fleet problem touches each: a downed forklift that can't deliver material starves the line (Availability loss), an under-resourced fleet that replenishes slower than the line consumes forces reduced speed and minor stops (Performance loss), and mishandled or delayed material introduces defects and rework (Quality loss). Because the three factors multiply, even small fleet-driven hits to two of them compound into an outsized OEE drop — which is why mobile-equipment reliability matters more to OEE than most plants assume.
Sign up for a free HVI trial to connect them.
What is OEE and what's a good score?
Overall Equipment Effectiveness is the master manufacturing productivity metric, calculated as Availability × Performance × Quality. Availability measures whether the line runs when scheduled, Performance whether it runs at full speed, and Quality whether output is good the first time. A perfect score is 100%, world-class is around 85%, and typical manufacturers run lower. The multiplication is key: 90% on each factor yields only 73% OEE, not 90%, so problems compound. Because mobile equipment can drag down all three factors, fleet KPIs belong in the OEE conversation.
Schedule a demo to see the connection.
Which fleet KPIs should I track for OEE?
Focus on the ones that map to production: equipment availability % (the most direct line to OEE Availability), MTBF and MTTR (fewer and shorter interruptions to material flow), utilization % (too low wastes capital, too high signals you're throttling line Performance), defect-catch rate (issues flagged before failure protect both Availability and Quality), PM compliance % (the leading indicator of future uptime), and cost per hour (the financial frame for the whole argument). Each connects a fleet decision to an OEE outcome a plant manager already cares about.
Sign up for a free HVI trial to track them.
Why does the OEE multiplication matter for fleet decisions?
Because it makes fleet reliability worth more than it looks. Since OEE multiplies its three factors, a struggling fleet that dents Availability and Performance a few points each compounds into a large OEE loss — for example, 90% × 88% × 98% is only 77.6%, while a reliable fleet at 97% × 95% × 99% reaches 91.2%, a 13-point swing. That compounding is the financial case for investing in fleet uptime: lifting two fleet-driven factors even modestly produces an outsized gain in the plant's master productivity number.
Schedule a demo to model the math.
How do I get maintenance and production looking at the same data?
Put the fleet KPIs on the same dashboard as OEE and translate them into production language. The problem in most plants is a silo: fleet metrics like MTTR and utilization live in maintenance while OEE lives in production, so the link is never made. The fix is to measure the OEE-relevant fleet KPIs per asset, map each to its OEE factor (downtime to Availability, replenishment speed to Performance, handling to Quality), and share one connected scorecard. Then "MTTR improved" becomes "material-handling downtime cost us four OEE points" — a number production acts on.
Sign up for a free HVI trial to share one view.