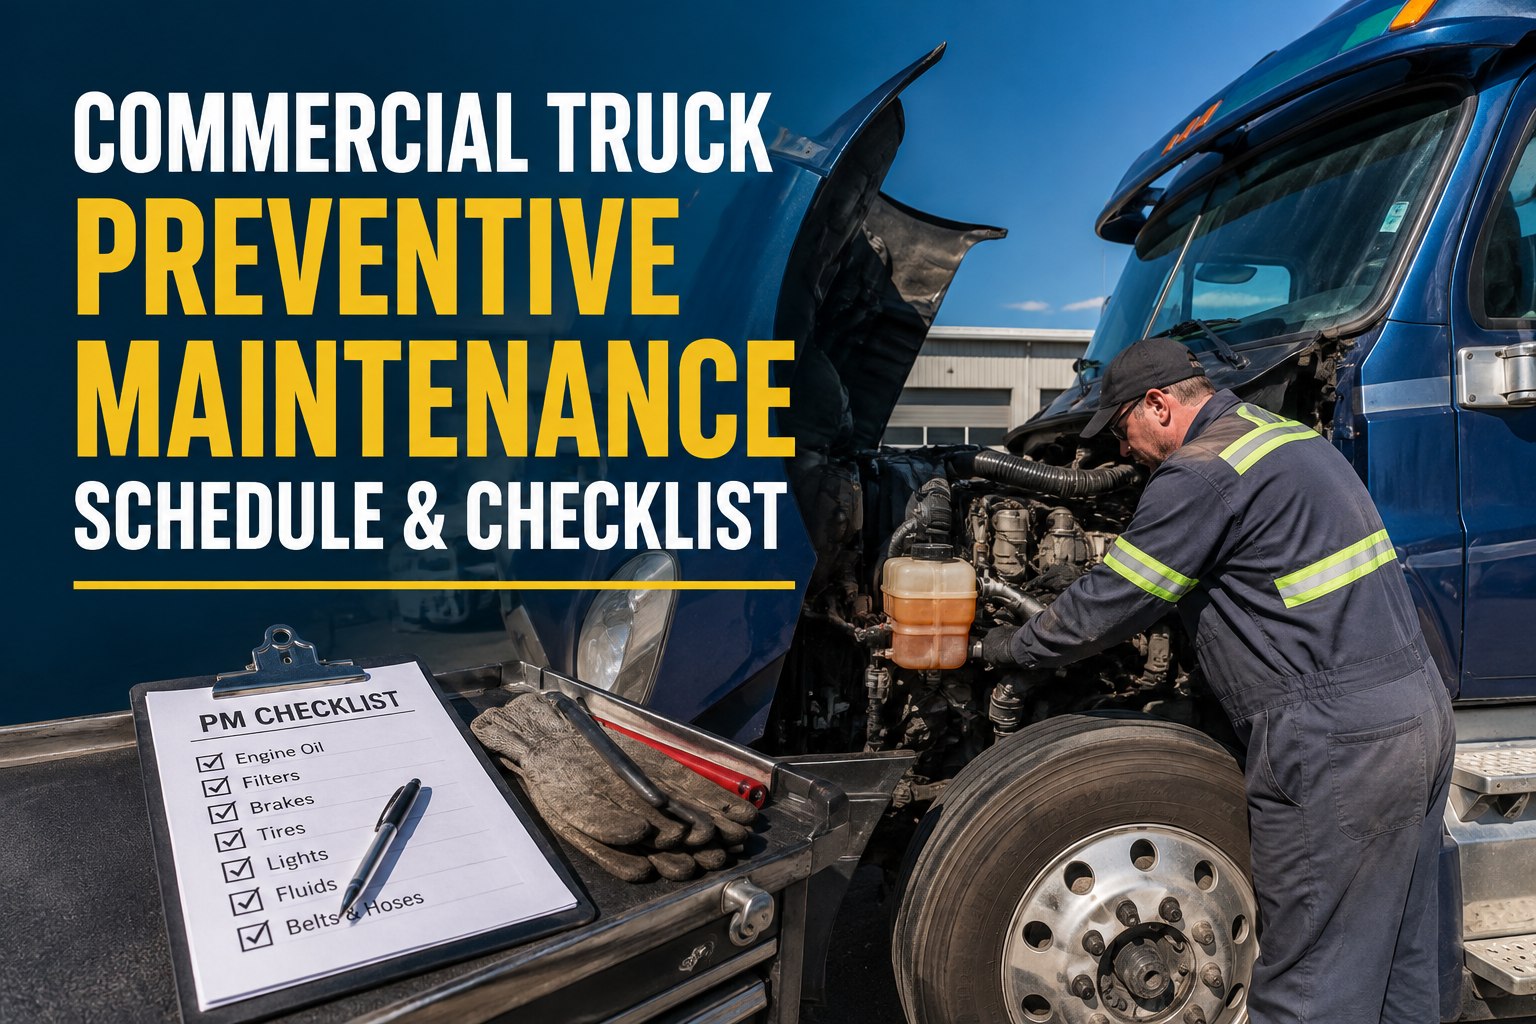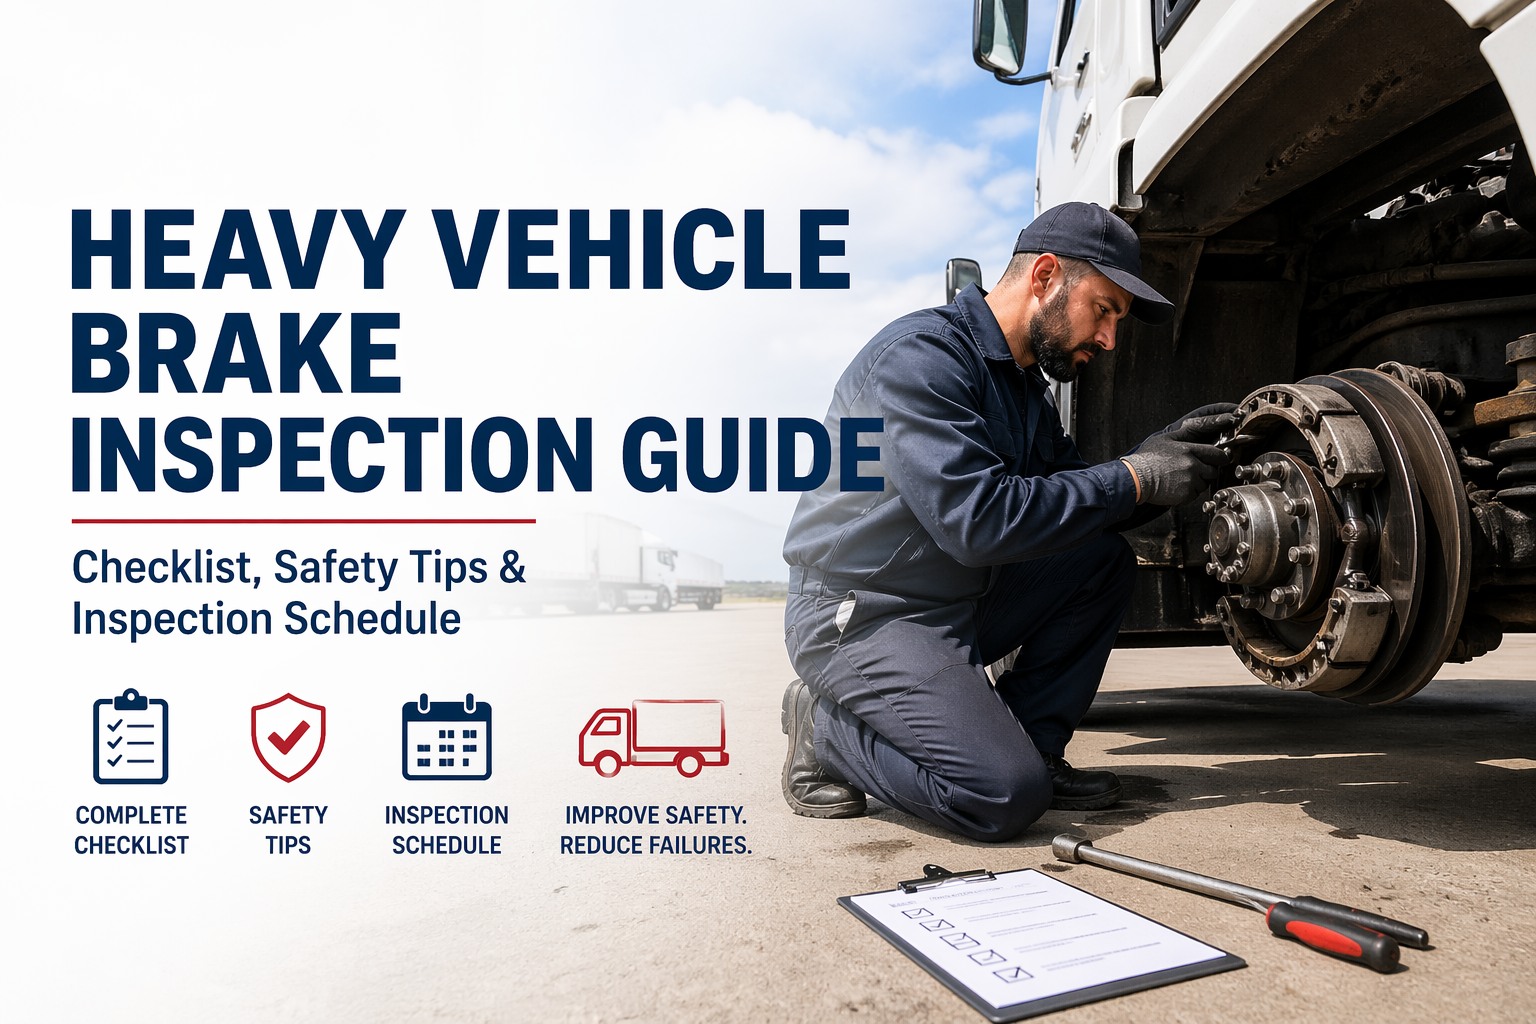
CVSA's 2025 Roadcheck logged 3,304 out-of-service brake system violations and another 2,257 vehicles cited under the 20% defective brakes rule — combined, 41.1% of every vehicle placed out of service. And this isn't a one-off: the brake share has held above 40% every recent Roadcheck, regardless of the year's named focus area. This 2026 guide breaks down what's actually failing on the roadside, the four root causes, and the preventive maintenance stack that keeps the OOS sticker off your trucks. Book a demo to see brake defect tracking automated in HVI.
Why 41% of Truck OOS Violations Still Come Down to Brakes
Two categories. Same root cause. And a pattern that hasn't broken in years.
Brake system OOS violations are roadside inspection findings serious enough to place a truck out of service on the spot — and they've topped CVSA's vehicle violation list for years running. The 41.1% share in 2025 breaks into two categories: 3,304 individual brake-system defects (worn linings, air leaks, out-of-adjustment slack adjusters, pushrod travel over spec) and 2,257 "20% defective brakes" violations, which auto-trigger when a fifth of a vehicle's brakes are individually out of service. Both categories point to the same underlying gap: inconsistent inspection routines and reactive rather than scheduled preventive maintenance.
The Two-Number Story: 3,304 + 2,257 ⇒ 41.1%
Most fleet operators know brakes lead the OOS list, but the split between the two brake categories is where the diagnostic lives. The brake system violation is component-specific: this drum is cracked, this air line is leaking, this pushrod exceeds allowable stroke. The 20% defective brakes violation is arithmetic: an inspector counts up the individual out-of-service brakes across the vehicle, and once that count crosses one-fifth of the total, the whole vehicle fails — no matter how bad any single brake is. Book a demo to see how HVI tracks per-axle defect trends across your fleet.
- What triggers it: A specific defect on any one brake component
- Common calls: Slack adjuster out of adjustment, air leak greater than 3 psi/min, pushrod travel over spec, brake lining below allowable, cracked drum
- Diagnostic: Component-level — one part failed the inspection
- Fix pattern: Repair or replace the specific defective component
- What triggers it: 1 in 5 of the vehicle's brakes has an OOS condition
- Common calls: Multiple out-of-adjustment slack adjusters across axles, cumulative lining wear on drive tandems
- Diagnostic: Fleet-level — the maintenance rhythm failed, not one part
- Fix pattern: Full brake job or system audit — individual repair doesn't clear the OOS
The Four Root Causes Behind 41.1%
Every brake OOS finding traces to one of four patterns. Understanding which is failing in your operation is the difference between a temporary fix and a structural one.
DVIRs get signed without the driver checking pushrod travel, slack adjuster angle, or listening for an air leak. When the walk-around is a paperwork exercise, defects go on the road that would have been caught in a real 15-minute inspection.
Brake linings, slack adjusters, and air system components all wear on predictable curves. Fleets running "fix when broken" instead of scheduled PM inevitably hit inspections with components in the OOS zone that a calendar-based PM would have caught 30-60 days earlier.
A single slack adjuster out of adjustment is a repair. The same slack adjuster failing three times in six months is a symptom — usually of a chamber issue or misalignment. Without defect trending, the pattern stays invisible until a Level I inspection surfaces it as a 20% defective brake finding.
Paper DVIRs get lost, misfiled, or falsified. Inspectors reviewing a fleet's records during a compliance review look for the audit trail. Missing signed reports or reports without defect notes signal a program that isn't running — and that's when brake trends get missed.
What Inspectors Actually Find at the Roadside
The 41.1% doesn't come from exotic failures. The top brake defects at Level I inspections are the same year after year, and every one is catchable at the yard.
The 3-Layer PM Strategy That Prevents the OOS Sticker
Preventive maintenance isn't one interval — it's three, stacked. Fleets running the top-quartile brake OOS rate under 20% run all three layers consistently. Skip any one and the sticker eventually arrives.
Driver-executed. Catches air leaks, visible damage, ABS lights, glad-hand issues. Digital DVIR with photo capture converts a paperwork task into a real inspection — and produces an audit trail simultaneously.
Yard-executed by a technician. Measures pushrod travel with brakes applied, verifies slack adjuster angle, checks lining thickness with a wear gauge. This is the layer that prevents the 20% defective brake finding — because it catches the accumulation.
Full teardown. Drum/disc inspection, chamber operation test, air line pressure test, ABS diagnostics. Aligns with the FMCSA annual brake inspection requirement and catches the structural issues that daily and 30-day checks can't see — drum cracks, chamber diaphragm degradation, foundation brake wear patterns.
The Cost Math: What a Brake OOS Actually Costs
A single brake OOS violation isn't just the roadside citation — it stacks four separate cost pools that compound over the following year.
How HVI Closes the Gap Between PM Plan and OOS Reality
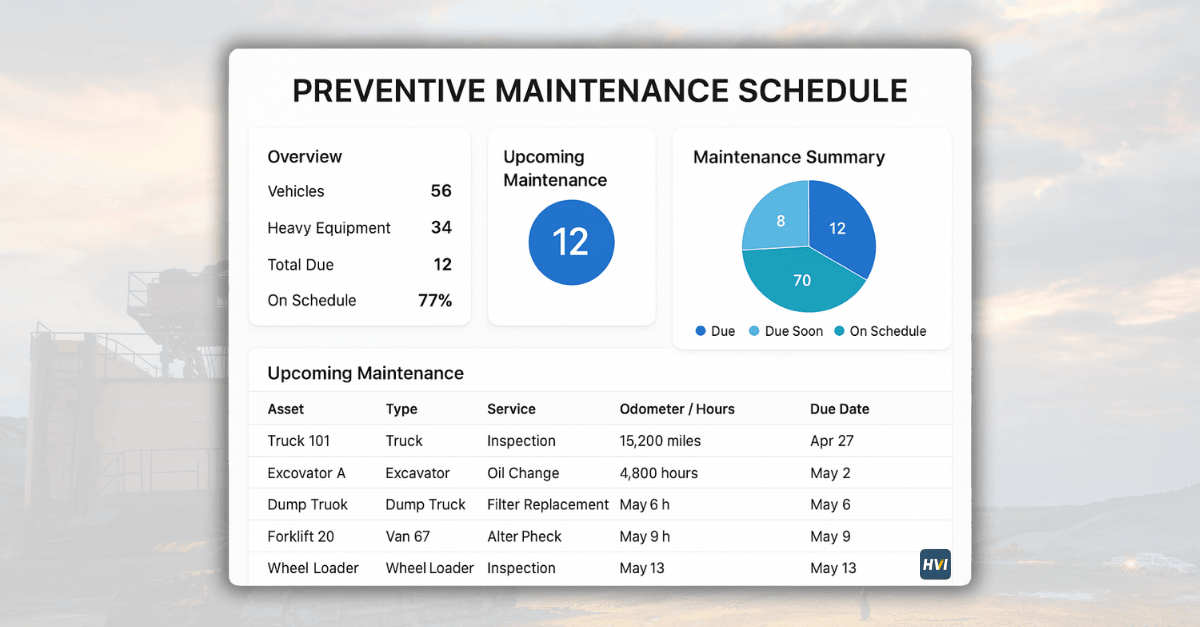
The PM plan on paper is the easy part. Running it consistently across every truck, every driver, every yard — that's what breaks. HVI closes that gap in four ways.
Frequently Asked Questions
What percentage of vehicle OOS violations come from brakes?
In CVSA's 2025 International Roadcheck, brake-related violations combined for 41.1% of all vehicle out-of-service findings — 3,304 individual brake system violations (24.4% of vehicle OOS) plus 2,257 "20% defective brakes" violations (16.7%). This share has held above 40% every recent Roadcheck cycle, including years when the named focus area was ABS (2023), the general vehicle inspection (2024), and tires (2025). The pattern is structural, not cyclical — brake compliance is the single largest lever available to reduce OOS rates at nearly every commercial fleet.
What is the "20% defective brakes" rule?
The 20% defective brakes rule places a commercial motor vehicle out of service when 20% or more of its individual brakes have an out-of-service condition — regardless of whether any single brake is by itself failing critically. The rule is arithmetic: an inspector counts up the OOS brakes across all axles, and if the count crosses one-fifth of the vehicle's total brakes, the whole unit fails. It's the reason a well-maintained truck can still hit an OOS finding if the maintenance rhythm across multiple axles has drifted — and it's why the 20% category consistently generates 15-17% of vehicle OOS on top of the individual brake system category.
What are the most common brake defects inspectors find?
The top five brake defects at Level I inspections year over year: (1) out-of-adjustment slack adjusters with pushrod travel exceeding spec, (2) air system leaks greater than 3 psi per minute, (3) brake linings below allowable thickness (typically 1/4 inch drum, 1/8 inch disc), (4) cracked or oil-contaminated brake drums, and (5) missing or inoperative ABS components including illuminated warning lights and disconnected wheel speed sensors. Every one of these is catchable during a proper pre-trip DVIR or the 30-day slack adjuster check — the roadside finding is almost always evidence that the yard-based inspection either didn't happen or didn't include the specific check.
How often should commercial vehicle brakes be inspected?
Three intervals, stacked. Daily: driver pre-trip DVIR, per FMCSA §396.11 — catches air leaks, ABS lights, visible damage. 30-day: technician-level slack adjuster and pushrod travel check — catches the accumulation that leads to the 20% defective brake finding. Annual (FMCSA §396.17): wheels-off inspection with drum/disc measurement, chamber test, ABS diagnostics, and air system pressure test. Fleets running only the daily and annual layers routinely hit OOS findings between the two intervals — the 30-day layer is the one most commonly skipped and most costly to skip.
How does a brake OOS violation affect CSA scores under the 2026 overhaul?
Under the 2026 CSA overhaul, out-of-service violations now carry a severity weight of 2 (versus 1 for non-OOS findings), doubling the scoring impact per violation. Violations count toward BASIC percentiles for 12 months (reduced from 24 months in prior methodology), and Vehicle Maintenance BASIC is being split into observed categories that isolate brake-related patterns more visibly. Practically, a single brake OOS finding now moves a fleet's Vehicle Maintenance percentile more than it did before, but the shorter reporting window means clean months following remediation clear the record faster. The net effect: brake OOS violations hurt more per event, but disciplined remediation restores scoring faster than under the prior rules.
Move Brake OOS Off Your Fleet's Scorecard
HVI runs digital DVIRs, automated PM scheduling, brake defect trend tracking per axle, and audit-ready inspection records — the exact system top-quartile fleets use to hold their brake OOS rate under 20%. Live in under two weeks. No hardware. No IT project.
No credit card · No hardware · Brake defect dashboard ready on day one