A driver's pre-trip walkaround passed clean — pedal firm, no light, no drag. Ninety minutes later, an inspector measured the brakes and the truck never left the lot. That's the gap 2026's national inspection data keeps exposing and it's the gap this page is built to close.
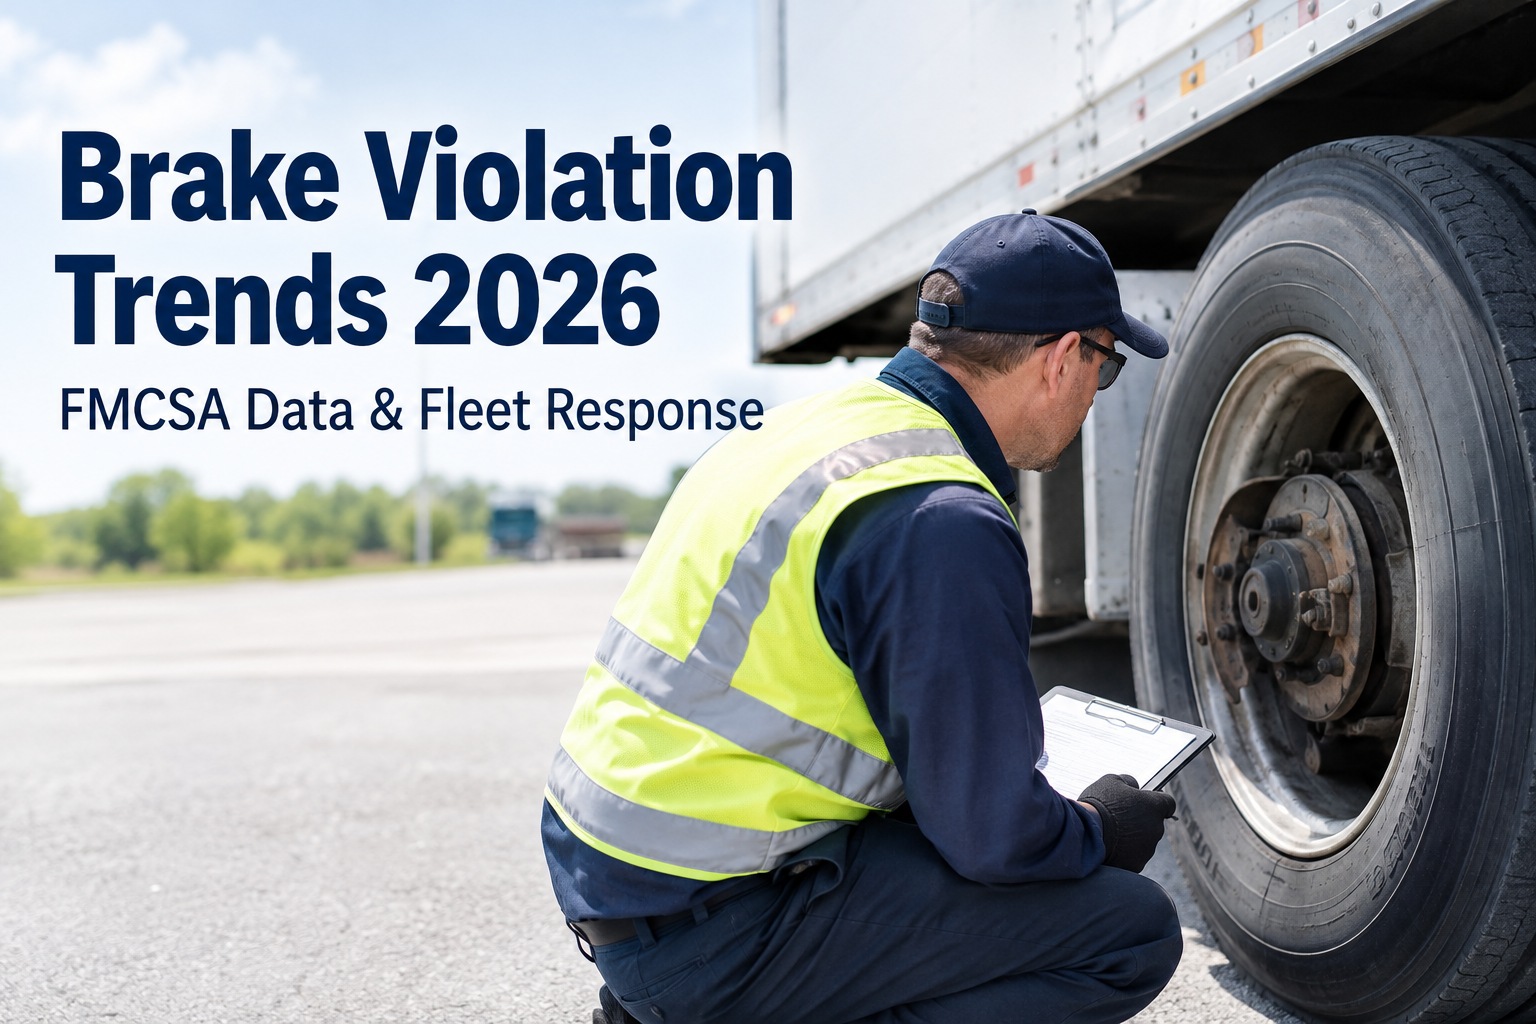
Brake Violation Trend 2026: The Defect a Visual Check Can't See
Brakes weren't even 2026's named enforcement focus — and they still drove more out-of-service orders than tires and cargo securement combined. Here's exactly where that number comes from, and how fleets close it before an inspector does.
Where Brake Violation Trend 2026 Data Is Actually Coming From
Brakes weren't even the named focus area of the 2026 Roadcheck — cargo securement and ELD tampering were. Brakes topped the list anyway, the way they have every year this event has run. Here's how the four biggest vehicle out-of-service categories stacked up.
Share of total vehicle out-of-service violations by category, 2026 International Roadcheck. Source: CVSA.
Book a demo to see this same breakdown run against your own fleet's inspection and defect history, not just national averages.
Why Visual-Only Checks Keep Missing These Violations
A brake pedal that feels firm at 10 mph in a parking lot can still belong to a vehicle that's out of adjustment enough to fail. During CVSA's dedicated Brake Safety Week, the single most-cited violation nationwide is a service brake out of adjustment — the kind of defect a driver's daily walkaround genuinely can't catch, because it requires a pushrod stroke measurement, not a look. That's the gap this data keeps exposing: brake failure isn't usually sudden. It's a wear curve that a visual check walks straight past.
Pushrod Stroke
Measured in inches per wheel position against a defined out-of-service limit — the exact check that produced the highest single-violation OOS rate in recent Brake Safety Week data.
Lining Thickness
Trended over time, not just checked pass/fail — so a brake heading toward the limit shows up on a chart weeks before it shows up on the road.
Drum & Rotor Condition
The named focus of CVSA's 2026 Brake Safety Week — cracks, heat checking, and wear past the discard dimension stamped on the component itself.
Air System Integrity
Leak-down and buildup rate checks that catch a slow air loss long before it becomes a brake application that doesn't fully release.
None of these four checks are optional extras — they're the difference between a program that reacts to a roadside failure and one that catches the same defect in the shop, on a schedule the fleet controls. If your inspection workflow still stops at a visual walkaround, these four measurements are the fastest place to close the gap.
The Root Causes Behind the 2026 Numbers
The four measurements above catch the defect. These four patterns explain why the defect was there in the first place — and each one is fixable once it's visible on a record instead of buried in a technician's memory. Sign up for a free trial to see which of these patterns shows up most in your own fleet's history.
From a Safety Manager Who Stopped Trusting the Pedal Feel
We had a truck pass its driver walkaround on a Tuesday and get placed out of service on Thursday, same brakes, same driver. That gap is what made me stop treating pushrod stroke as a once-a-quarter shop task and start treating it as a number we track on every PM, by wheel position.
Six months in, our repeat brake defects dropped by more than half. We're not passing inspections because we got lucky with the inspector — we're passing because the number was already good before the truck left the yard.
How to Know If Your Brake Program Is Actually Working
Passing this year's roadside inspection tells you almost nothing about next year's. The number that actually matters is whether repeat brake defects are trending down across your own fleet, asset by asset, location by location. That takes three comparisons most shops aren't running yet: this quarter's OOS rate against last quarter's, by vehicle class; time-to-repair on flagged brake defects, since a defect that sits open for weeks is a defect that can fail before it's fixed; and repeat-defect rate on the same wheel position, which usually points straight at a parts or technician issue rather than a one-off. Book a demo to see these three comparisons run automatically against your own fleet's inspection history.
Conclusion: Brake Violation Trend 2026 Data Rewards Measurement, Not Luck
Every major 2026 enforcement event — International Roadcheck, Brake Safety Day, the upcoming Brake Safety Week — tells the same story: brake violations aren't rare edge cases, they're the single most predictable category of out-of-service finding on the road today. The fleets that keep showing up in that data aren't unlucky. They're running programs built on visual checks alone, on components that fail by measurement, not appearance. Closing that gap doesn't require more inspections — it requires the right ones, tracked by wheel position and trended over time. Book a demo and bring your last brake-related OOS violation to see exactly where the gap was.
Frequently Asked Questions
What percentage of vehicle out-of-service violations are brake-related in 2026?
According to CVSA's 2026 International Roadcheck, brake system violations accounted for 24.3% of all vehicle out-of-service violations on their own, and combined brake system plus "20% defective brakes" violations accounted for 39.1% of all vehicle OOS orders — the single largest category, ahead of tires (20.9%), cargo securement (12.4%), and lighting (11.9%).
What is the most common specific brake violation found during roadside inspections?
Across recent CVSA Brake Safety Week data, the single most-cited specific violation has been a service brake found out of adjustment, measured via pushrod stroke — a defect category that produced an out-of-service rate above 50% among vehicles cited for it in the most recent full-week results. This type of defect typically cannot be identified through a visual walkaround alone and requires a physical measurement.
Why can't a driver's pre-trip inspection catch most brake defects?
A driver's pre-trip inspection is designed to catch obvious, visible, or functional issues — a warning light, an obvious leak, a pedal that doesn't hold. Many of the defects that lead to brake-related out-of-service violations, such as pushrod stroke exceeding the adjustment limit, lining thickness below minimum, or drum wear beyond the discard dimension, require a physical measurement with proper tools and cannot reliably be identified by feel or visual inspection alone.
What is CVSA's Brake Safety Week and how is it different from International Roadcheck?
International Roadcheck is a broader, multi-day inspection event covering all commercial vehicle systems, typically held each spring. Brake Safety Week is a dedicated, brake-focused enforcement and education campaign held separately, usually in August, under CVSA's Operation Airbrake program. Both report violation and out-of-service data, and in most years brake components have been the top or near-top out-of-service category in each event.
How can a fleet reduce repeat brake-related out-of-service violations?
Reducing repeat brake violations generally requires moving beyond visual-only inspections to measured checks — pushrod stroke, lining thickness, drum and rotor condition, and air system integrity — captured consistently by wheel position and trended over time rather than treated as a single pass/fail event. Tracking repeat-defect rate by vehicle and by wheel position, along with time-to-repair on flagged defects, helps identify whether a specific component, technician, or parts source is driving recurring failures.
Turn brake violation trend data into a defect your fleet never has
HVI captures brake measurements by wheel position, trends wear over time, documents defects with photo evidence, and can lock a flagged vehicle from dispatch automatically — so the next roadside inspection finds nothing new.
No credit card · OOS reduction tracking built in · Live in under two weeks