You pull your roadside inspection report and see a list: a brake violation in March, a light out in April, an HOS flag in May, another brake issue in June. Individually, each looks like bad luck. Together, they're a pattern screaming to be read. Fleet roadside violation trends turn that scattered list into a diagnosis — showing you which BASIC category, which driver, which truck, and which lane keep generating the same problems. A single violation is an incident; a trend is a warning you can act on before the next citation. This guide shows you how to read yours. Book a demo to see your patterns surfaced automatically.
The Same Violation Data, Read Five Ways
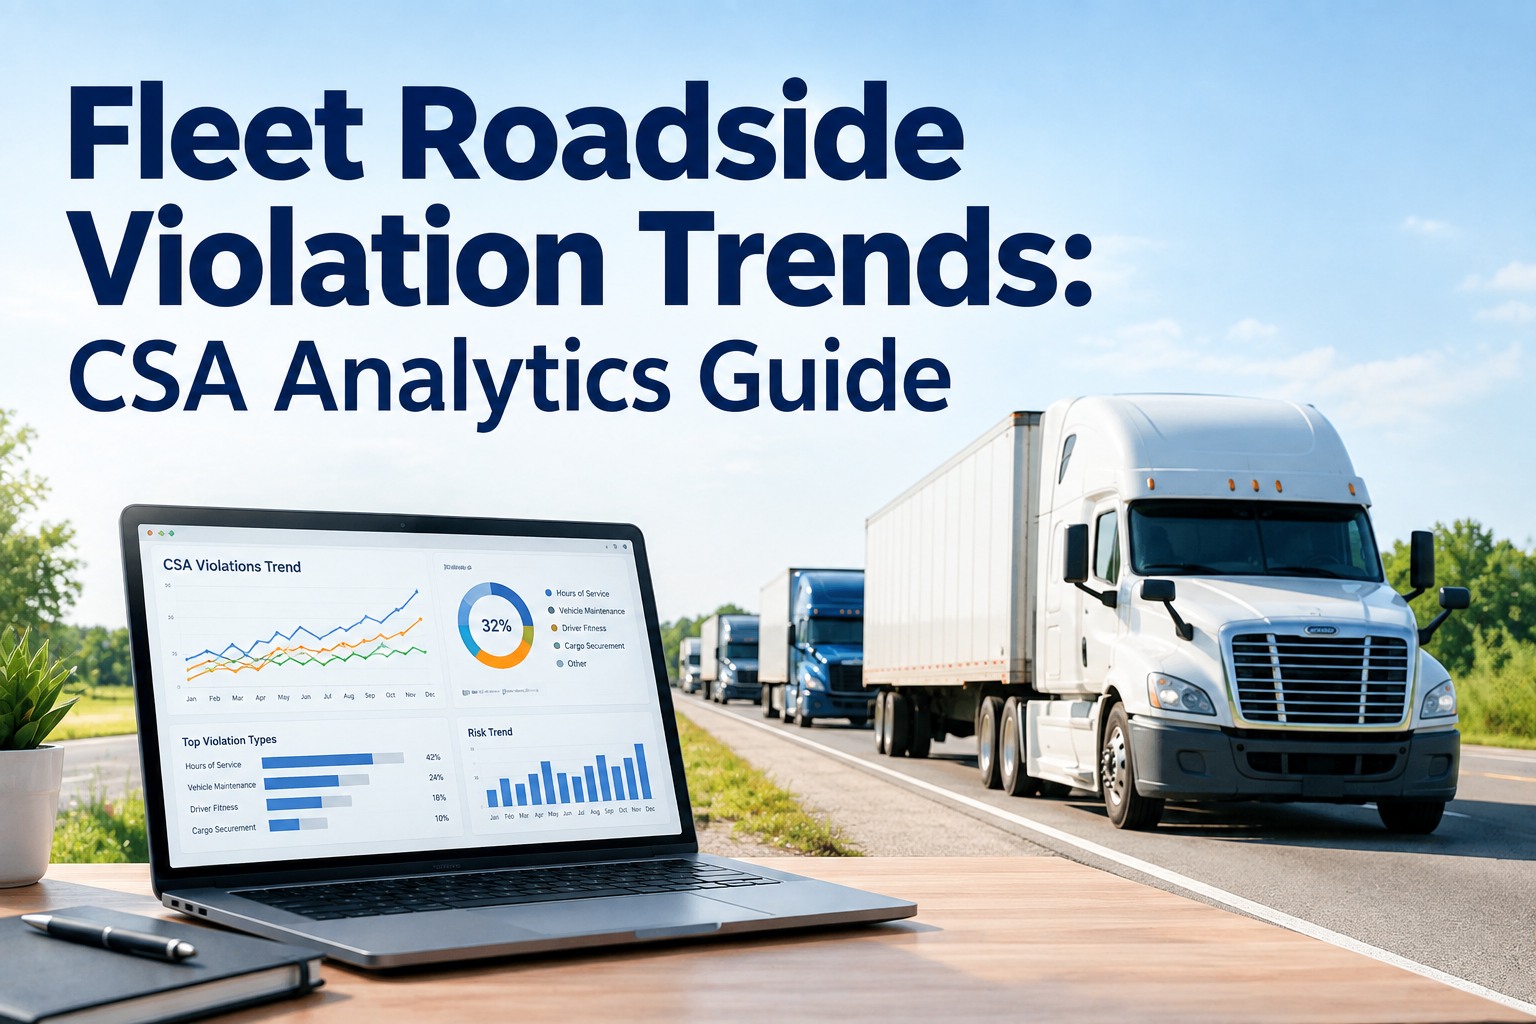
One list of violations holds five different stories. Slice it by category, driver, vehicle, location, and time, and the clusters that predict your next citation come into focus — each pointing to a different fix.
Every roadside violation your fleet collects carries more information than the citation itself. Analyzed one at a time, violations look like random misfortune and you end up playing whack-a-mole. Analyzed as trends — grouped, counted, and cross-referenced — they reveal the handful of root causes generating most of your compliance risk. The goal of CSA analytics isn't to admire the data; it's to find the two or three patterns worth fixing. Here are the five lenses that surface them.
Lens 1: By BASICwhere your risk actually concentrates
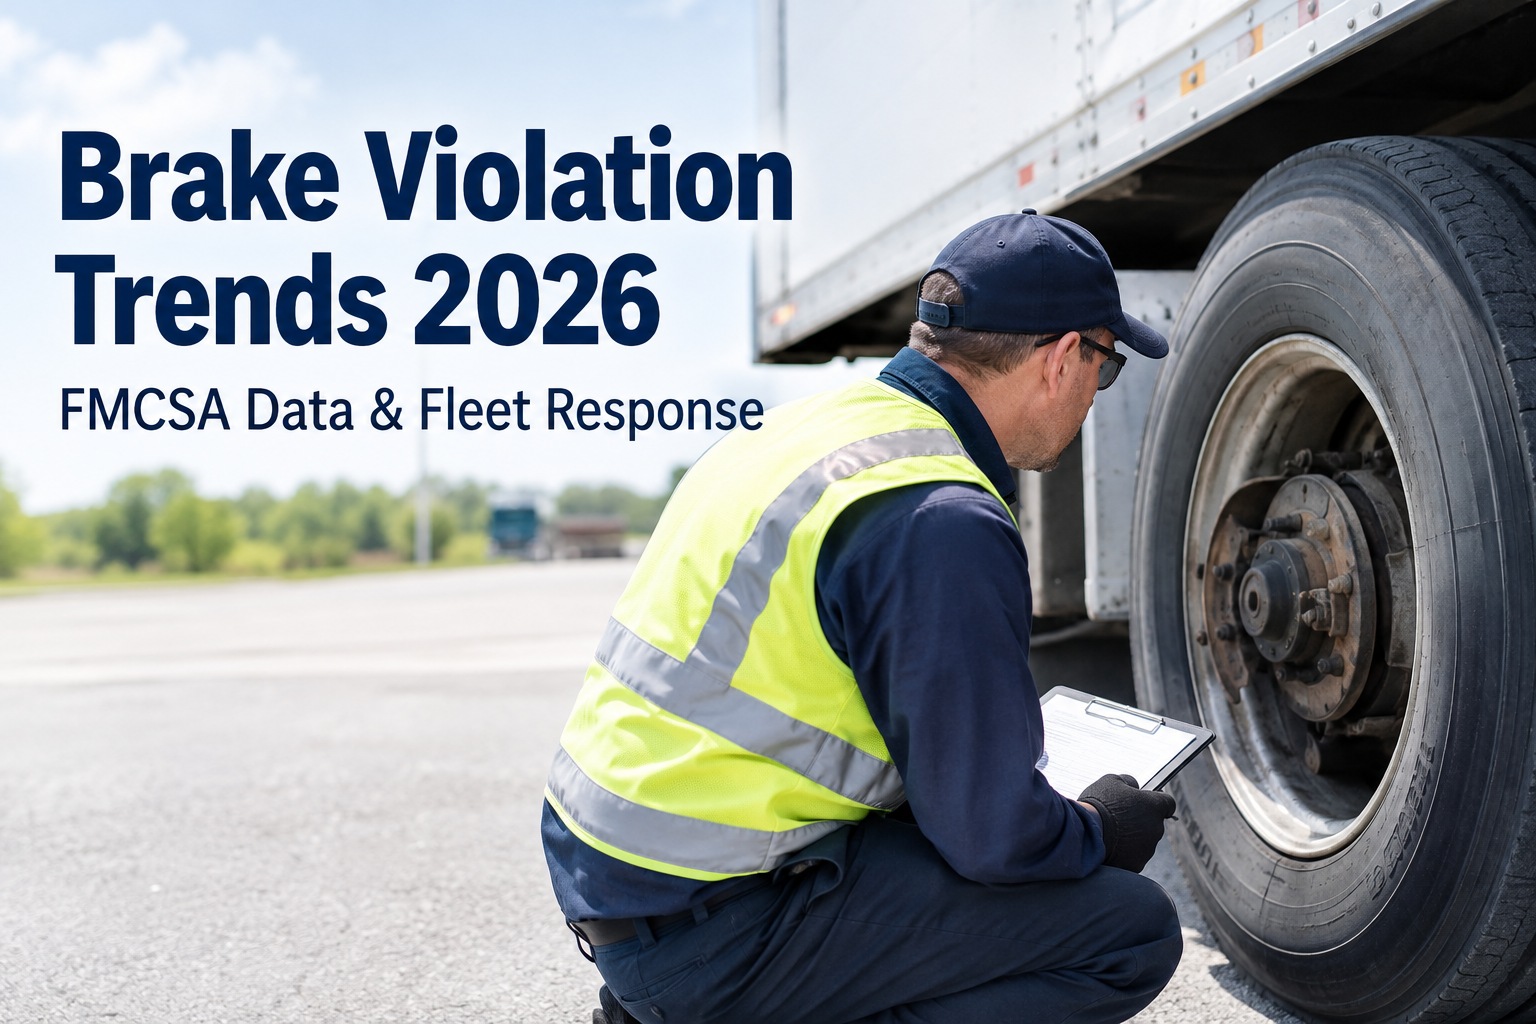
Start by grouping every violation into its BASIC category, because that's how the FMCSA scores you and where a threshold breach does damage. This lens answers the first strategic question: which category is generating the most risk, and is it one that flags easily? Roadside data year after year shows violations cluster hard in a few places — on the vehicle side, brakes, tires, and lights together drive the large majority of out-of-service orders, and on the driver side, hours-of-service and credential issues dominate.
The value of this lens is prioritization. If brakes, tires, and lights make up most of your out-of-service events — as they do for most fleets — then your inspection program has a clear, narrow target rather than a vague mandate to "do better." And if one high-threshold BASIC like Unsafe Driving or HOS is climbing, this is where you'll see it first, while there's still time to act. Book a demo to see your violations grouped by BASIC automatically
Lenses 2 & 3: Driver & vehiclethe 80/20 hiding in your fleet
Grouping by category tells you what's happening; grouping by driver and by vehicle tells you where it's coming from — and the answer is almost never "evenly spread." Compliance risk concentrates. A small share of drivers typically generates a large share of the behavior-based violations, and a handful of aging or hard-run trucks produce a disproportionate share of the mechanical ones. Finding those specific units is where analytics stops being a report and becomes an action list.
Rank drivers by violation count and type. Repeat HOS or speeding flags point to specific coaching needs; a single driver appearing again and again is a targeted intervention, not a fleet-wide memo.
Rank units by mechanical violations. A truck that repeatedly fails on brakes or lights is telling you its PM interval is wrong, or it's due for replacement — a maintenance decision, not a driver problem.
This is the lens that saves the most wasted effort. Without it, a fleet responds to a rising violation count by retraining everyone and inspecting everything harder — expensive and diffuse. With it, you find the three drivers and the two trucks generating half the problem and fix those specifically. The same data also separates a driver problem from a vehicle problem, which are two completely different fixes people constantly confuse. Start free and rank violations by driver and vehicle
Lenses 4 & 5: Location & timethe dimensions most fleets never look at
The two most overlooked lenses often reveal the most surprising patterns, because they surface causes that have nothing to do with any individual driver or truck. Where and when your violations happen can point straight at a systemic issue in how the operation is run.
Violations clustering on a particular lane, state, or scale house can signal a route problem — a corridor with aggressive enforcement, or one whose schedule forces drivers into HOS pressure. It can also reveal where a certain defect type keeps appearing, like lights failing on dusty jobsite routes. The fix might be re-routing or re-scheduling, not re-training.
Trending violations across weeks and months is what separates a bad month from a real problem. A category ticking up steadily over a quarter is a trend worth acting on; a one-week spike may just be a Roadcheck blitz. Time analysis also proves whether a fix worked — if you coached the drivers and adjusted the PM interval, the trend line should bend.
Location and time are also what turn analytics into a feedback loop. You spot a cluster, make a change, and then watch the trend to confirm the change actually moved the number — instead of guessing. That closed loop is the whole point of treating violations as data rather than as isolated bad days. Book a demo to see violation trends mapped by location and time
From data to actionthe loop that actually lowers violations
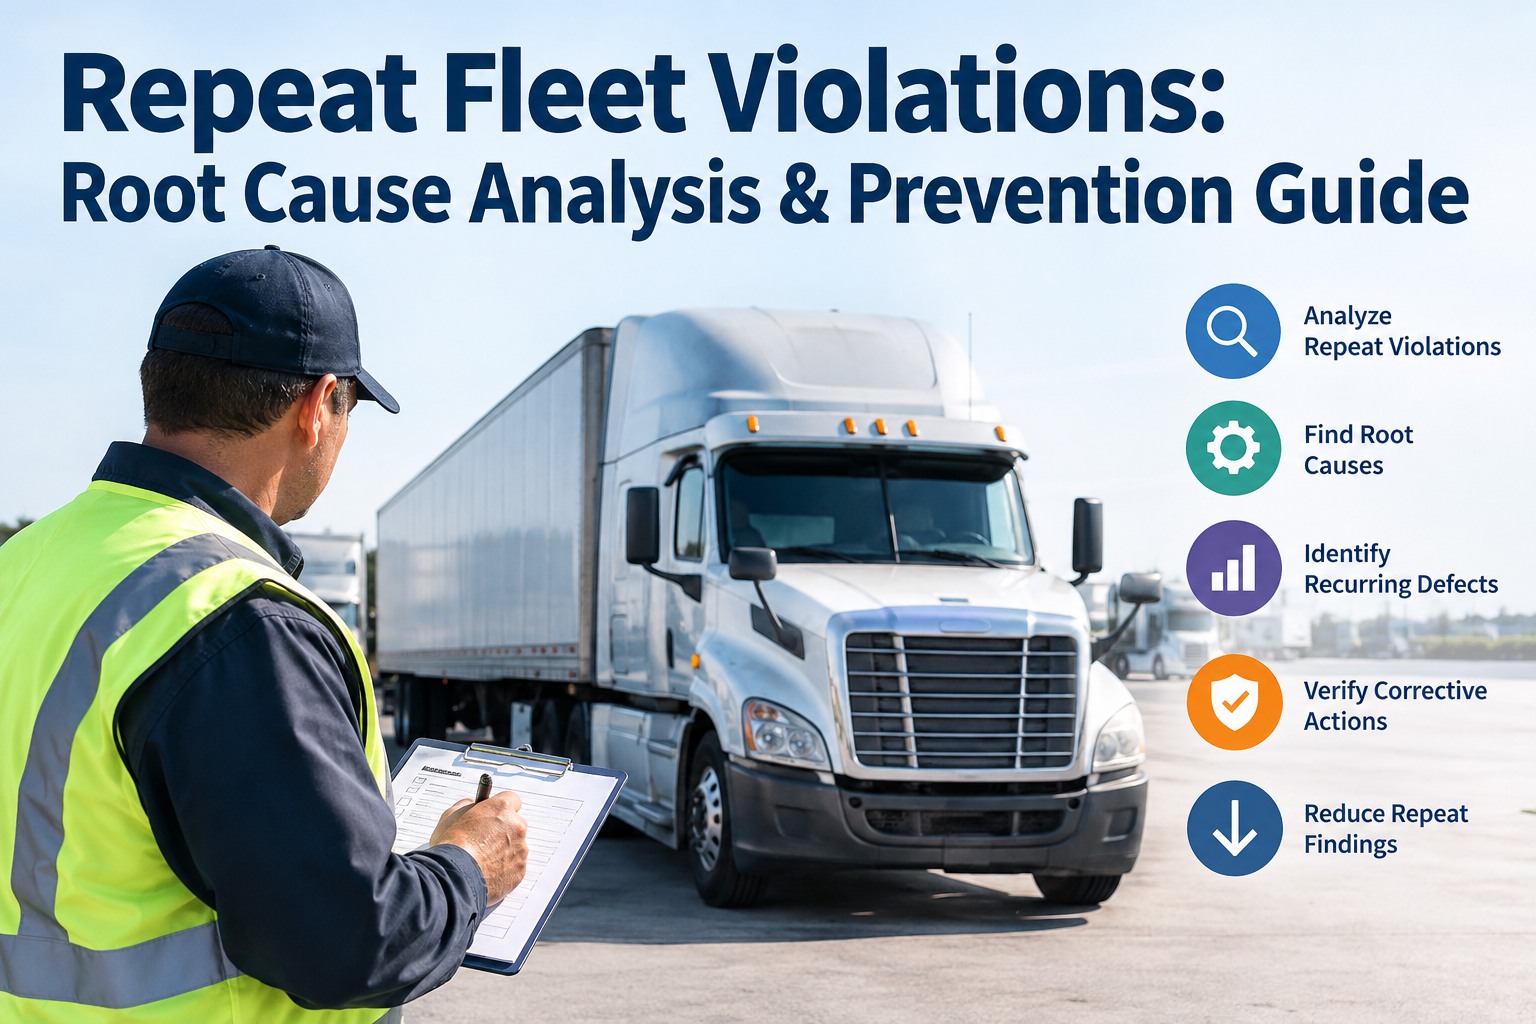
Analytics only matters if it ends in a change. The fleets that get value from violation trend analysis run a simple, repeatable loop — and the reason it works is that each step feeds the next, turning a monthly report into steadily fewer citations. Here's the cycle.
Notice what this loop is not: it's not disputing every violation, and it's not inspecting everything harder in a panic. It's a disciplined, evidence-led process that spends your limited time and money on the few root causes that actually matter. Done consistently, it doesn't just lower your violation count — it improves your CSA percentiles, strengthens your compliance records, and turns your safety program from reactive to predictive. Book a demo to see the full analytics loop in action Or start free and turn your violation data into a working loop
From a safety manager who reads the trends
We'd been treating every roadside violation as its own little fire. Someone got a light violation, we'd yell about lights for a week. Then I finally put a quarter of data into one view and sorted it. Half our vehicle violations came from six trucks — all the same generation, all past due for a PM interval change we'd never made.
That was the whole problem, sitting in the data the entire time. We changed the interval on those units, and the vehicle violations dropped off a cliff the next quarter. I wasn't working harder — I was finally looking at the pattern instead of the individual citations. The trend told me exactly where to spend the money.
Frequently asked questions
What are fleet roadside violation trends?
Fleet roadside violation trends are the patterns that emerge when you analyze your roadside inspection violations as a group rather than as isolated incidents. A single violation — a brake defect, a light out, an hours-of-service flag — tells you little on its own. But when you aggregate all of your violations and slice the data across dimensions like BASIC category, driver, vehicle, location, and time, recurring patterns appear: the same truck failing on brakes, the same driver flagged for HOS, the same lane producing citations, or a category climbing steadily over a quarter. Those patterns point to root causes you can actually fix, rather than symptoms you keep reacting to. Analyzing trends this way is the foundation of CSA analytics, because it lets a fleet prioritize its limited time and money on the two or three issues generating most of its compliance risk instead of trying to improve everything at once. In short, a violation report tells you what already happened; a violation trend tells you what's likely to happen next and why.
How do I analyze CSA violations by BASIC category?
Analyzing by BASIC category means grouping every violation into the FMCSA Behavior Analysis and Safety Improvement Category it falls under — Unsafe Driving, Hours-of-Service Compliance, Vehicle Maintenance, Driver Fitness, Controlled Substances/Alcohol, Hazardous Materials, and Crash Indicator. This is the most important first cut because it mirrors how the FMCSA scores your fleet and where crossing a threshold does damage. The goal is to see which category is generating the most risk and whether it's a high-consequence one. In practice, roadside data year after year shows violations concentrate heavily in a few areas: on the vehicle side, brakes, tires, and lights together account for the large majority of out-of-service orders, and on the driver side, hours-of-service and credential issues like missing CDLs or medical cards lead. Grouping your own violations this way tells you whether you match that typical profile or have a distinct problem area, and it flags a high-threshold category like Unsafe Driving or HOS while it's still climbing rather than after it crosses. That prioritization turns a vague goal of "improve compliance" into a specific, narrow target for your inspection and coaching programs.
Why analyze violations by driver and vehicle?
Because compliance risk almost never spreads evenly, and analyzing by driver and vehicle reveals the concentration. Typically a small share of drivers generates a large share of behavior-based violations, and a handful of aging or hard-run trucks produce a disproportionate share of the mechanical ones. Ranking drivers by violation count and type shows you exactly who needs coaching — a driver appearing repeatedly for HOS or speeding is a targeted intervention rather than a reason to lecture the whole fleet. Ranking vehicles by mechanical violations shows you which units have a maintenance problem — a truck that keeps failing on brakes or lights is signaling that its preventive-maintenance interval is wrong or that it's due for replacement. This lens matters most because it prevents wasted effort: without it, fleets respond to rising violations by retraining everyone and inspecting everything harder, which is expensive and unfocused. With it, you fix the specific drivers and trucks generating most of the problem. It also cleanly separates a driver problem from a vehicle problem — two very different fixes that are easy to confuse when you only look at the violation type.
Can location and time data really reduce violations?
Yes, and these two dimensions are the ones most fleets never examine, which is exactly why they often reveal the most. Analyzing by location can expose a route problem: violations clustering on a particular lane, state, or scale house might indicate a corridor with aggressive enforcement, a schedule that pressures drivers into hours-of-service violations, or conditions that produce a specific defect — like marker lights getting obscured by dust and mud on jobsite routes. The fix in those cases is re-routing or re-scheduling, not re-training a driver who was never the real problem. Analyzing by time separates a genuine trend from noise: a category rising steadily across a quarter is a real problem worth acting on, whereas a one-week spike may simply reflect a national enforcement blitz. Time analysis also closes the loop by proving whether a corrective action worked — after you coach the drivers or change a PM interval, the trend line should bend, and if it doesn't, you know to try something else. Together, location and time turn violation analysis from a static report into a feedback loop that confirms your fixes are actually working.
What tools help track fleet compliance analytics?
The core requirement is a system that captures your violations and inspections in one place and tags each one with the dimensions you need to analyze — BASIC category, driver, vehicle, location, and date — so you can slice the data without manual spreadsheet work. A capable fleet compliance and CSA analytics platform aggregates roadside violations alongside your own inspection and maintenance records, then surfaces the clusters automatically: the truck that repeatedly fails on brakes, the driver stacking up HOS flags, the lane generating citations, or the category trending toward a threshold. The most useful tools also connect the analysis to action, tying a flagged defect to a work order and letting you track whether a corrective step actually bent the trend over time. Beyond the analytics themselves, the same system should preserve complete, timestamped records, since those both feed the analysis and serve as your compliance documentation. The practical test of any tool is whether it turns your violation history into a short, prioritized list of root causes to fix — rather than just a longer report to read. That shift from reporting to prioritized action is what makes analytics worth the investment.
Turn your violation history into a prioritized fix list
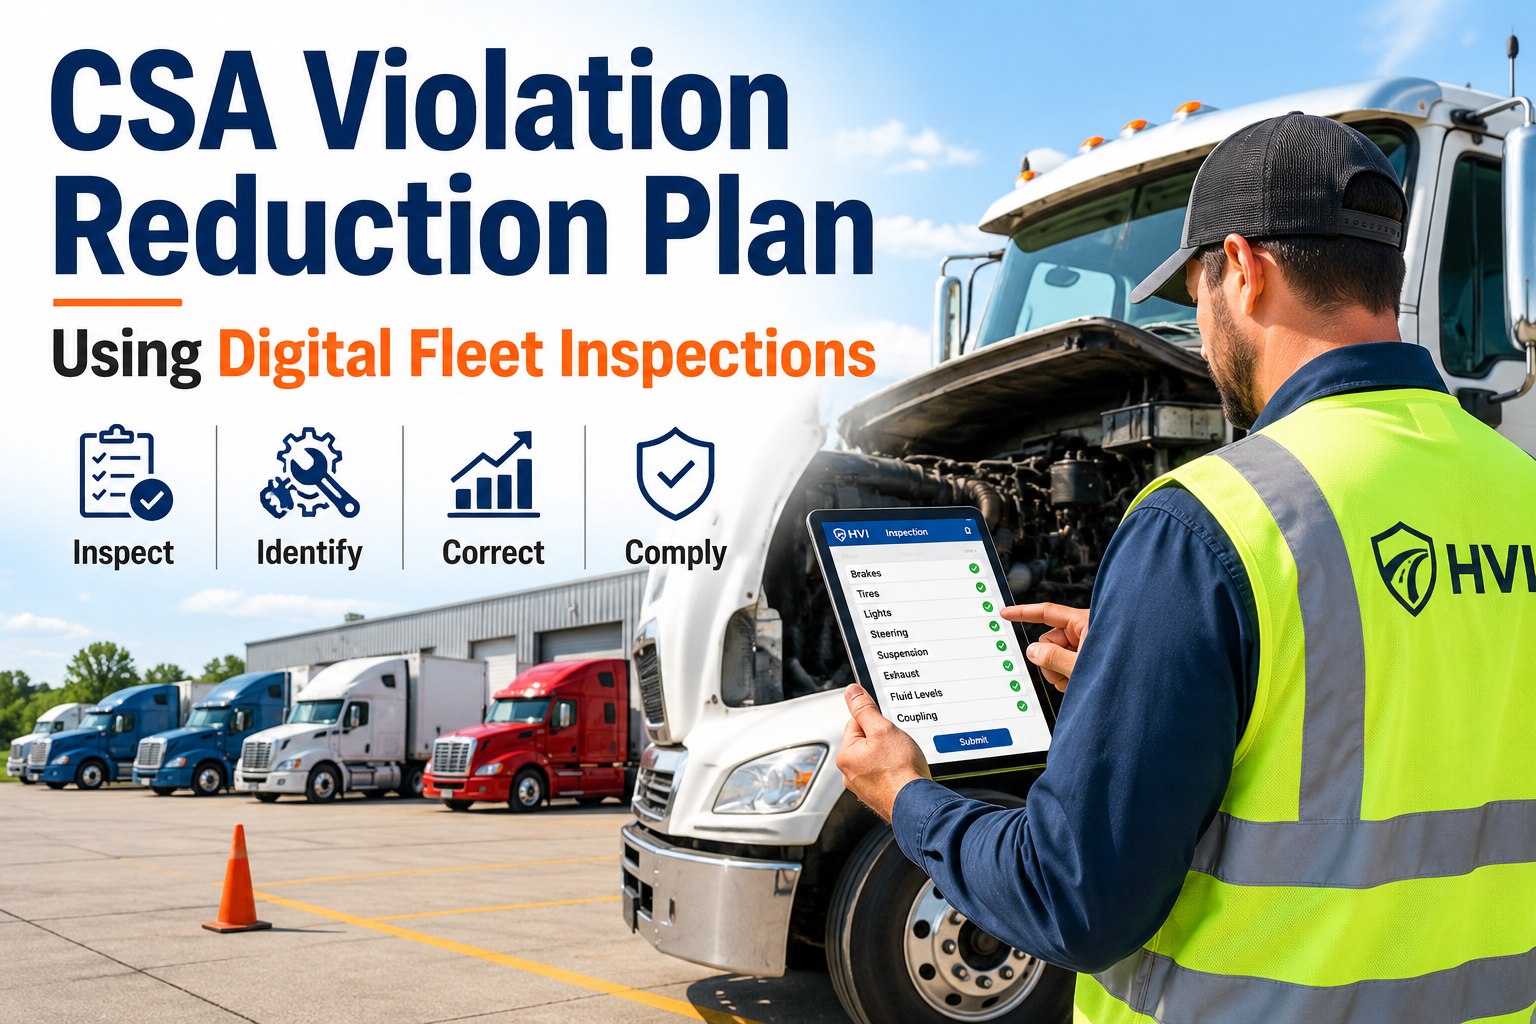
HVI aggregates your roadside violations and inspection data, tags each one by category, driver, vehicle, location, and date, and surfaces the two or three clusters generating most of your compliance risk — then ties each one to the corrective action that closes it. You spend your effort where it changes the number, watch the trend confirm the fix, and move on to the next. Reactive becomes predictive. Live in under two weeks.
No credit card · CSA analytics & violation tracking from day one · Built for USA carriers