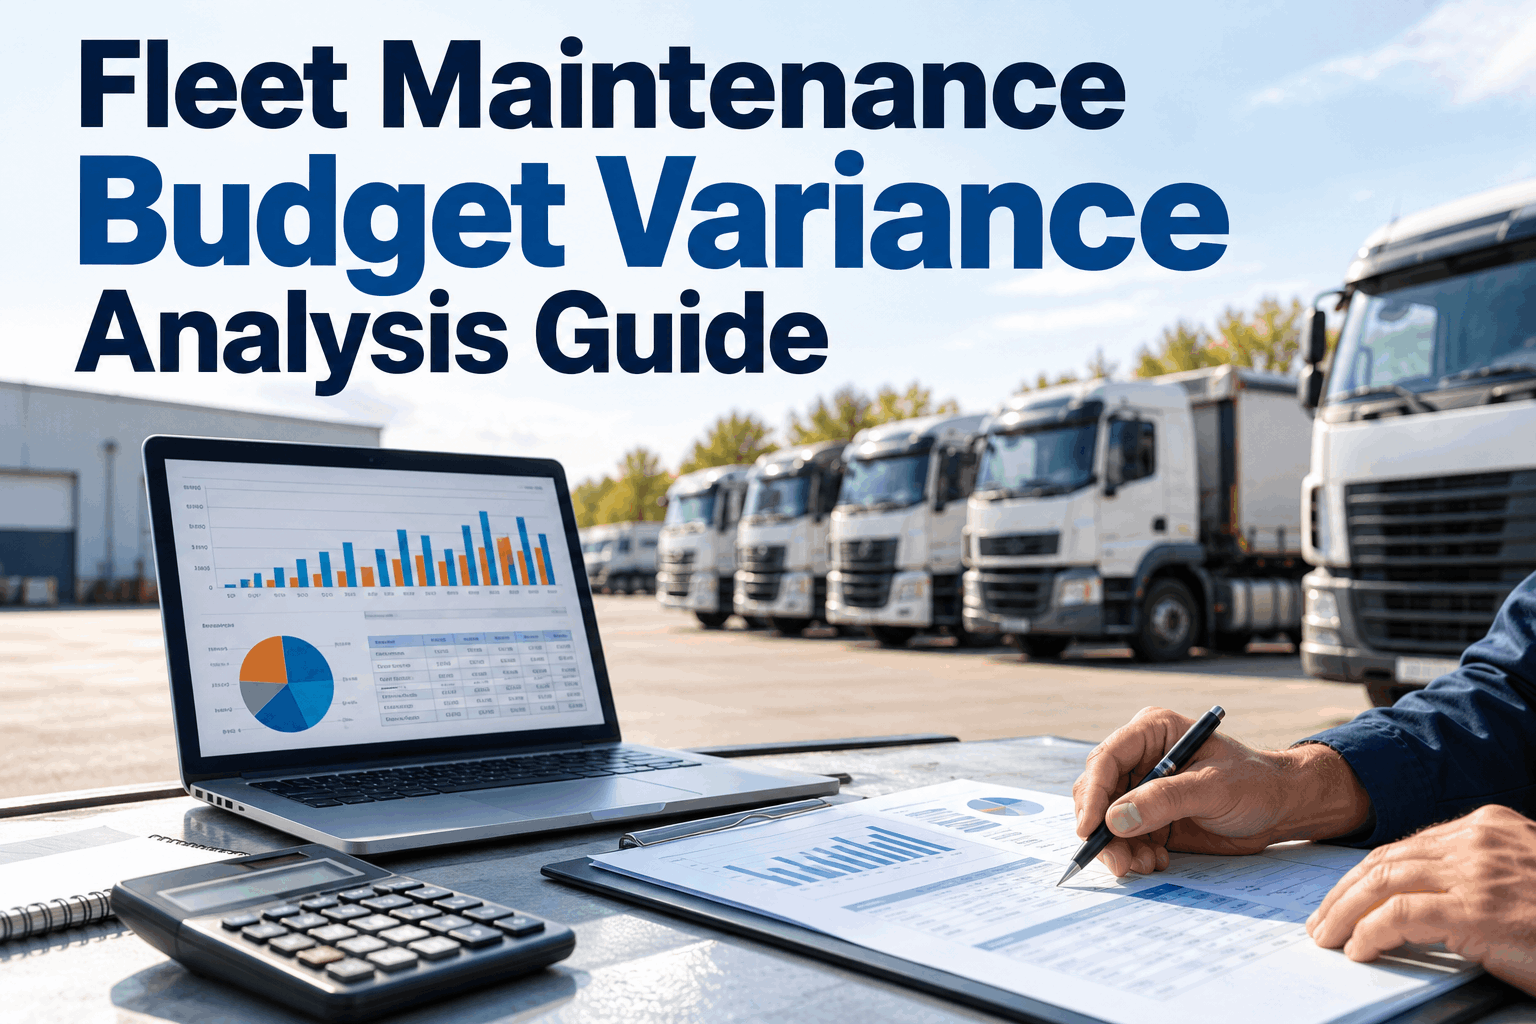
The maintenance line comes in 14% over budget. The CFO asks why. The answer is "stuff broke more than we expected" — true, unhelpful, and exactly the kind of non-answer that makes finance distrust every number maintenance reports afterward. A maintenance budget variance isn't an explanation. It's a number asking you to go find one.
5 Reasons a Budget Variance Actually Happens
This guide walks through how to calculate maintenance budget variance correctly, then — more importantly — how to decompose it into the five causes above so finance and maintenance teams can agree on what actually happened. It covers the preventive-versus-reactive mix shift most fleets miss, why variance needs an asset-level view to mean anything, a practical investigation workflow, and how to turn a budget overrun into a forecast correction instead of a repeated argument.
Why "We're Over Budget" Isn't an Answera variance percentage describes the gap — it doesn't explain it
Maintenance budget variance is simple to calculate: actual spend minus budgeted spend, usually expressed as a percentage. The calculation takes a minute. What it leaves out is everything a CFO or fleet director actually needs to act on — whether the overrun came from a handful of aging trucks, a parts price increase across the whole fleet, more breakdowns than planned, or jobs that are legitimately taking longer than they used to. Two fleets can report the identical 14% variance for completely different reasons, and only one of those reasons says anything about next year's budget.
The 5 Variance Types, With a Fleet Exampleborrowed from standard cost accounting, applied to a wrench and a work order
Price variance
Same parts, same number of jobs — but a supplier raised prices or a labor rate increased. The volume of work didn't change; the cost per unit did.
Volume variance
More work orders were opened than planned — more breakdowns, more inspections failing, simply more repair events across the fleet than the budget assumed.
Mix variance
The total number of jobs matched the plan, but more of them were reactive repairs and fewer were scheduled PM — reactive work costs more per job, so the mix shift alone inflates spend.
Efficiency variance
The same repair type is taking more labor hours or more parts than it used to — a sign of an aging asset, a skills gap, or a part that's becoming harder to source efficiently.
Timing variance
A PM service budgeted for next quarter happened early, or a planned overhaul slipped a few weeks. The annual total may be fine — the monthly or quarterly comparison looks alarming until the calendar catches up.
Book a demo to see a fleet-wide variance broken into these five categories automatically, instead of one number everyone has their own theory about.
Preventive vs. Reactive: The Mix Variance Most Fleets Missthe same number of jobs can cost very different amounts
Of the five variance types, mix is the one that hides best inside a healthy-looking job count. A fleet budgeted for 100 scheduled services and 20 reactive repairs this quarter might actually run 90 scheduled and 30 reactive — roughly the same total workload, a meaningfully different bill, because reactive repairs routinely cost more than the preventive work they replace: rush parts, overtime labor, and often a bigger problem than the one a scheduled service would have caught earlier. A budget overrun that's really a mix shift toward reactive work is a maintenance-execution problem, not a pricing or volume problem — and treating it like a pricing problem (renegotiating vendor rates, say) won't fix what's actually driving the number.
Asset-Level View: Recurring Problem or One-Time Event?a fleet-wide average can hide one expensive truck for a full year
A 10% fleet-wide variance can mean every vehicle ran slightly over, or it can mean 95% of the fleet ran on budget while three aging units absorbed a major component failure each. Those two situations call for completely different responses — one is a fleet-wide cost control issue, the other is a replacement decision waiting to happen on three specific assets. Breaking variance down per vehicle, not just per category, is what separates a recurring cost problem worth investigating from a one-time event — an emergency repair, a major component replacement, a single bad month — that doesn't actually predict anything about next quarter.
A Practical Variance Investigation Workflowfive steps, run monthly instead of once a year under pressure
Running this monthly rather than at year-end means a mix shift or an efficiency slide gets caught while there's still a quarter left to do something about it, instead of showing up as an annual surprise nobody saw coming.
From a fleet director who stopped dreading the budget review
For years our budget review was me explaining a single overrun percentage with a story finance had no way to verify. The quarter we started breaking it into price, volume, and mix, the whole conversation changed — I could say "parts prices rose 4%, but the rest of the overrun is a mix shift toward reactive work on four specific trucks," and point to exactly which four. Finance stopped treating every variance like a credibility test, because the number finally came with a reason attached to it.
How HVI Connects Maintenance Budget Variance to the Work Order Behind It
HVI's cost analysis ties every dollar of maintenance spend to the specific work order, asset, and cost category it came from — parts, labor, preventive versus reactive — so a budget-versus-actual gap can actually be traced back to its source instead of summarized as one unexplained percentage. Sign up free to see your own fleet's spend broken down this way for the current period.
Work order costs roll up to cost per asset automatically, so a variance concentrated on three aging units shows up as three flagged assets, not a single fleet-wide average that hides them. Analytics track the trend over time, distinguishing a one-time spike from a genuine recurring pattern worth escalating into a replacement conversation. Book a demo — Control Fleet Maintenance Costs with HVI to see cost analysis, work order costs, and analytics working together on your own budget review.
Frequently Asked Questions
How do you calculate maintenance budget variance?
Maintenance budget variance is calculated as actual maintenance spend minus budgeted spend, typically expressed as a percentage of the budget. A positive variance means spending exceeded the budget; a negative variance means spending came in under plan. The calculation itself is straightforward — the harder and more useful part is determining why the gap occurred.
What are the different types of budget variance in fleet maintenance?
The main categories are price variance (paying more or less per unit of parts or labor), volume variance (more or fewer repair events than planned), mix variance (a shift in the proportion of preventive versus reactive work), efficiency variance (jobs taking more or less labor and parts than the same job type usually requires), and timing variance (spend landing in a different budget period than planned). Decomposing a variance into these categories explains what actually happened rather than just how large the gap is.
Why does the preventive-versus-reactive mix affect budget variance?
Reactive repairs routinely cost more than the preventive service that would have addressed the same issue earlier, due to rush parts, overtime labor, and the larger scope a deferred problem tends to develop. If the planned ratio of preventive to reactive work shifts — even with the same total number of jobs — total cost rises because the mix of work became more expensive, not because more work happened or prices changed.
Why does variance need to be analyzed at the asset level?
A fleet-wide variance percentage can be produced either by a small overrun spread evenly across every vehicle or by a large overrun concentrated on a handful of aging or problem assets — and those two situations require completely different responses. Breaking variance down per asset reveals whether a cost problem is systemic across the fleet or isolated to specific units that may be approaching a replacement decision.
What's considered a normal budget variance for fleet maintenance?
Many fleets use a rule of thumb of roughly ±5% to ±10% as an acceptable monthly or quarterly variance before it warrants investigation, though the right threshold depends on fleet size, asset age, and how volatile a particular cost category normally runs. What matters more than the threshold itself is having a consistent process to decompose any variance that crosses it, rather than treating every number above the line the same way.
The Takeaway
A maintenance budget variance number only tells you that something changed — it never tells you what. Decomposing it into price, volume, mix, efficiency, and timing differences, then checking whether the result is concentrated on specific assets or spread across the fleet, turns an uncomfortable budget conversation into a short list of specific, explainable causes. Run that process monthly instead of scrambling for an explanation at year-end, and the next budget review stops being a defense and starts being a report finance can actually trust.
Turn every budget overrun into an asset-level explanation
HVI connects planned and actual costs to the work orders, parts, labor, and assets behind them — so maintenance budget variance comes with a reason attached, not just a percentage.