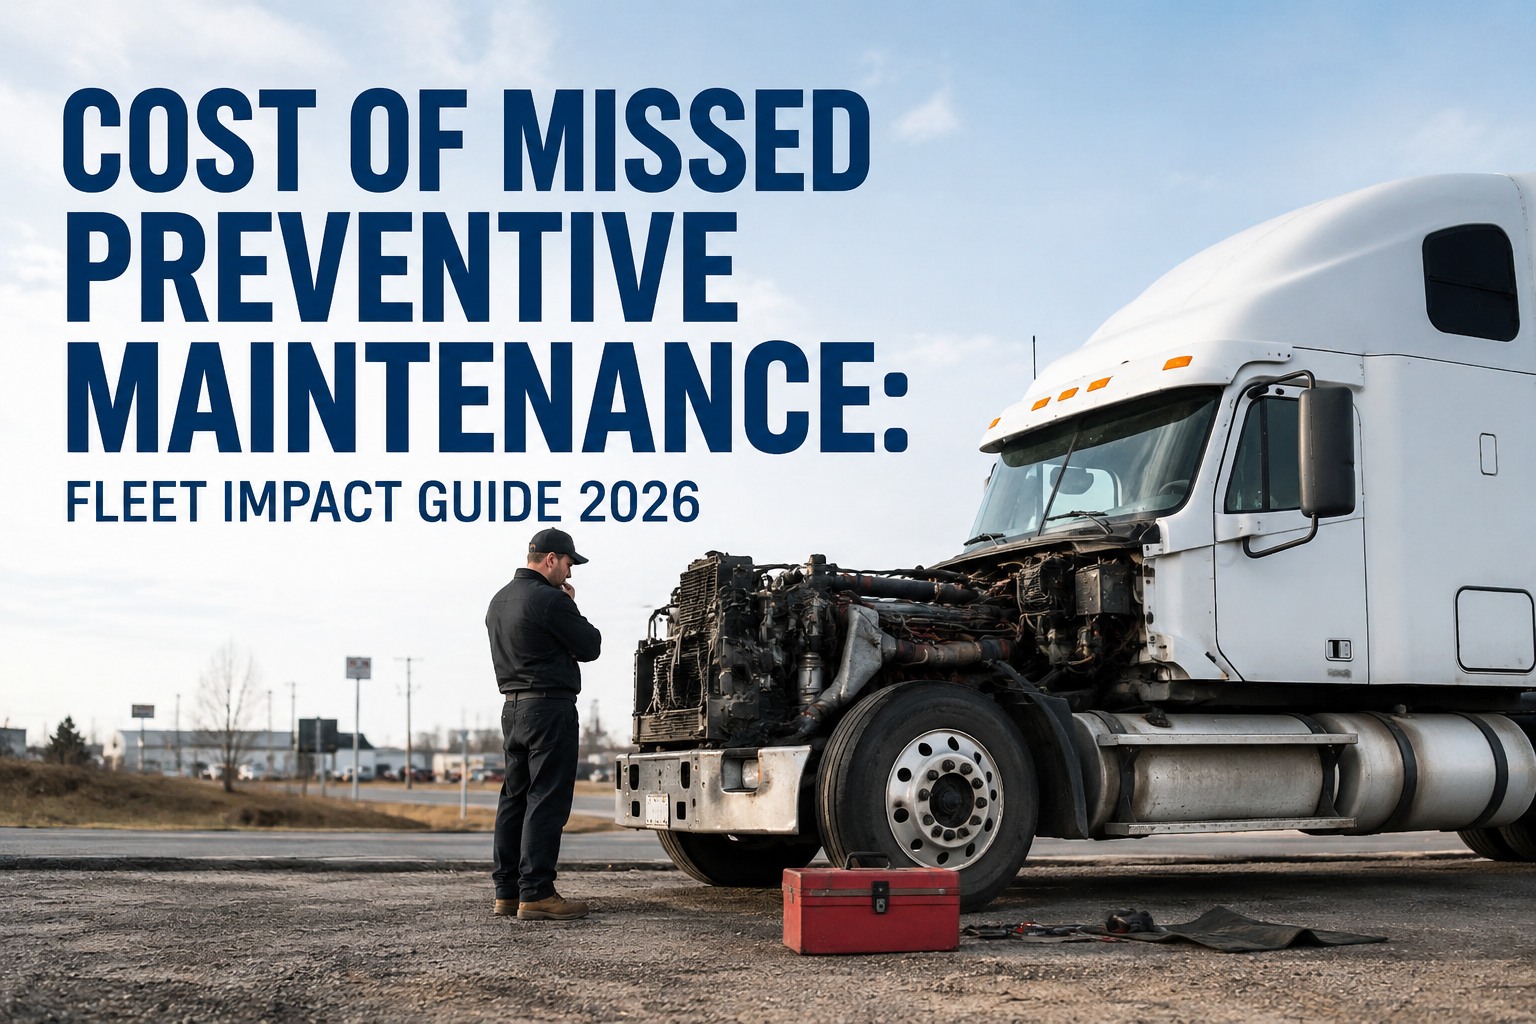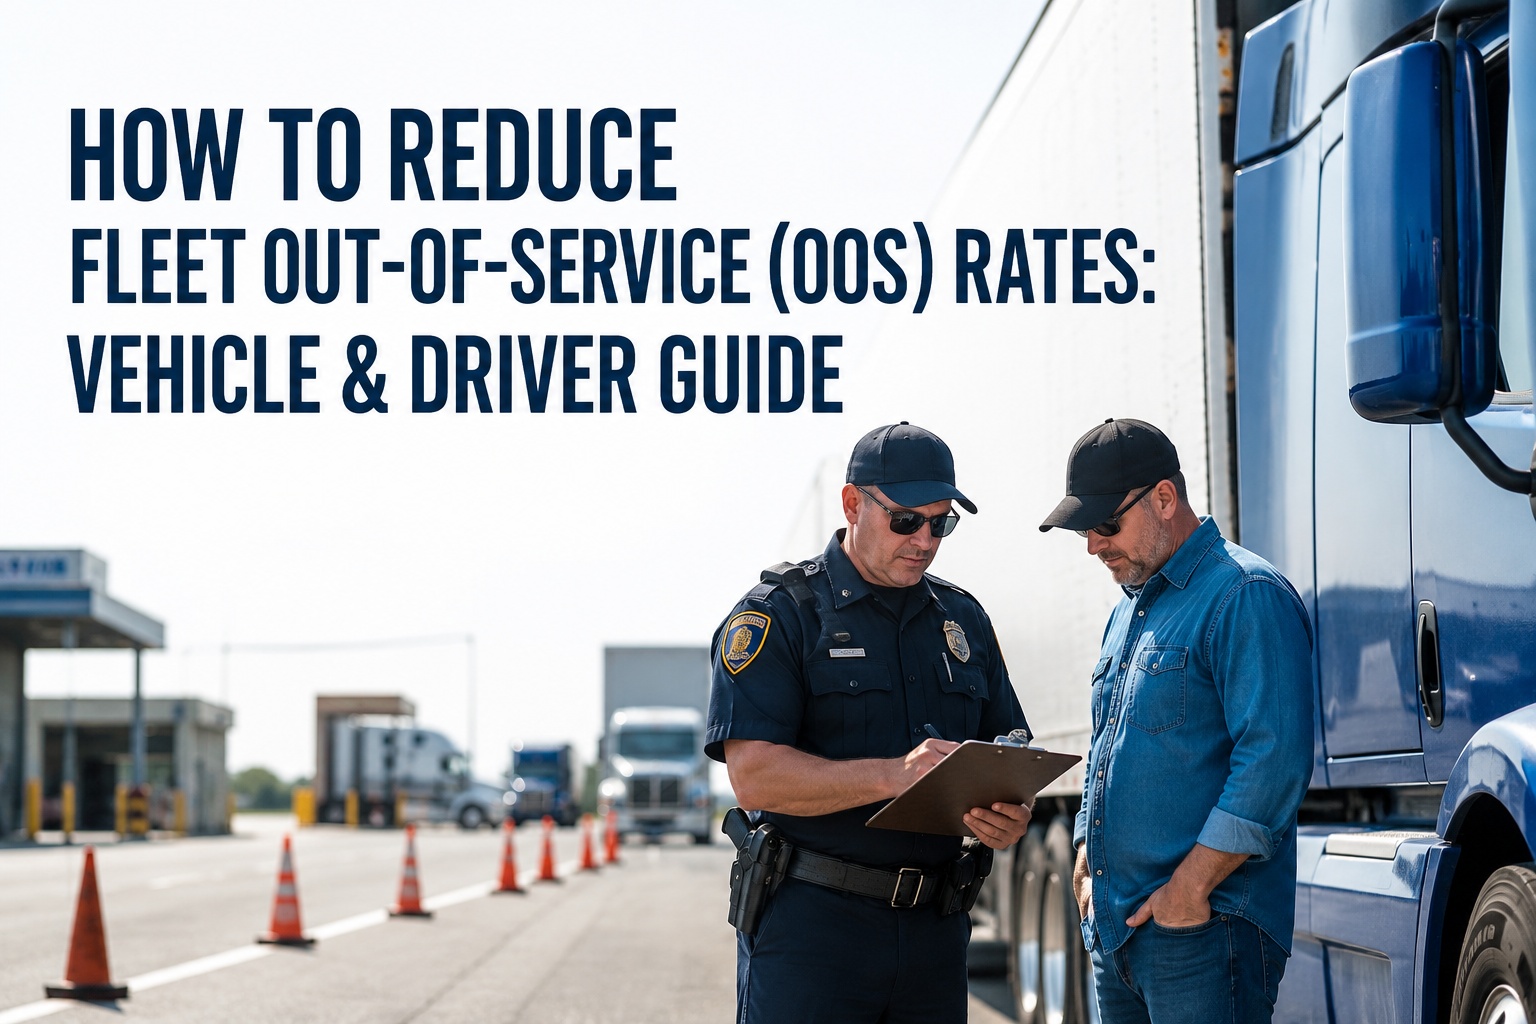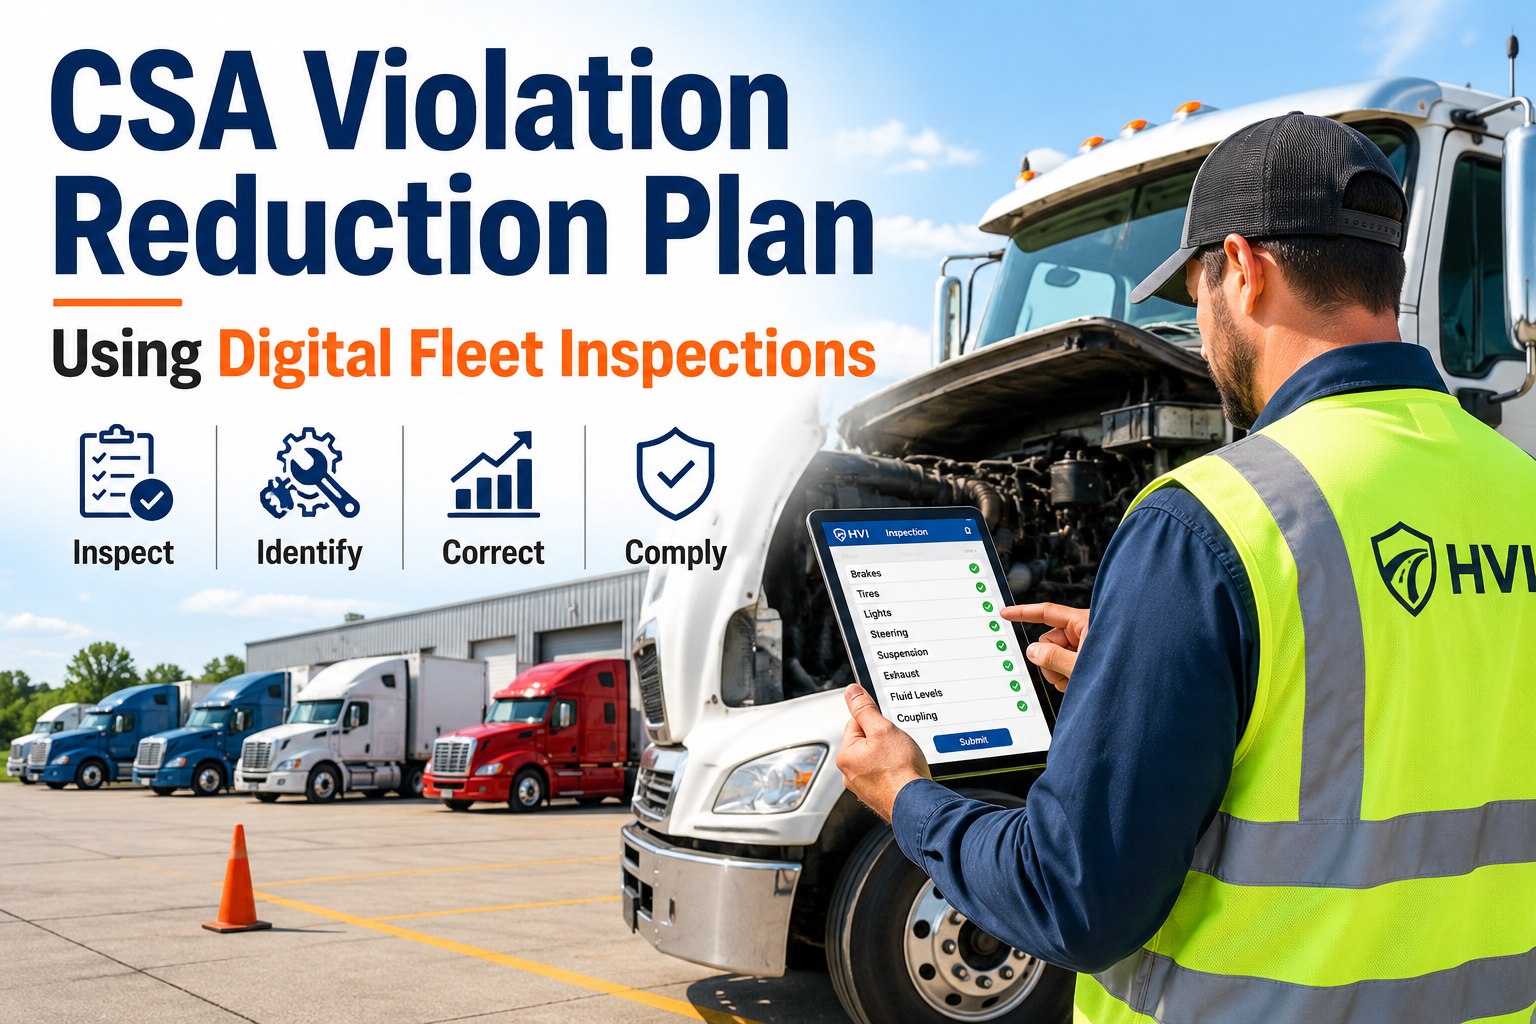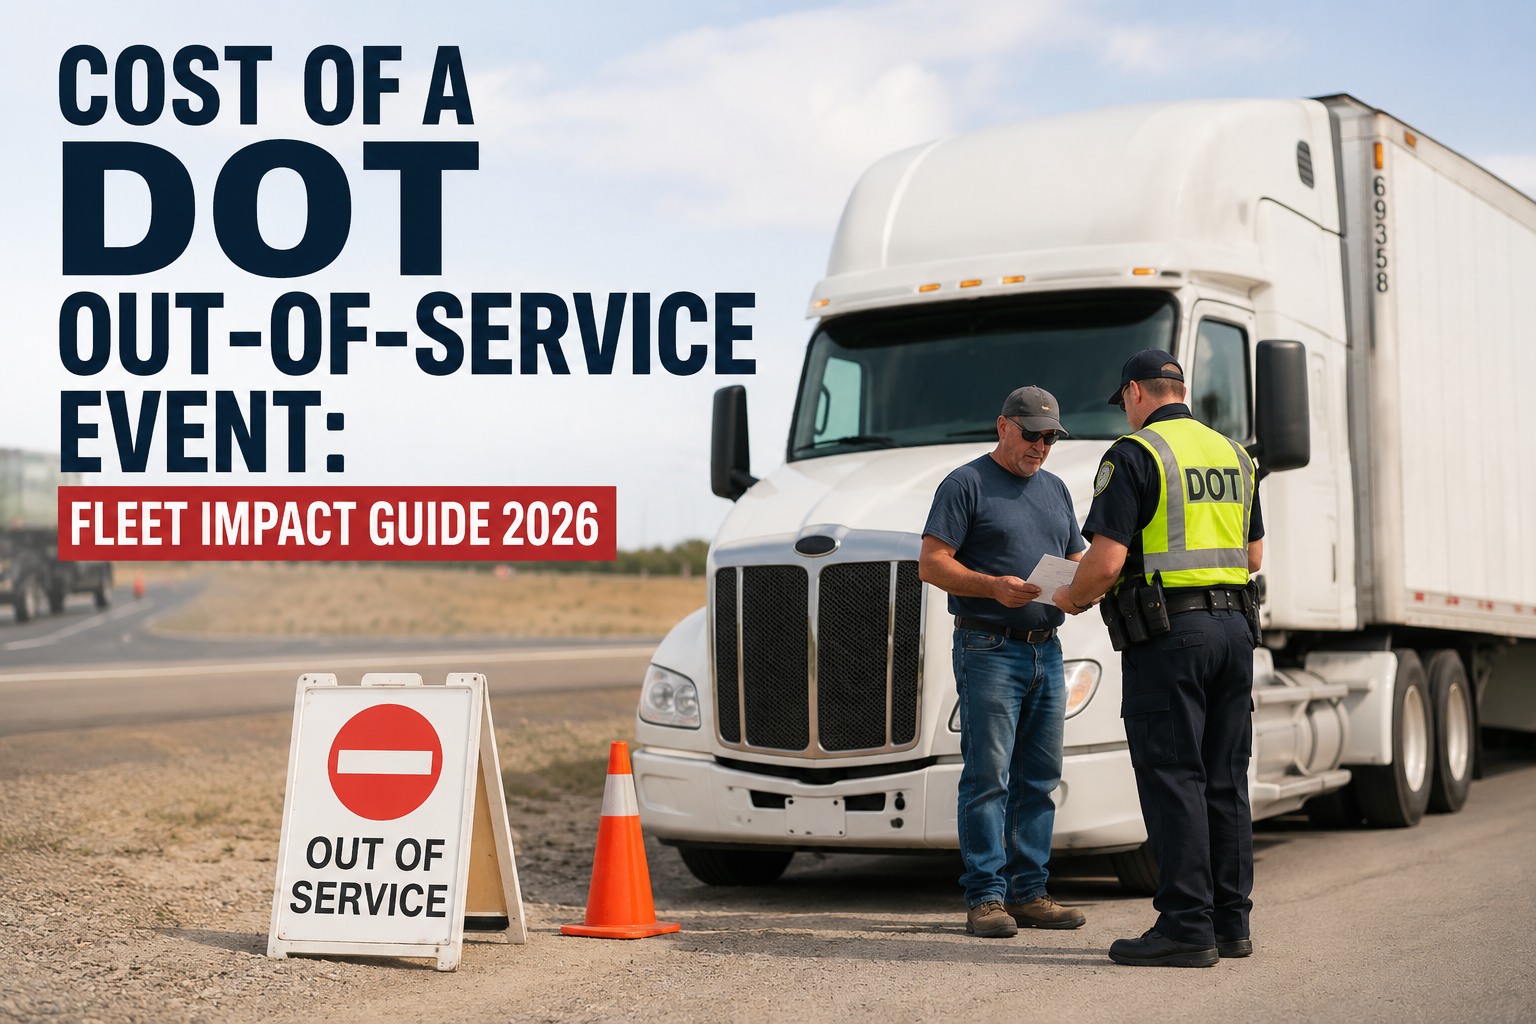
A single roadside out-of-service order can cost a fleet 20–50 times the price of the underlying defect. A worn brake shoe, a chafed hose, a bald steer tire — parts are pennies. The OOS event includes mobile diagnostics or tow, emergency repair at premium rates, driver detention pay, missed delivery fees, and CSA severity impact that follows the carrier 24 months. In the 2025 CVSA Roadcheck, 18.1% of inspected vehicles were placed out of service. Understanding the real cost makes prevention rational. Book a demo .
The DOT Out-of-Service Cost Timeline — What a Single Event Actually Costs
Illustrative Class 8 tractor, moderate-severity vehicle OOS. Numbers vary by location, cargo, and repair scope.
Roadside out-of-service events sit in an awkward economic category for most fleets — individually painful but treated as unavoidable operating cost, tracked (if at all) as a maintenance line item rather than measured against the prevention investment that would have avoided them. A single moderate-severity OOS on a Class 8 tractor commonly runs $3,000–$10,000 when the direct costs are added honestly; extended-scope events with major repair, tow, and load rescue push into $15,000–$25,000. Multiply by 5–20 OOS events per year on a 100-tractor fleet with average PM discipline and the annual bleed lands in the mid-six figures — before any CSA impact, insurance renewal effect, or customer relationship consequences. The math justifies the prevention investment easily. The problem is that most fleets don't do the math.
The three OOS types and what triggers eachVehicle, driver, and cargo — different triggers, different remediation, different costs
Not every OOS event is the same. The North American Standard Out-of-Service Criteria (CVSA OOSC, 2026 edition effective April 1) distinguishes vehicle, driver, and cargo-related out-of-service conditions. Each carries different remediation requirements and cost profiles. Book a demo to see defect capture that maps to OOS categories in HVI
Vehicle OOS
Driver OOS
Cargo-related OOS
OOS scope and duration
Different OOS types produce different remediation paths — and different downstream cost patterns. Templates that map to the specific categories catch the specific defects. Book a demo to see category-mapped inspection templates in HVI
Where the cost actually lives — direct vs indirectThe line items most OOS cost analyses undercount
Fleets that track OOS cost usually capture the invoice items (repair parts and labor) and stop there. The larger cost lives in the operational disruption around the invoice. Both need to be measured to price the prevention investment correctly.
The prevention math — where PM investment beats OOS event costSix defect categories that account for the majority of OOS events and how they're caught upstream
Almost every OOS finding is a defect that was catchable in pre-trip walk-around, scheduled PM, or DVIR-triggered work order. The defect wasn't hidden; the discovery process wasn't executed. Prevention math is about connecting the specific OOS categories to specific inspection triggers so the failure mode gets caught upstream. Start a free trial to build inspection templates that map to OOS categories.
Brake condition — visual + air test at pre-trip
~41% of Roadcheck vehicle OOS. Pre-trip air brake test sequence (build-up, cut-out, warning, applied leakage) catches leaks >3 PSI/min. Visual under-vehicle catches loose components. Scheduled PM catches wear thresholds.
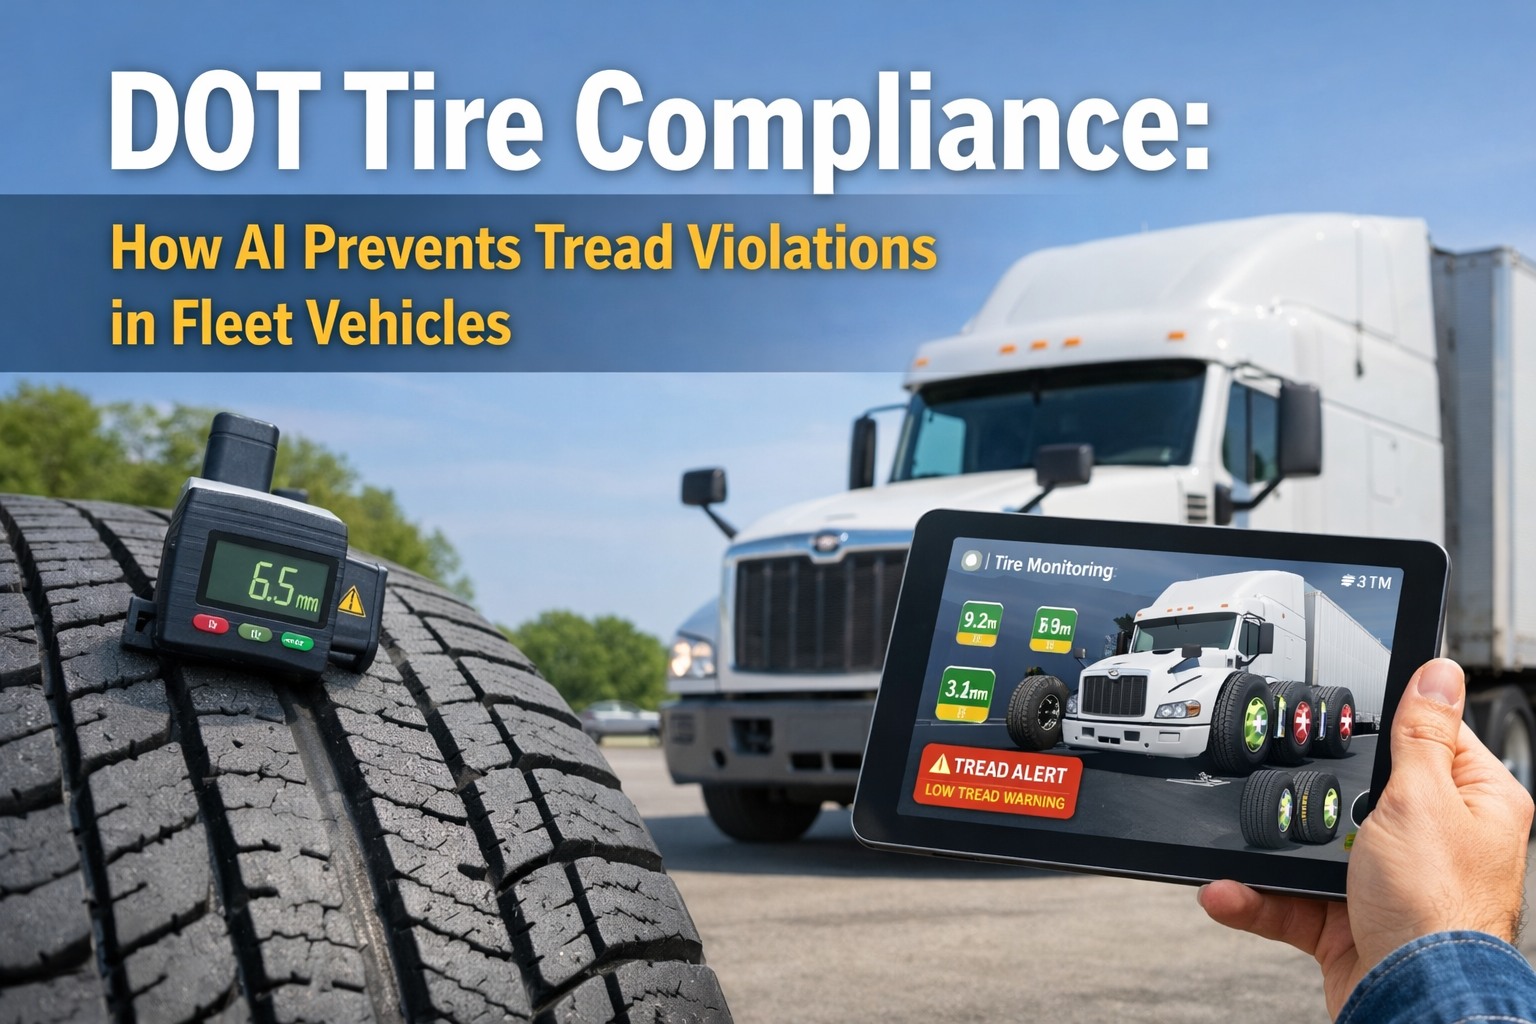
Tire tread + condition — walk-around gauge check
Steer <4/32" and drive/trailer <2/32" both OOS. Gauge check in walk-around catches thresholds. Visual sidewall inspection catches cord exposure and cuts. Air pressure verification catches leaks before flat.
Lights — systematic verification at pre-trip
Every OOS light inspection is a walk-around item. Systematic light check (headlights, tail, brake, turn, marker, reflectors, license plate) with fault flagged for shop repair before dispatch.
Coupling — fifth-wheel visual and tug test
Fifth-wheel not fully engaged is an immediate OOS. Visual jaw-closure check plus gentle tug test at hookup catches disengagement before departure.
Cargo securement — load-specific verification
2026 CVSA focus area. Working load limit check, tie-down count and rating verification, corner protection, load-shift verification post-hookup. Template checks that vary by cargo type prevent generic pass-through.
Driver credential + HOS — automated verification
Medical certificate expiration tracking, license renewal alerts, HOS clock monitoring, ELD data integrity checks. Driver-side OOS is often a records or system failure, not a driver behavior issue.
The pattern is consistent: OOS categories map to specific inspection triggers that catch the defect upstream when the process is actually executed. Book a demo to see defect-to-work-order routing in HVI
From a safety manager on the OOS math after tracking honestly
We used to say we had "a few" OOS events a year on our 78-tractor fleet. When we finally started logging them properly — date, defect category, hours out of service, direct repair, driver pay during detention, rescue tractor when needed, customer detention charges — the number was 34 events in 12 months. Average cost per event tracked honestly was around $8,500. That's roughly $290,000 a year we'd been treating as ambient noise.
Two-thirds of the defects were brake or tire findings that a proper walk-around would have caught. We tightened pre-trip templates, put photo evidence requirements on brake and tire checks, and routed flagged items to shop work orders same-day. OOS events dropped to 11 the following year. That's roughly $195,000 recovered by doing the process we thought we were already doing.
Frequently asked questions
How much does a DOT out-of-service event cost a trucking company?
A single moderate-severity DOT out-of-service event on a Class 8 tractor commonly costs $3,000–$10,000 when direct costs are tracked honestly; extended-scope events with major repair, tow, and load rescue push into the $15,000–$25,000 range. Direct costs include mobile mechanic dispatch ($150–$300 base + $150–$250/hr labor), emergency parts at premium markup, towing or recovery ($500–$3,000+ depending on distance and equipment), enforcement penalty where applicable, and return-to-service verification. Indirect costs typically run 2–5x the direct invoice: lost revenue from a sidelined tractor (6–48+ hours of zero revenue miles), driver detention pay, delivery detention or layover fees, rescue tractor dispatch and load transfer, customer relationship impact, and CSA scoring effect that follows the carrier for 24 months. Individual event cost varies significantly by location, cargo, repair scope, and duration — these figures are illustrative rather than universal benchmarks. Fleets that track only direct repair line items typically underestimate total OOS exposure by 60–80%.
What are the most common causes of a vehicle out-of-service order?
Vehicle out-of-service findings concentrate in a small number of categories. Brake defects produce the largest share — in the 2025 CVSA Roadcheck, brake-system violations accounted for roughly 41% of vehicle OOS findings (24.4% brake system defects plus 16.7% for 20%-defective-brakes on combination vehicles). Specific brake OOS triggers include 20%+ of brakes out of adjustment on combination vehicles, air leak rate over 3 PSI per minute, illuminated ABS malfunction lamp, cracked brake drums, and missing brake shoes. Tire-related OOS produced 2,899 violations — triggers include steer tire tread below 4/32", drive or trailer tread below 2/32", any sidewall damage or exposed cord/belt, flat tire, or air loss over 50%. Lighting produced significant OOS volume — inoperative brake or turn signals, all headlights inoperative, missing reflectors. Additional categories include steering (excessive wheel play, loose components), coupling (fifth wheel not fully engaged, safety latch not locked), and suspension (cracked leaf springs, ruptured air bag). Almost every one of these findings is catchable in pre-trip walk-around or scheduled PM — the defect isn't hidden; the discovery process isn't executed.
What's the difference between vehicle, driver, and cargo out-of-service?
The North American Standard Out-of-Service Criteria (CVSA OOSC, 2026 edition effective April 1, 2026) distinguishes three OOS categories. Vehicle OOS: mechanical defects meeting OOSC thresholds — brakes, tires, lights, steering, coupling, suspension. The truck cannot operate until the defect is corrected and repair verified; driver may continue with a substitute vehicle. Driver OOS: credential or performance issues that disqualify the specific driver — expired or missing CDL, expired medical certificate, HOS violations, ELD tampering or falsification of records of duty status (immediate OOS under 49 CFR Part 395), drug/alcohol violations, unqualified for the CMV class operated. The driver cannot operate any CMV until the condition is corrected; a qualified substitute driver may operate the same vehicle. Cargo-related OOS: load-specific issues — cargo securement failures under 49 CFR 393 (working load limit violations, insufficient tie-downs, load shifting), hazmat placarding/documentation/segregation violations, overweight or oversize operation without permit. The load cannot move as configured; reconfiguration, permits, or load transfer may be required. 2026 CVSA designated cargo securement as the vehicle-side focus area for enforcement emphasis.
Does an out-of-service event affect a carrier's CSA score?
Yes. Roadside inspection violations feed into FMCSA's Safety Measurement System (SMS) and affect the carrier's CSA BASIC scores. Out-of-service violations generally carry higher severity weights than non-OOS findings, and the effect on BASIC scoring persists for approximately 24 months from the inspection date. The specific SMS methodology assigns severity weights (1–10) and time weights based on how recently the violation occurred. Multiple OOS violations within a single inspection can compound the scoring impact. Elevated BASIC scores can trigger FMCSA prioritization for compliance reviews, focused investigations, or additional enforcement action, and are publicly visible to insurance carriers and shippers through SAFER. That said, the specific CSA point impact of any single OOS event varies with the SMS methodology in effect at the time, other violations on the same inspection, and the carrier's exposure baseline — universal "OOS = X points" claims oversimplify the calculation. FMCSA SMS methodology can change; carriers should verify current methodology through the FMCSA Analysis & Information Online portal for specific scoring questions.
Does HVI help reduce out-of-service events?
Yes, at the prevention layer. HVI supports the inspection and maintenance workflows that catch defects upstream of roadside — configurable pre-trip inspection templates covering the specific defect categories that produce most OOS findings (brakes, tires, lights, coupling, suspension, cargo securement), photo documentation with GPS and timestamp on flagged items, defect reporting with severity-based routing including out-of-service severity flags for safety-critical items, maintenance work order generation from flagged defects with parts and labor tracking, repair verification tied to the originating defect record, and searchable multi-year maintenance history per asset. HVI is not a roadside repair service, mobile mechanic dispatch platform, towing broker, insurance carrier, DataQs challenge service, or safety consultant. Roadside response, mechanical repair execution, CSA challenge submissions, and compliance strategy remain with those specialized providers. What HVI provides is the pre-trip and PM discovery workflow that catches the specific defect categories that most commonly become roadside OOS events — brake condition, tire tread, light function, coupling engagement — before the truck leaves the yard.
The $50 brake shoe or the $12,000 roadside event — you pay for one either way
HVI runs the pre-trip and PM inspections that catch OOS defects upstream. A 34-event year becomes an 11-event year. Every defect flagged in the yard is a roadside cascade that never happens.
No credit card · No hardware · Setup in minutes