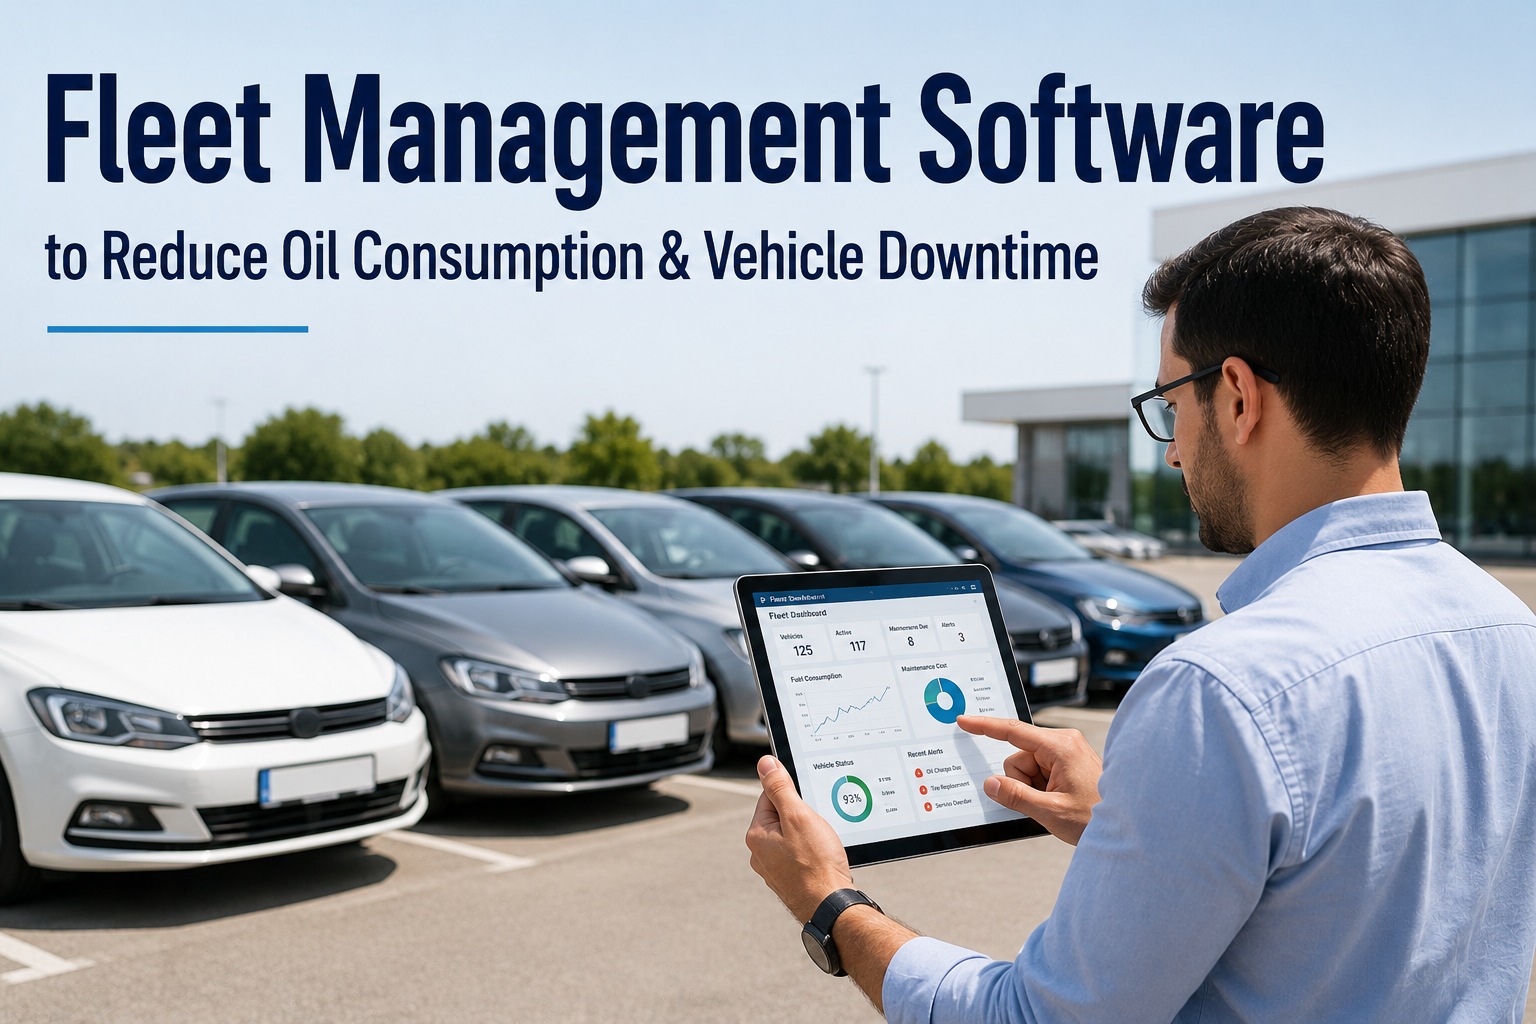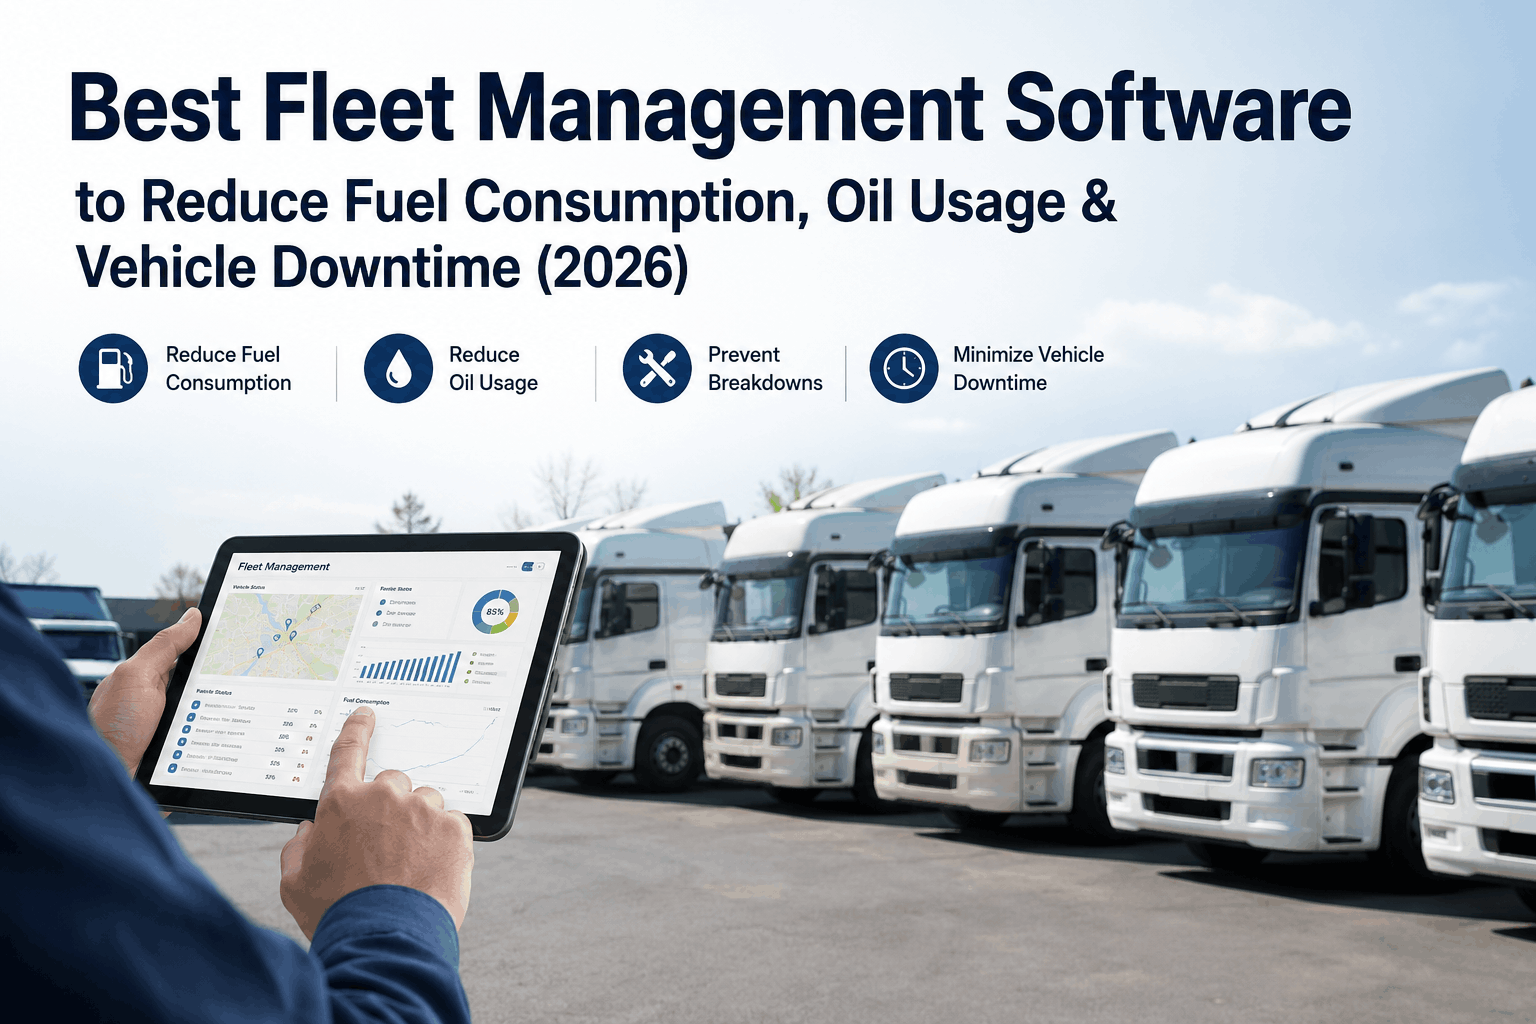
Fleet fuel management software takes the single largest controllable line on a fleet's P&L — diesel running 30% to 40% of operating cost — and turns it from a mystery monthly invoice into a real-time, per-truck, per-driver, per-mile P&L you can actually manage. That matters because the average untracked fleet loses 8% to 15% of its fuel budget to five invisible failure modes: idle burn, over-speed drag, hard acceleration, route inefficiency, and theft or fraud on the fuel card. On a 100-truck fleet spending $4.7M/year on diesel, that's $375,000 to $700,000 quietly disappearing before anyone opens the invoice. This page walks what fleet fuel management software actually does, where the recoverable spend hides, the six capabilities that separate a real solution from a fuel-card portal, and annualized savings by fleet size. Book a demo after you see the dashboard.
Every gallon. Every truck. Every dollar. Live.
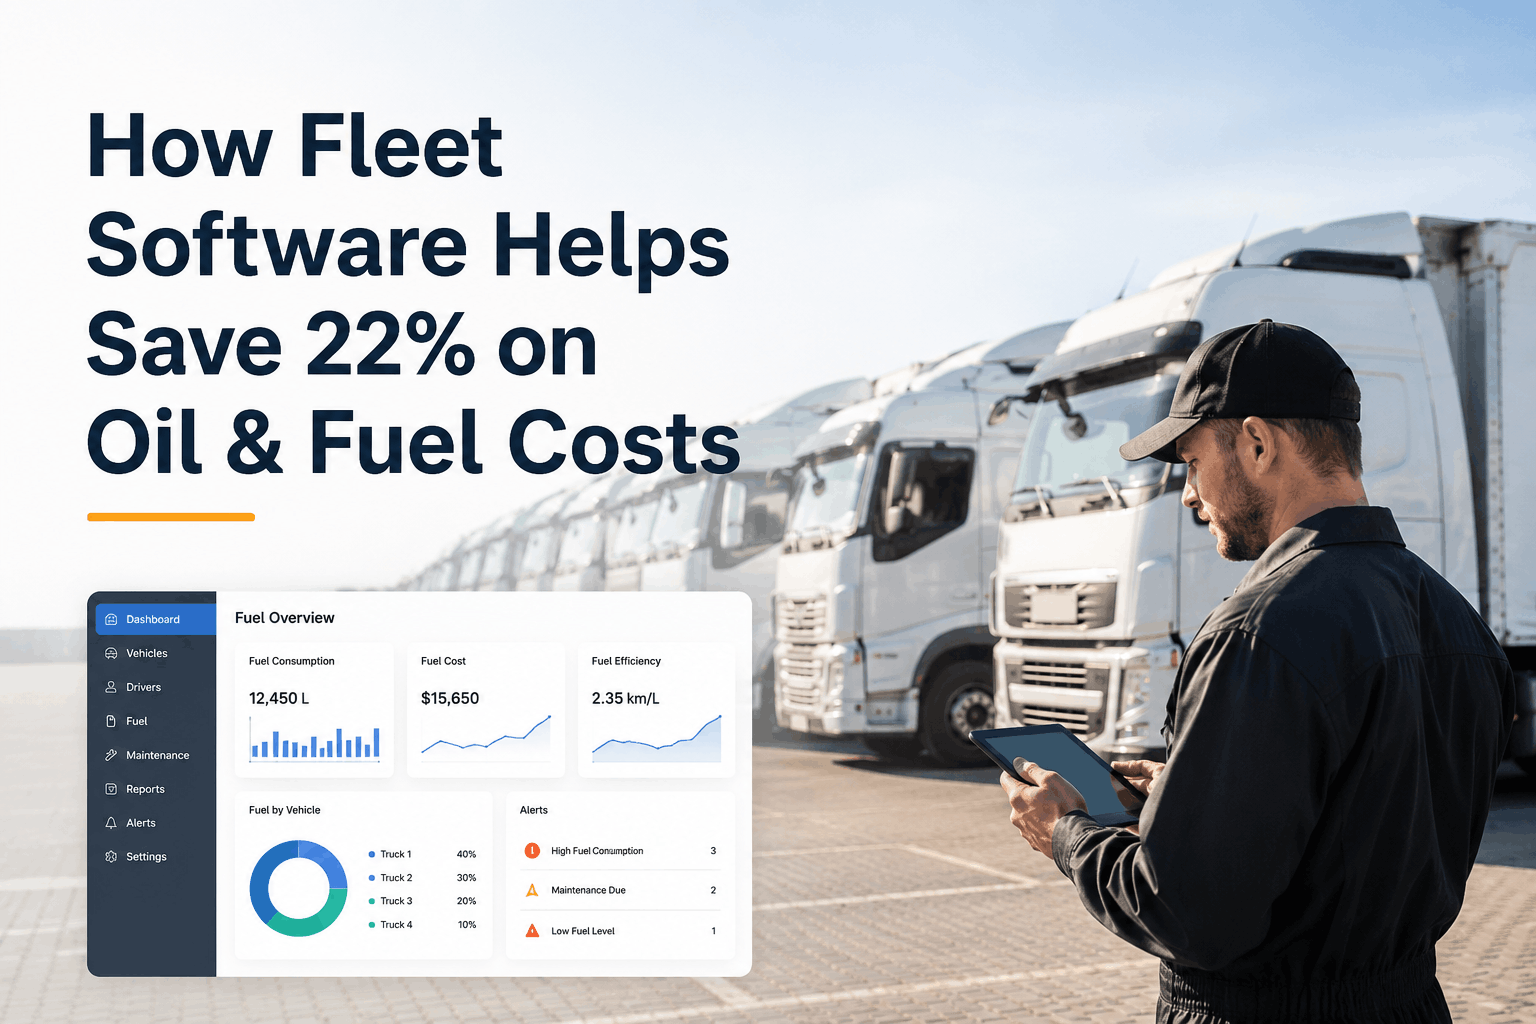
This is what fleet fuel management software actually produces — a real dashboard, not a monthly PDF, tracking the entire fuel bill down to the driver and the mile.
Every tile on that dashboard is a live dollar figure. The software's job isn't to look impressive — it's to make the losses visible one at a time so a fleet manager can act on them the same week they surface. Below is where each dollar of fleet fuel actually goes, the six things good fleet fuel management software does with that data, the four loss categories it surfaces, and the annualized savings by fleet size.
Where every dollar of fleet fuel actually goes
Before software, most fleet managers see a monthly fuel invoice with a total, a per-gallon average, and maybe a per-truck breakdown if they're on a good fuel card. That's not visibility — that's a receipt. Fleet fuel management software rebuilds that invoice into a full breakdown of where every dollar landed and which slices are recoverable. Here's what the rebuilt invoice looks like on a mid-sized fleet.
The $20,940 of monthly recoverable spend on this 47-truck example isn't magic — it's just five categories of loss that the fuel card invoice, by itself, doesn't distinguish from productive fuel. The recovery percentages are conservative and drawn from industry norms; well-run programs hit the upper end. Book a demo to see your own rebuilt invoice
6 things fleet fuel management software actually does
Not everything called "fuel management" is the same product. Most legacy tools stop at pulling fuel card statements into a portal. Modern fleet fuel management software does six specific things a portal doesn't, and each one plugs a different loss category on the rebuilt invoice above.
Fuel card integration & fraud detection
Pulls every fuel card transaction with time, location, gallons, and price. Flags off-route purchases, tank-overfill anomalies, off-hours swipes, and same-card multi-location activity within minutes of the transaction.
GPS-matched fuel purchases
Cross-checks every fuel card transaction against the truck's actual GPS location and timestamp. A truck in Ohio can't buy diesel in Texas — and that mismatch surfaces automatically the same day.
Real-time consumption & tank monitoring
Streams ECM data continuously: fuel level, injector duty cycle, DEF consumption, idle status. Catches leaks, siphoning, and sensor drift before a driver files the next fuel log.
Per-truck, per-driver MPG trending
Normalizes MPG for route, load, terrain, and weather so a Class 8 highway driver and a local P&D driver are graded against their own duty-cycle benchmark, not each other.
Cost-per-mile analytics
The KPI CFOs actually track. Cost per mile trended per truck, per lane, per driver, per week — with clean drill-down so an unexpected spike traces back to the cause in one click.
IFTA & regulatory reporting
Same GPS mileage + fuel purchase data that surfaces waste also generates IFTA quarterly returns automatically. What was a 12-hour Excel scramble becomes a 15-minute one-click export.
These six are the working parts. Cut any one of them and the invoice above stays partly opaque — a fuel card portal without GPS matching catches almost no theft, and consumption monitoring without MPG normalization can't tell a bad driver from a bad route. Start free and see all six live on your fleet
The 4 fuel loss categories fleet fuel management software catches
Every recoverable dollar on a fleet's fuel invoice sits inside one of four loss categories. The pattern below shows what each looks like on the invoice, exactly how the software surfaces it, and the recovery percentage typical fleets see once they can see it.
Idle burn
Recover 60–80%Invoice signature: $0.80–$1.50/hr per truck of engine-on-wheels-not-turning — adds up to $15,000–$40,000/year per truck at typical idle rates.
How software catches it: ECM idle flag streamed continuously, auto-tallied by driver, truck, location, and time of day. Idle policy exceptions (HVAC, PTO, DPF regen) tracked separately.
Fuel theft & fuel-card fraud
Recover 90%+Invoice signature: skimming, unauthorized swipes, tank-overfill purchases, off-route buys, phantom transactions. Industry estimates put commercial fuel theft in the tens of billions of dollars globally per year.
How software catches it: fuel card transaction cross-checked against GPS location and tank capacity. Truck in Ohio can't buy diesel in Texas — the mismatch fires an alert within minutes.
Over-speed drag
Recover 40–60%Invoice signature: aerodynamic drag adds 1% to 2% fuel burn per mph over 65 mph on Class 8. A driver running 75 mph consistently costs the fleet 10%+ MPG vs a 65 mph baseline.
How software catches it: GPS speed benchmarked against posted route limits and internal thresholds. Per-driver over-speed minutes visible on the weekly scorecard.
Route inefficiency & behavior
Recover 30–50%Invoice signature: avoidable miles, backtracking, poor dispatch decisions, and hard-acceleration events that dump fuel without productive output. Small individually, big collectively.
How software catches it: route-vs-optimal comparison plus per-driver hard-acceleration event counts, normalized per 100 miles. Cost impact tallied against the fleet-average benchmark.
All four categories share one property: they're invisible on a plain fuel card statement. Once the software adds GPS, ECM, and route data on top of the transaction feed, every one becomes a specific alert with a specific dollar figure and a specific person to coach. Book a demo to see the four loss categories tracked live
Fleet fuel savings by fleet size
The economics of fleet fuel management software scale linearly with fleet size — roughly the same per-truck savings, roughly the same payback period. What changes is the absolute dollar impact, which for larger fleets moves from a nice line item into a material P&L event. Here's what typical mid-run fleets see across three fleet sizes at 80,000 miles per truck per year and current diesel prices.
Payback compresses as fleet size grows because software cost per truck stays roughly flat while the absolute recovery pool grows in step with fuel spend. Even at the small end, a 25-truck fleet typically recovers 10x the software cost inside the first year. Book a demo to see the model with your own fleet size and diesel spend — or start free and get your own estimate on day one .
From an operations director who switched from a fuel-card portal
We ran on a fuel card portal for 6 years and thought we had fuel management. We didn't. We had a spreadsheet of receipts. When we brought in real software, the first thing it caught was one driver expensing $180 a week in premium fuel we didn't own. Second thing: our idle rate was 28%, not the 12% our yard foreman had guessed.
Six months in, our cost per mile dropped from $0.71 to $0.63 across 62 trucks. That's about $440,000 a year in fuel we were quietly losing. IFTA now takes 20 minutes instead of two days. I don't know how we ran without it.
Frequently asked questions
What is fleet fuel management software?
Fleet fuel management software is a cloud-based platform that combines fuel card transaction data, GPS telematics, and engine ECM data to give fleet operators a real-time, per-truck, per-driver, per-mile view of their fuel spend. It replaces the traditional monthly fuel card statement — a lump-sum receipt that reveals almost nothing about where the money went — with a live dashboard that breaks total spend into productive fuel, idle burn, over-speed drag, route inefficiency, hard-acceleration waste, and theft or fraud. The software also cross-checks every fuel card transaction against the truck's actual GPS location to catch off-route buys and unauthorized purchases, streams real-time consumption to spot leaks or siphoning, normalizes MPG per driver and per route for fair benchmarking, tallies cost-per-mile as the executive KPI, and auto-generates IFTA quarterly returns from the same data set. The typical outcome is 8% to 15% reduction in total fuel cost within the first six months, plus significant time savings on fuel reconciliation and regulatory filings.
How does fleet fuel management software actually reduce fuel costs?
Fleet fuel management software reduces fuel costs by making previously invisible losses visible enough to act on. The five biggest recoverable categories are idle burn (typically 60% to 80% recoverable once tracked and coached), fuel theft or fuel-card fraud (90%+ of fraudulent transactions get flagged once GPS-to-transaction cross-check is running), over-speed drag (40% to 60% recoverable through driver visibility and gentle coaching), hard-acceleration events (60%+ recoverable via scorecard feedback), and route inefficiency (30% to 50% recoverable via route-vs-optimal analysis). Individually each category might feel small; combined, they typically represent 8% to 15% of total fuel spend on an untracked fleet, which on a 100-truck operation running $4.7M/year in diesel translates to $375,000 to $710,000 in annual recoverable savings. The software's role is measurement and surfacing; the actual savings come from the workflow it enables — weekly driver coaching, daily fraud alerts, monthly cost-per-mile reviews, and the culture change that follows when every driver knows they're measured.
How does fuel management software detect fuel theft and fraud?
Detection works through cross-referencing three independent data streams that no single tool sees together: fuel card transactions (time, location, amount, gallons), GPS telematics (truck location and speed second-by-second), and ECM data (tank fuel level, engine on/off, ignition status). When a fuel card is swiped, the software checks in real time whether the truck was actually at that pump location, whether the ignition was on, whether the tank could physically accept the gallons purchased (a 100-gallon tank at 40% cannot buy 90 gallons without overflow), whether the driver was scheduled to be on shift, and whether any other cards from the same driver or truck were used at other locations in the same window. Anomalies trigger alerts within minutes and get queued for review, not blocked outright — legitimate exceptions still exist. Typical fleets that switch on this cross-check surface between 0.5% and 2% of monthly fuel spend as fraudulent or unauthorized within the first 30 days, most of which was previously mixed indistinguishably into the general fuel budget.
What integrations should good fleet fuel management software have?
A credible fleet fuel management platform integrates natively with three categories of external system. First, fuel cards: WEX, Comdata, EFS, US Bank Voyager, Fuelman, and Shell Fleet at minimum, with automatic transaction sync (not manual CSV imports). Second, telematics: GPS and ECM data from Geotab, Samsara, Motive, Verizon Connect, Fleet Complete, and OEM systems (Detroit Connect, Kenworth TruckTech, Volvo Dynafleet). ECM data specifically matters because that's the source for idle time, fuel level, and consumption — not just GPS position. Third, accounting and ERP: QuickBooks, NetSuite, SAP, Sage, so fuel spend flows automatically into the general ledger with proper per-truck cost allocation. On top of these, IFTA jurisdictional data feeds are essential for automated quarterly filings. If a fuel management tool requires manual data entry, monthly CSV uploads, or hand-mapped account codes to talk to the fuel card or telematics provider, it's not automating the workflow — it's just moving the manual work into a nicer interface.
Is fleet fuel management software worth it for smaller fleets under 50 vehicles?
Yes, though the math looks slightly different. A 25-truck fleet spending roughly $1.2M/year on diesel typically recovers $95,000 to $180,000 annually through fuel management software — 8% to 15% of spend, same range as larger fleets. Payback is 60 to 90 days on typical SaaS pricing of $25 to $45 per vehicle per month. What smaller fleets often miss is that the labor savings can matter more than the fuel savings: replacing 8 to 15 hours of quarterly IFTA prep, monthly fuel reconciliation, and manual receipt tracking with automated workflows frees a compliance manager or operations lead for higher-value work, which on a small fleet is often the constraint. The one honest caveat: fleets under 15 vehicles sometimes find the per-truck cost math tighter, especially if their existing fuel card portal already handles basic reporting. Above 20 vehicles, the ROI is essentially guaranteed by the size of the recoverable-loss pool alone, and most fleets in the 25-to-500 truck range are the core market for good reason.
Turn your fuel bill into a metric you actually manage — inside 60 days
HVI captures every gallon, cross-checks every transaction, streams real-time consumption, normalizes MPG per driver, tallies cost per mile for the CFO, and auto-generates IFTA quarterly returns from the same data set. Live in under two weeks — and the first month's recoverable spend typically covers the annual software cost.
No credit card · No hardware · Dashboard ready day one