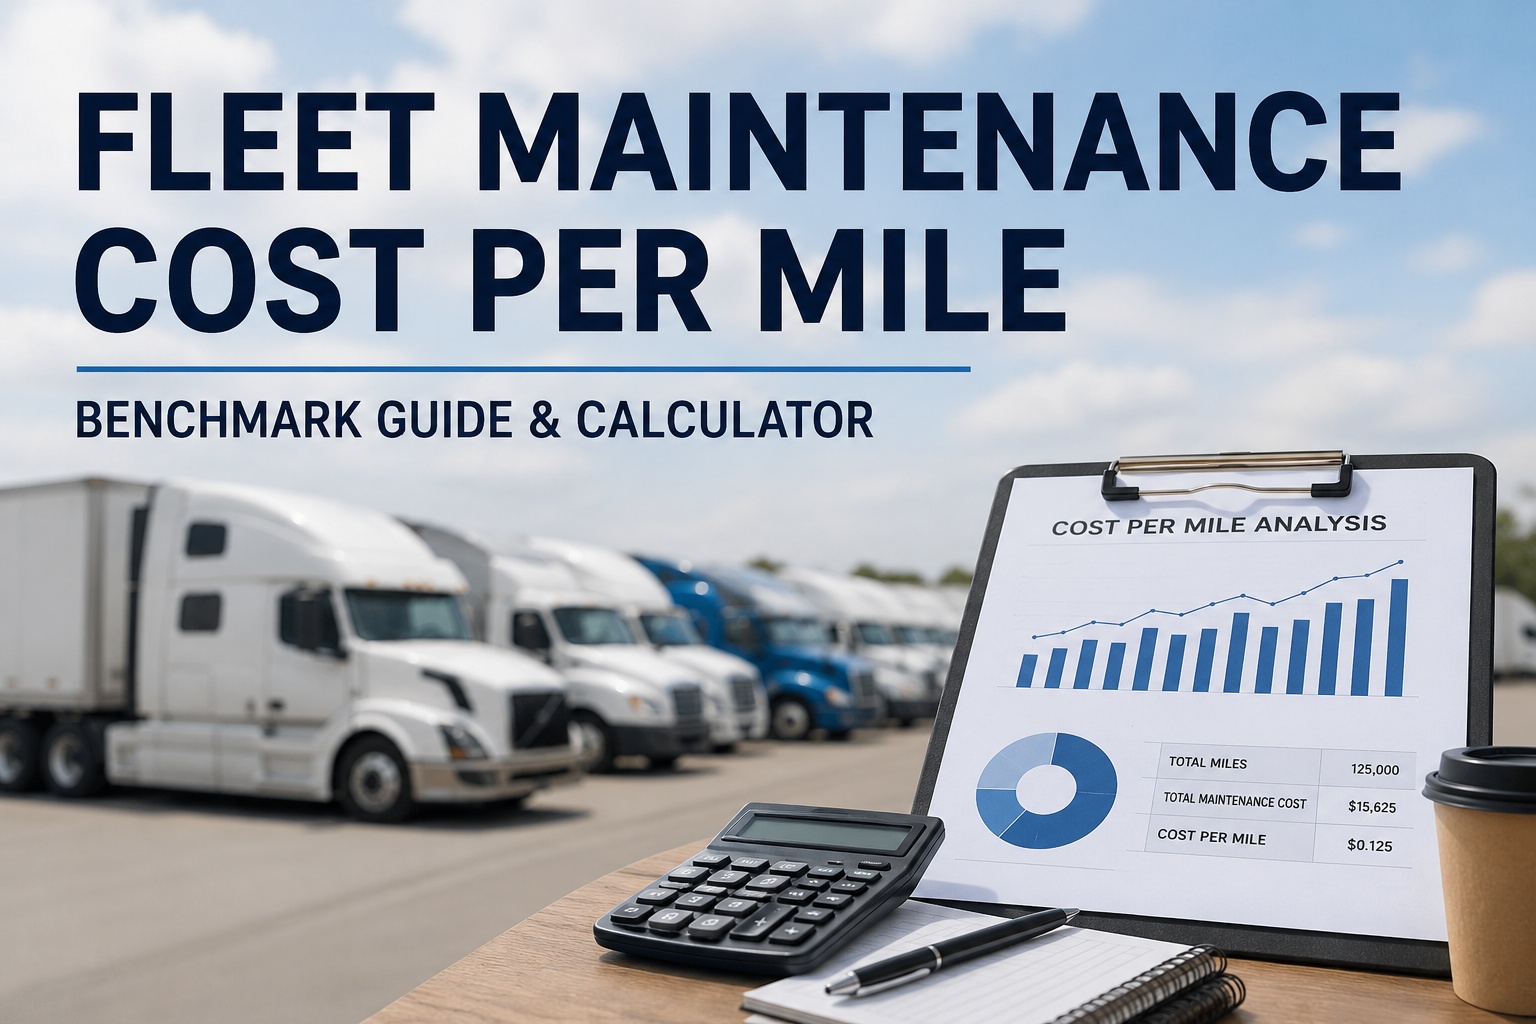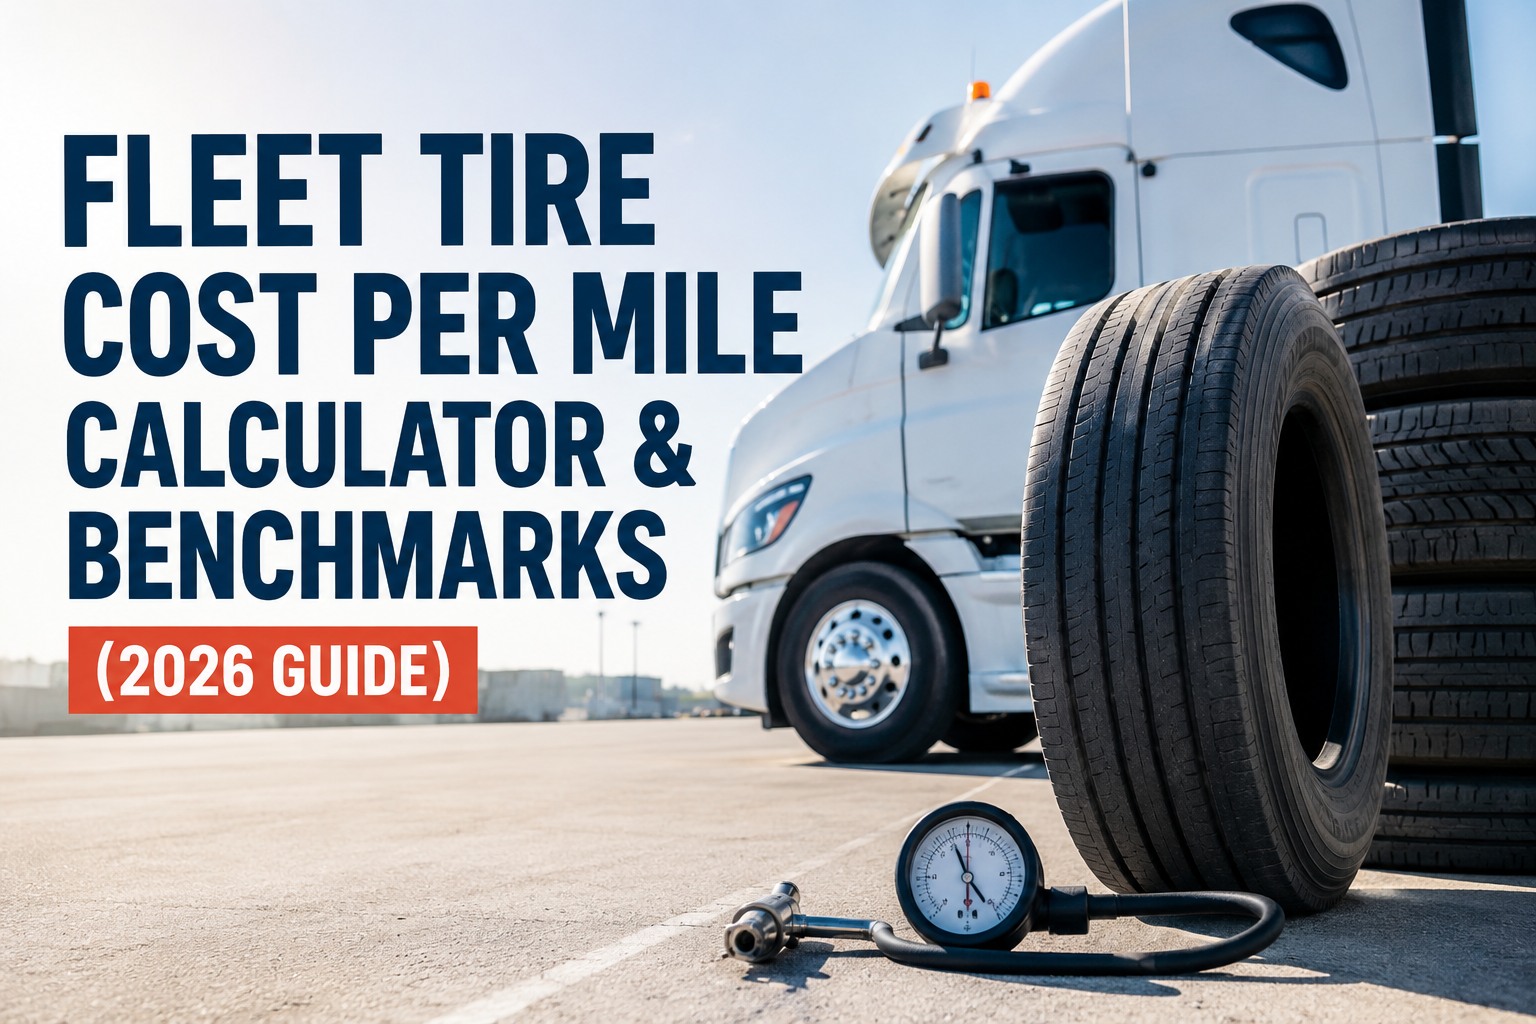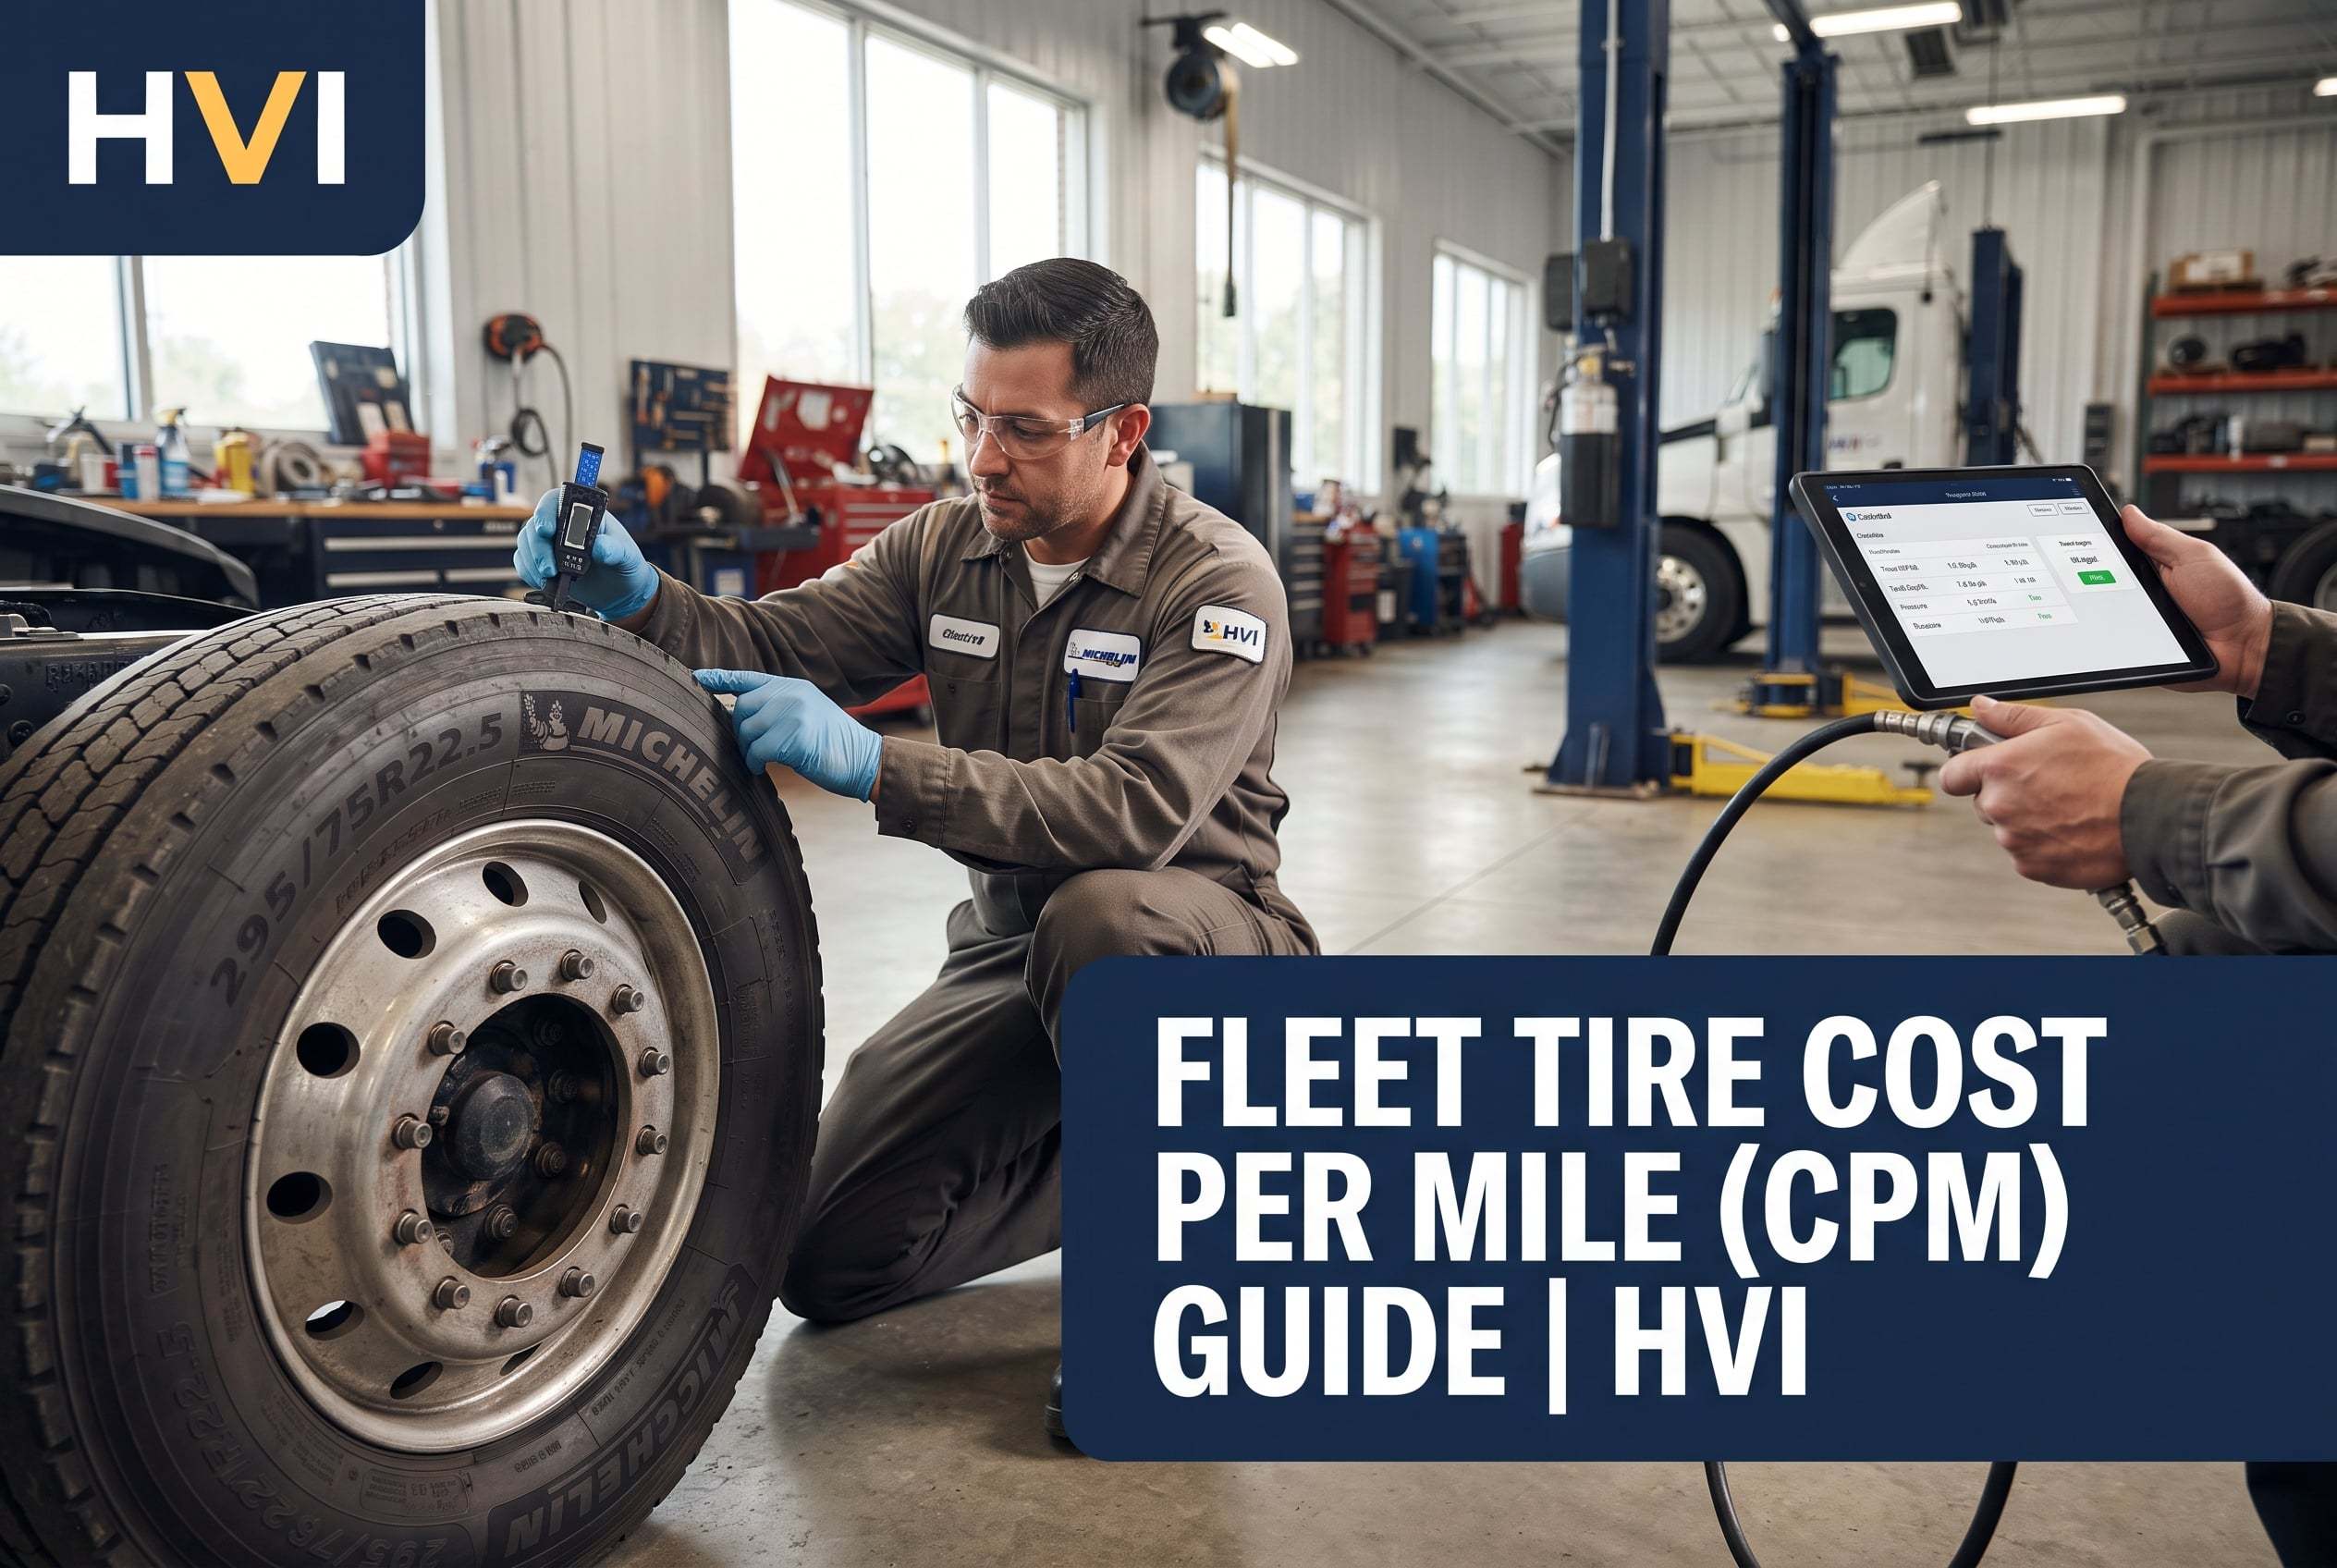
Tire cost per mile (CPM) is the KPI that turns a tire spend line item into a decision-making tool. The formula itself is trivial: total tire cost divided by total miles. What separates fleets that use it well from fleets that don't is what goes into the numerator, how consistently the data gets tracked, and what decisions get made off it. A fleet running 4 cents per mile on tires and a fleet running 6 cents per mile are the same size, same routes, and same equipment on paper — and the 6-cent fleet is bleeding $200,000 a year more than the 4-cent one. That's the entire game. This fleet tire cost per mile guide walks the formula, the data you need, the five biggest levers that move it, and a worked brand-comparison worksheet you can copy for your own analysis. Book a demo to see tire CPM calculated automatically from DVIR data.
The Fleet Tire Cost Per Mile Guide
One formula, four cost components, five levers. Here's how to calculate tire CPM correctly, benchmark against your industry, and use the number to justify the tire program to your CFO.
Tires are the third or fourth largest cost-per-mile line item on almost every commercial fleet's P&L, behind fuel and driver wages and often neck-and-neck with maintenance labor. ATRI and NPTC industry data puts the average tire CPM in the 4-to-5 cents range across long-haul operations, with real-world spreads from 3 cents on best-in-class programs to over 7 cents on undermanaged ones. On a 100-truck fleet running 100,000 miles per truck per year, one cent per mile is $100,000 annually. Small numbers, big money.
What "good" tire CPM actually looks like
Before you can improve a number, you have to know what target you're chasing. Here are the benchmarks that matter, drawn from ATRI operational cost data and NPTC benchmarking reports.
- 4–5¢ Industry average tire CPM — long-haul operations, per ATRI/NPTC
- 3¢ Best-in-class tire CPM — retread-heavy programs with strict inflation discipline
- 7¢+ Undermanaged fleet tire CPM — no retreads, no pressure discipline, cheap tires
- 25–40% Total tire cost gap between good and great fleet management
The gap between the 3-cent fleet and the 7-cent fleet on 100 trucks and 100,000 miles per year is $400,000 in annual tire spend. Same trucks, same drivers, same routes. The difference is what data gets collected and what decisions get made off it. Book a demo — see tire CPM calculated from your DVIR data
The 4 components of the CPM numerator
Most fleets get the CPM formula wrong because they only count the tire purchase cost. Total tire cost is bigger than that — and honestly counting it is what makes the number useful. Here are the four line items every accurate CPM calculation includes.
Tire purchase cost
New tires plus any casing purchases. The largest component for most fleets but not the only one. Track by position (steer/drive/trailer) because CPM by position tells a different story than fleet-wide.
Retread cost
Retread purchases at $150-$250 per unit versus $400-$600+ new. Every retread you get on a casing lowers the effective CPM for that position. Track retread generation count — it's the biggest lever.
Service & labor
Mounting, balancing, rotation, alignment, and dismount labor. Roughly $50-$75 per tire at shop rates, more for mobile service. A frequently overlooked component that flatters the number when omitted.
Road calls & downtime
Tire-related roadside failures average $500-$1,000 per event. Load delays, driver overtime, and customer penalties compound it. This is the line item that separates fleets that "count tires" from fleets that "count total tire cost."
Add up all four across the last 12 months. Divide by total fleet miles for the same period. That's your true tire CPM — and it's usually 15-25% higher than the number most fleet managers quote from memory. Start free and get all four line items tracked automatically
The 5 biggest levers that move tire CPM
Every controllable factor that improves tire CPM falls into one of these five levers. Ranked here by realistic impact when applied consistently across a fleet. If you only work on one, work on the first.
Inflation discipline
up to 20% CPMThe single largest lever. Every 1 PSI drop reduces fuel economy by 0.3% (U.S. DOE) and accelerates tread wear. Chronic 10% underinflation cuts tire life roughly 25% and destroys retread eligibility from the inside out via belt separation. Daily calibrated-gauge check on every tire is worth more than any tire selection decision.
Casing preservation & retreads
up to 15% CPMRetreads at 30-50% of new tire cost, applied across drive and trailer positions, cut effective per-position cost meaningfully. But only if casings survive to second and third retread — which loops back to inflation, sidewall protection, and pull-point discipline. Track retread generation per casing.
Alignment & suspension
up to 10% CPMA steer axle 1/16″ out of toe drags each tire sideways roughly 7 feet per mile driven. Over 100,000 miles that's 132 miles of pure scrubbing, enough to destroy a $500 steer tire in half its expected life. A $200 alignment prevents $250+ in premature replacement plus the fuel from rolling resistance.
Tire selection by CPM, not by price
up to 10% CPMThe cheapest tire is rarely the lowest-CPM tire. A premium tire/retread combo can deliver up to 5× the mileage of a low-cost single-life tire. Compare on actual mileage-to-pull and retread success rate, not sticker price. This is where data-driven purchasing beats intuition consistently.
Pull-point discipline
up to 8% CPMStandard pull points: 4/32″ steers, 2-4/32″ drive and trailer. Running to legal DOT minimum (2/32″ steer, 1/32″ other) leaves no buffer for retread and often kills the casing. Pull with tread to spare; you capture the retread value on the way out.
Nobody works all five perfectly. The improvement is in stacking three or four consistently across the fleet. That's what turns a 5.5-cent fleet into a 4-cent fleet — and does it without changing which trucks you run or which routes you serve. Book a demo to see all 5 levers tracked on one dashboard
The brand comparison worksheet — why cheap tires often lose
The most common tire purchasing mistake is buying on sticker price without running the CPM math. Here is what a real head-to-head comparison looks like — two brands, same position, same fleet, the numbers that decide it.
- Purchase cost$320
- Mileage to pull90,000 mi
- Retreadable?No
- Road calls/100K mi0.4
- Purchase cost$540 + 2 × $220
- Mileage to scrap360,000 mi
- Retreadable?2× yes
- Road calls/100K mi0.15
Same position, same duty cycle. Brand B costs 68% more upfront and delivers 33% lower CPM. Over 360,000 miles that's a $54 saving per position — $540 per truck.
Run this worksheet on your own tire purchase history and the result almost always favors the premium/retreadable combination on drive and trailer positions. The upfront price is only one input. Miles to pull, retread eligibility, and road-call rate together are what determine actual cost per mile. Start free and get the comparison built from your own data
What CPM data actually changes in daily decisions
The number on a dashboard doesn't matter if it doesn't change what you do. Here is what fleets actually do differently when they track tire CPM correctly and consistently.
-
Which brand goes on which position Trailer position tolerates cheaper tires; steer position doesn't. Data by position turns "we buy Brand X" into "we buy Brand X on trailer, Brand Y on drive, Brand Z on steer."
-
When to pull for retread vs. run to failure CPM math shows that pulling at 4/32″ captures the retread value; running to 1/32″ loses the casing. The pull point becomes a hard rule, not a driver preference.
-
Which retreader is actually delivering Track CPM by retreader over 12 months. The cheap one with a 30% rejection rate often costs more than the premium one with a 15% rejection rate. Only data shows it.
-
Whether TPMS pays back TPMS costs $150-$300 per truck. It pays back if it drops CPM by 0.5 cents on long-haul operations. Actual dashboard data answers that in three months.
-
Which trucks are outliers — and why CPM by unit surfaces the truck that costs 60% more in tires than fleet average. Almost always alignment, suspension, or a specific driver. The number leads to the root cause.
None of these decisions are possible without the CPM number, and none of them get made confidently without a full year of consistent data. That is the entire case for tracking. See what a year of CPM tracking looks like on a fleet dashboard
From a fleet operations director who ran the math
We thought we were running 4.5 cents per mile on tires. Then I ran the actual math and found we hadn't been counting road calls, dismount labor, or the retreads we bought for a couple of specific units. Real number was 5.3.
Once I had that on a dashboard, the decisions changed fast. We consolidated to two brands per position, tightened pull points, put pressure logging on every DVIR. Six months in we were at 4.7. Twelve months in we were at 4.1. Same fleet, same lanes. That's roughly $85,000 a year on our 47 trucks — and every dollar of it lives in the CPM number.
Frequently asked questions
How do you calculate tire cost per mile for a fleet?
Tire cost per mile equals total tire cost divided by total miles driven, over the same time period. The formula is simple; the data collection is what most fleets get wrong. Total tire cost has four components: tire purchase cost (new tires plus casing purchases), retread cost across every position, service and labor (mounting, balancing, rotation, alignment, dismount), and road-call and downtime costs from tire-related failures. Total miles is the actual mileage driven by the fleet units the tire cost is being calculated against. Take a rolling 12-month window to smooth out purchase timing spikes. For a fleet running 100 trucks at 100,000 miles per truck per year with a total tire cost of $460,000, that's $460,000 divided by 10 million miles, or $0.046 per mile. The math is trivial; getting the four cost components complete and the mileage accurate is where the discipline lives. Most fleet managers who calculate CPM from memory land 15-25% below the accurate number because they under-count service labor and road calls.
What is a good tire cost per mile for a commercial fleet?
Industry average tire CPM sits in the 4-to-5 cent range for long-haul operations, based on ATRI and NPTC operational cost benchmarking data. Best-in-class fleets — those running strict inflation discipline, aggressive retread programs, and data-driven brand selection — consistently deliver 3 cents per mile or slightly below. Undermanaged fleets running no retreads, minimal pressure discipline, and cheap tires typically land at 7 cents per mile or higher. The gap between the two extremes is real money: on a 100-truck fleet running 100,000 miles per truck per year, four cents difference equals $400,000 in annual tire spend. Vocational and off-highway operations have higher averages because of harsh duty cycles; regional less-than-truckload and dedicated lanes often achieve better numbers than long-haul because tire life is more predictable. The right benchmark for your fleet is your operation's own trend over 12-24 months, not a single industry average — the trend tells you whether your decisions are working, which the average number never can.
What data do you need to track tire CPM accurately?
Five categories of data feed accurate tire CPM. First, tire purchase records: each tire's brand, model, position, purchase cost, date, and DOT date code. Second, retread history per casing: which casings were retreaded, when, by which retreader, at what cost, and whether the retread passed subsequent inspection. Third, service and labor logs: every mount, balance, rotation, alignment, and dismount tied to a specific tire and vehicle. Fourth, road-call records: date, vehicle, tire position, cause, direct cost, and load-delay cost if applicable. Fifth, mileage per unit: odometer readings at consistent intervals so mileage windows match the cost windows exactly. Manual spreadsheet tracking works but tends to become inconsistent past 20-30 vehicles because each data point requires a human entry at the right moment. Digital inspection platforms integrated with maintenance work orders and purchase records automate this by capturing every event as it happens — the CPM number then updates continuously without a monthly reconciliation exercise, and the trend by brand and position becomes visible instead of theoretical.
Why is cheaper tire often more expensive per mile?
Because CPM is a function of total cost divided by total miles, and cheap tires typically lose on both variables. On the total-cost side: cheap tires often can't be retreaded, so the fleet loses the 30-50% savings that a second and third life provide on premium casings. Cheap tires also generate more road calls per 100,000 miles because they use lower-quality compounds and less-robust casing construction, and each road call adds $500-$1,000 in direct cost plus load-delay penalties. On the miles side: cheap tires typically deliver 40-60% of the mileage of a premium tire before pull point, and the premium tire's second and third retread lives extend the effective mileage further. Multiply through: a $320 cheap tire delivering 90,000 miles has a per-position CPM of $0.045; a $540 premium tire with two $220 retreads delivering 360,000 total miles has a per-position CPM of $0.030. The premium tire costs 68% more upfront and delivers 33% lower CPM. Running the math for your own fleet almost always favors the premium/retreadable combination on drive and trailer positions.
How does inflation pressure affect tire cost per mile?
Pressure is the single largest lever on tire CPM. Two effects compound. First, fuel: the U.S. Department of Energy estimates every 1 PSI drop in tire pressure reduces fuel economy by 0.3%. Across a fleet running 10 PSI chronically underinflated, that's roughly 3% wasted fuel — real money on any operation and disproportionately painful on long-haul. Second, tire life: chronic 10-20% underinflation cuts tread life by roughly 25% and destroys retread eligibility because internal heat separates the belt structure from the casing. So one habit — daily calibrated-gauge pressure checks on every tire — moves both fuel CPM and tire CPM in the correct direction simultaneously. It's the highest-leverage single change a fleet can make, and it costs nothing more than the discipline of doing it consistently. Fleets that add TPMS (tire pressure monitoring systems) at $150-$300 per truck typically justify the cost inside 12 months on the fuel savings alone, with the tire CPM improvement as pure additional return.
Calculate tire CPM from DVIR data — automatically
HVI turns tire inspection into a data-generating asset workflow: tread depth logged, pressure captured, retread generations counted, road-call events tied to specific tires, and CPM calculated by brand, position, and retreader in real time. The number you needed to justify the tire program is already there when the DVIR closes.
No credit card · No hardware · CPM tracking on every DVIR