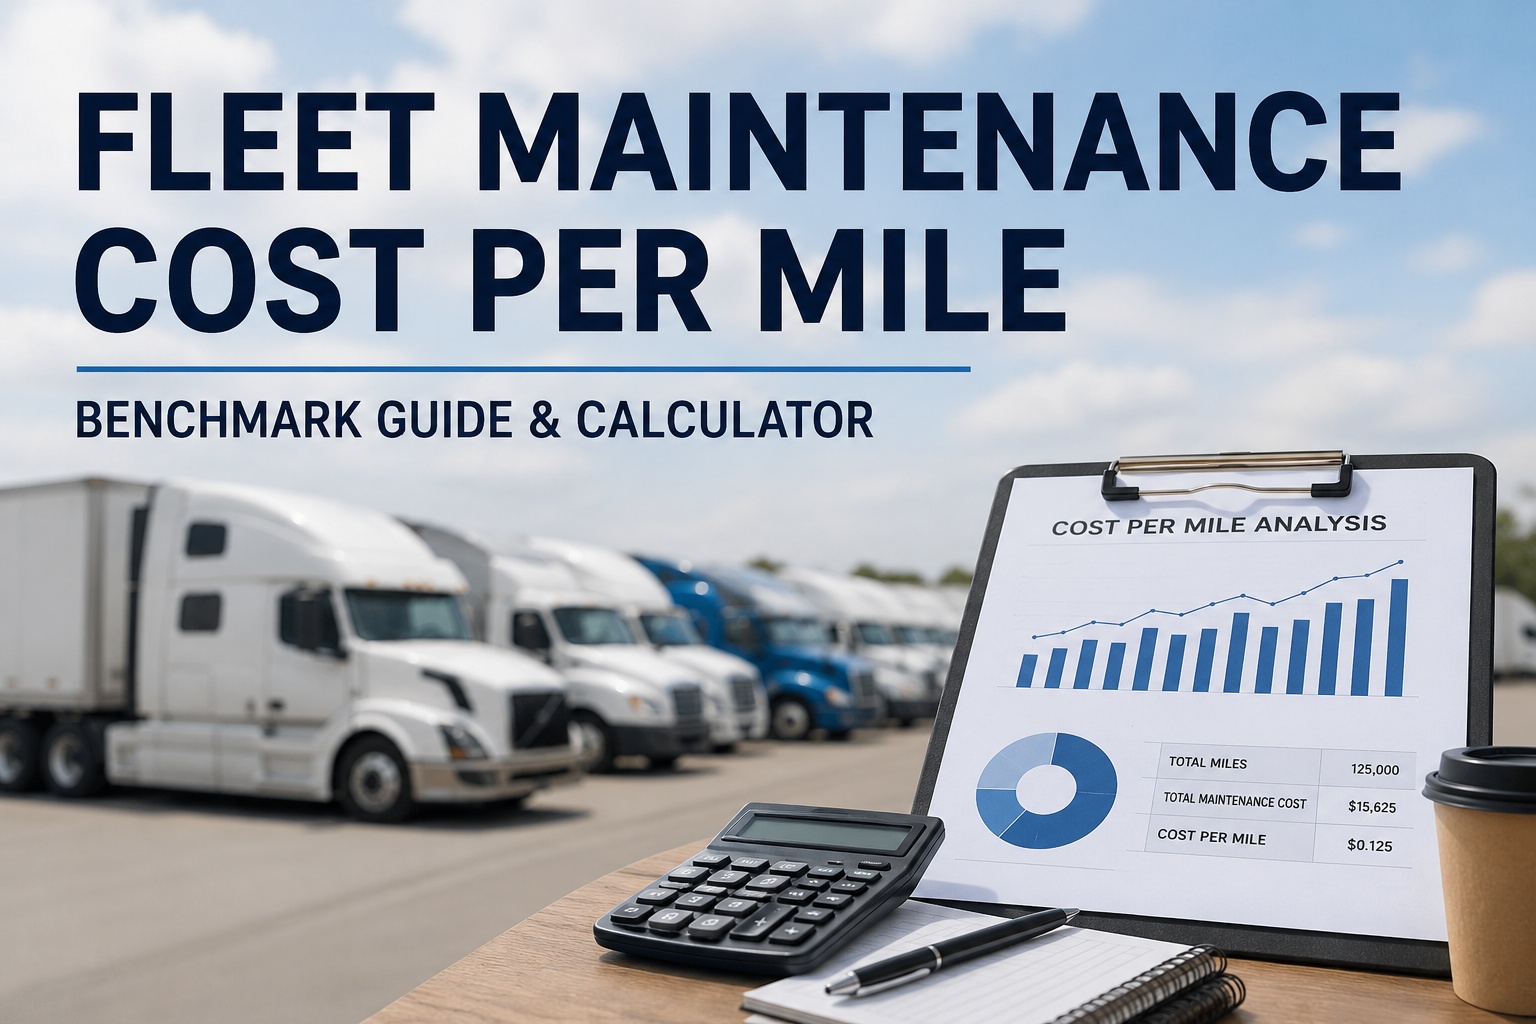
Fleet tire cost per mile (CPM) is the single most important tire management KPI on a commercial fleet — and one of the most miscalculated. The industry benchmark for a Class 8 tractor-trailer in 2026 runs $0.025 to $0.035 per mile in total tire costs, but well-managed fleets consistently hit $0.020 or lower while under-managed fleets often exceed $0.045. The 2.5-cent-per-mile gap between best and worst-in-class translates to $22,500 per truck per year at 100,000 annual miles — real money hiding in a metric most fleet managers don't systematically track. This 2026 fleet tire cost per mile guide walks the standard CPM formula with a worked example, the 2026 industry benchmarks by fleet type and axle position, the five cost drivers that move the number, and the five mistakes fleets make when calculating their CPM. Book a demo after you see how automated CPM tracking runs on the HVI dashboard.
Fleet Tire Cost Per Mile Formula
Four inputs, one denominator, one number that governs your entire tire budget. Here's how it's built and what a real calculation looks like.
The formula and example above are the math. Below is the context: where the industry averages sit in 2026, how your CPM compares by position, the five cost drivers moving the number, and the five recurring mistakes fleets make when calculating their CPM.
2026 fleet tire cost per mile benchmarks by fleet type
Not every fleet operates at the same CPM — and shouldn't be measured against the same benchmark. Duty cycle, load, terrain, and route type all drive the number. Below are 2026 benchmarks by fleet type, so you can compare your fleet against the right peer group.
Class 8 tractor-trailer running interstate at moderate loads on highway surface. Longest tire life of any duty cycle — the benchmark other fleet types are measured against.
Regional distribution running 300–500 mile routes with frequent stops and mixed urban/highway surface. Tire wear rate typically 15–20% higher than long-haul benchmark.
Construction, refuse, or heavy vocational duty. Off-road exposure, sidewall scrub, and heavy loads produce CPM roughly 50–80% above long-haul benchmark. Different tires, different math.
Comparing your fleet CPM to the wrong benchmark is one of the most common mistakes in tire management. A refuse fleet at $0.045 CPM is meaningfully outperforming its peer group; a long-haul fleet at $0.045 is meaningfully underperforming. Category matters as much as the number itself. Book a demo to see per-fleet CPM benchmarking automated
CPM by axle position — where the money actually goes
Fleet-level CPM hides where the money is actually being spent. Breaking CPM down by axle position reveals which positions are dragging the number up — and where optimization effort has the biggest ROI.
Drive tires are 60% of the tractor tire budget. That's where the optimization leverage sits. A 15% CPM improvement on drive tires alone recovers more than a 30% improvement on steer tires would. Prioritize the position with the biggest budget share for the biggest ROI on any tire management program. Start free and see per-position CPM tracking on your fleet
5 cost drivers that move fleet CPM the most
CPM is downstream of specific operational decisions. Understanding which decisions move the number by how much is what separates fleets that hit best-in-class from those that don't.
Retread program depth
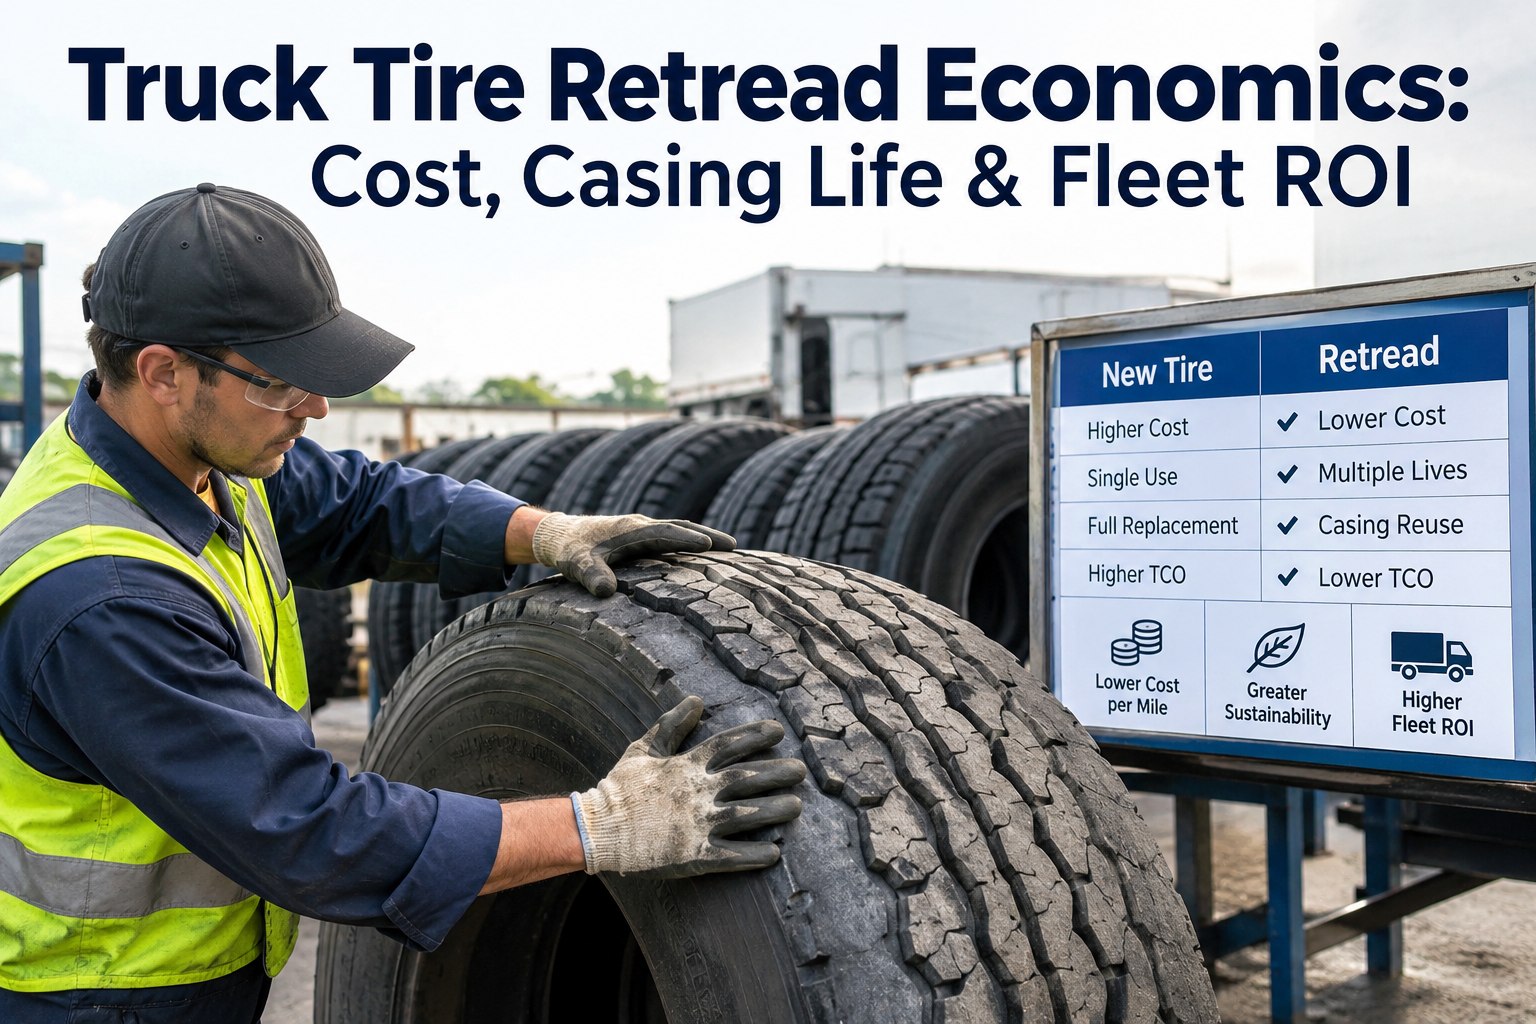
The single biggest CPM driver. A fleet running 2 retread cycles per casing lands 40–50% lower CPM than a fleet running new tires only. Best-in-class retread 2–3 cycles on drive and trailer positions.
Rotation discipline
Tires rotated on schedule deliver 15–25% longer service life than tires left in fixed positions. Fleets with automated rotation triggers hit 20%+ life extension consistently.
Inflation pressure discipline
Chronic under-inflation of even 10% cuts tire life by 15% and drops fuel economy by 2–3%. TPMS-enforced pressure with alerts on deviation recovers both.
Alignment and suspension health
A misaligned truck destroys steer tires 30–40% faster than a properly aligned one. Bad shocks produce cupping that turns drive tires into replacements at 50% of normal life.
Driver behavior (braking, speed, cornering)
Aggressive drivers wear tires 20–30% faster than smooth drivers on identical routes. Coaching + scorecard programs typically recover 10%+ tire life.
The five drivers above compound multiplicatively, not additively. A fleet that improves each driver by 15% doesn't get 75% CPM improvement — it gets closer to 45% due to compounding. But that's still the difference between $0.035 CPM and $0.020 CPM — the exact gap between average and best-in-class in the 2026 benchmarks. Book a demo to see driver-by-driver CPM impact
5 mistakes fleets make when calculating tire cost per mile
Every CPM number is only as accurate as the calculation behind it. Below are the five recurring calculation mistakes that produce misleading CPM figures.
Counting only new tire purchases in the numerator
Fleet divides annual new-tire spend by annual miles and calls that CPM. Ignores retread costs, mounts, rotations, and the fuel penalty from wear. Result: CPM understated 30–40%, real cost hidden.
Comparing to the wrong benchmark peer group
Vocational fleet compares itself to long-haul benchmarks and concludes it's failing. Long-haul fleet compares itself to vocational benchmarks and concludes it's winning. Both wrong — benchmarks matter by duty cycle.
Fleet-level CPM only, no position breakdown
Fleet reports one CPM number. Never sees that drive tires are running at $0.045 CPM while trailer tires are at $0.014. Optimization effort goes to the wrong place because the pain is invisible.
Ignoring the fuel penalty in the calculation
Every 10% underinflation drops fuel economy 2–3%. Every 15% underinflation shortens tire life 15%. Neither shows up in a naive CPM calculation, but both are real dollars leaving the fleet.
Not tracking CPM at all
Fleet has no CPM number. Tire spend is a lump line item on the P&L that goes up every year. No baseline, no benchmark, no way to know if it's controllable. Every optimization decision is guesswork.
Every mistake above compounds silently into a CPM number that either misleads leadership into complacency or triggers action on the wrong lever. The fix in every case is the same: capture the full tire cost data, break it out by dimension, and benchmark against the right peer group. Book a demo to see accurate CPM tracking — or start free and calculate your CPM this week .
From a director of maintenance after the first year of CPM tracking
We'd never calculated CPM before. When we finally ran the numbers on our 74-tractor regional fleet, the answer was $0.041 per mile. Industry benchmark for our duty cycle was $0.030. We were spending roughly $82,000 per year more than we should have been across the fleet, and nobody had realized it because the tire spend was buried in the maintenance line item.
Twelve months later after retread program expansion, TPMS deployment, and automated rotation triggers, we're at $0.026 CPM — below the benchmark. Fleet-wide annual tire spend dropped $110,000. And what surprised me most: the software cost was less than the fuel savings from proper inflation alone. Everything else was pure additional recovery.
Frequently asked questions
How do you calculate fleet tire cost per mile?
Fleet tire cost per mile (CPM) equals total tire lifecycle cost divided by total tire lifecycle miles. Total tire cost includes four components: new tire purchase price, cumulative retread costs (typically 2–3 retread cycles per casing), maintenance labor (mounts, rotations, inspections), and an accumulated fuel penalty from tire wear and under-inflation. Total lifecycle miles is the sum of miles delivered across the original casing plus every retread cycle — typically 400,000–500,000 miles for a well-managed Class 8 drive tire across 3 lifecycle stages. Calculation example: $500 new + $600 retread cost (2 retreads at $300 each) + $150 labor + $250 fuel penalty = $1,500 total cost divided by 450,000 lifecycle miles = $0.0033 per drive tire. Multiplied across 18 tires on a full tractor-trailer combination, that's roughly $0.028 per truck-mile at the fleet level. Compare against the 2026 industry benchmark of $0.025–$0.035 for long-haul Class 8 to see where the fleet stands.
What is a good tire cost per mile for a commercial fleet?
Benchmarks vary by fleet type. For a long-haul Class 8 tractor-trailer in 2026, industry average CPM runs $0.025–$0.035 per mile, with best-in-class fleets at $0.020–$0.024 and under-managed fleets above $0.038. Regional distribution fleets run 15–20% higher due to stop-and-go duty cycles: average $0.028–$0.038, best-in-class $0.024–$0.028. Vocational fleets (construction, refuse, heavy vocational) run 50–80% above long-haul: average $0.040–$0.060, best-in-class $0.035–$0.042, driven by off-road exposure, sidewall damage, and heavy loads. Comparing your fleet's CPM to the wrong benchmark is one of the most common mistakes in tire management — a refuse fleet at $0.045 is outperforming its peer group, but a long-haul fleet at $0.045 is significantly underperforming. Category matters as much as the number itself. Segment your benchmarks by duty cycle before drawing conclusions about performance.
Why does drive tire CPM run higher than trailer tire CPM?
Drive tires do more work than trailer tires and cost more to buy. Drive tires transmit engine power to the road, absorb torque during acceleration and engine braking, and carry more load per tire (dual configuration means 4 tires per axle carrying the tractor + shared trailer load). Typical drive tire CPM in 2026 runs $0.031/mi versus $0.018/mi for trailer tires — a 70% gap. Trailer tires benefit from being purely load-bearing without powertrain forces, cheaper new tire cost ($300–$400 vs $450–$550), and longer typical service life. This is why drive tires are 60% of the tractor tire budget and where optimization effort has the biggest ROI. A 15% CPM improvement on drive tires recovers more than a 30% improvement on steer tires would. Prioritize the position with the biggest budget share for the biggest impact on any tire management program.
How can I reduce my fleet tire cost per mile?
Five cost drivers move CPM the most, in rough order of impact. First and biggest: retread program depth. A fleet running 2 retread cycles per casing lands 40–50% lower CPM than a fleet running new tires only. Best-in-class fleets retread 2–3 cycles on drive and trailer positions. Second: rotation discipline. Tires rotated on schedule deliver 15–25% longer service life. Third: inflation pressure discipline. TPMS-enforced pressure with alerts on deviation recovers 10–18% CPM impact through both tire life and fuel economy. Fourth: alignment and suspension health. A misaligned truck destroys steer tires 30–40% faster than a properly aligned one; bad shocks produce cupping that halves drive tire life. Fifth: driver behavior. Aggressive drivers wear tires 20–30% faster on identical routes; coaching programs typically recover 10%+. The five drivers compound multiplicatively — a fleet improving each by 15% doesn't get 75% CPM improvement but gets closer to 45%, which is the exact gap between average and best-in-class.
What is the fuel penalty in the CPM calculation?
The fuel penalty captures accumulated fuel economy losses caused by tire condition over the tire's lifecycle. Two effects drive it: under-inflation and wear-related rolling resistance. Every 10% under-inflation drops fuel economy 2–3%, and a chronically under-inflated tire accumulates that MPG loss across every mile it runs before being detected or corrected. Wear-related rolling resistance increases as tread depth drops, producing a smaller but real MPG penalty on the last 25% of tire life. For a fleet without strict pressure discipline, the fuel penalty typically adds $0.001–$0.003 per mile to true CPM — a variable most fleets omit from their calculation, which understates real tire cost by 10–15%. Including fuel penalty in CPM calculation isn't accounting perfectionism; it's the visibility needed to justify TPMS investment, driver coaching programs, and pressure-check discipline in ways that show up on the P&L rather than getting lost in the fuel line item.
Turn tire cost per mile from a mystery into a live dashboard KPI
HVI computes CPM per tire, per position, and per truck from your purchase records, retread cycles, maintenance labor, and mileage — benchmarked against your fleet-type peer group in real time. Outlier trucks dragging the fleet CPM up get flagged automatically. Live in under two weeks — typical fleets identify $50,000–$150,000/year in existing CPM leakage within the first quarter.
No credit card · No hardware · CPM dashboard ready day one