A fleet downtime cost calculator is where the story most fleet managers tell themselves collides with the number their CFO would actually respect. Unplanned truck downtime is not a $500 repair bill. It's the repair, the tow, the lost revenue miles, the driver still on the clock, the customer penalty, and the rental replacement — every one of them happening at the same time. The calculator below shows the annual damage on your specific fleet, then this guide breaks down where it hides. Book an HVI demo →.
Pick your fleet size and downtime rate. See the annual number your CFO isn't asking about yet.
Every commercial fleet loses money to unplanned downtime. The typical operator underestimates the total by 40-60% because the direct repair bill is only 30-40% of the true cost. Here's what it actually adds up to.
cost per Class 8 truck per day
their true downtime cost by
by documented PM program
The 5 components of true fleet downtime cost
The number the calculator produces isn't one bill; it's five bills arriving at the same time whenever a truck goes down unplanned. Most fleets track components 1 and 2 (repair and parts) accurately, guess at 3 (labor), and forget 4 and 5 entirely. Here's the actual breakdown of where the money goes.
Add them together and the direct repair bill (the number your shop invoice shows) is roughly one-third of the true downtime cost. The other two-thirds are indirect — and they're where fleets consistently underestimate the damage. Book an HVI demo to see per-event downtime cost tracked automatically across all five categories.
Direct costs — what the shop invoice shows
Direct costs are the ones every fleet manager sees and reports on. They're accurate, easy to track, and consistently understated as a percentage of the total. Here's the 2026 benchmark table for typical Class 8 truck failure events.
Notice the range on hours down. A brake system caught at pre-trip inspection is a 4-hour bench repair. The same brake system failing on the shoulder becomes a 24-hour ordeal including tow, mobile mechanic, and load transfer — and the driver, the load, and the customer are all sitting through it. The failure mode isn't the differentiator; the timing is. Try HVI free to catch failure modes at pre-trip before they become roadside events.
Indirect costs — where 60-70% of the damage hides
Indirect costs are the ones the shop invoice doesn't show. They don't come from the mechanic; they come from the load, the driver, and the customer. Fleets that track only direct costs are looking at less than half the picture.
Add these four indirect categories together and a typical unplanned downtime day on a Class 8 truck lands between $1,600 and $2,600 — roughly two to three times the direct repair cost. This is why the calculator uses $760/day as the blended average across the whole event mix. Some days are cheaper; some are dramatically more expensive; the average holds. Book an HVI demo to see per-event indirect cost tracked automatically.
How to calculate your fleet's true downtime cost
The calculator at the top uses industry averages. To build the number for your specific fleet, use the formula below with your own operating data. Every fleet has different rates, but the structure of the calculation is universal.
The math is unforgiving but honest. And once the number is on paper, the second question follows automatically: what would it take to reduce it? That's where PM ROI comes in. Book an HVI demo to see the per-truck version of this formula on your data.
The PM ROI comparison — what the fix costs vs what it saves
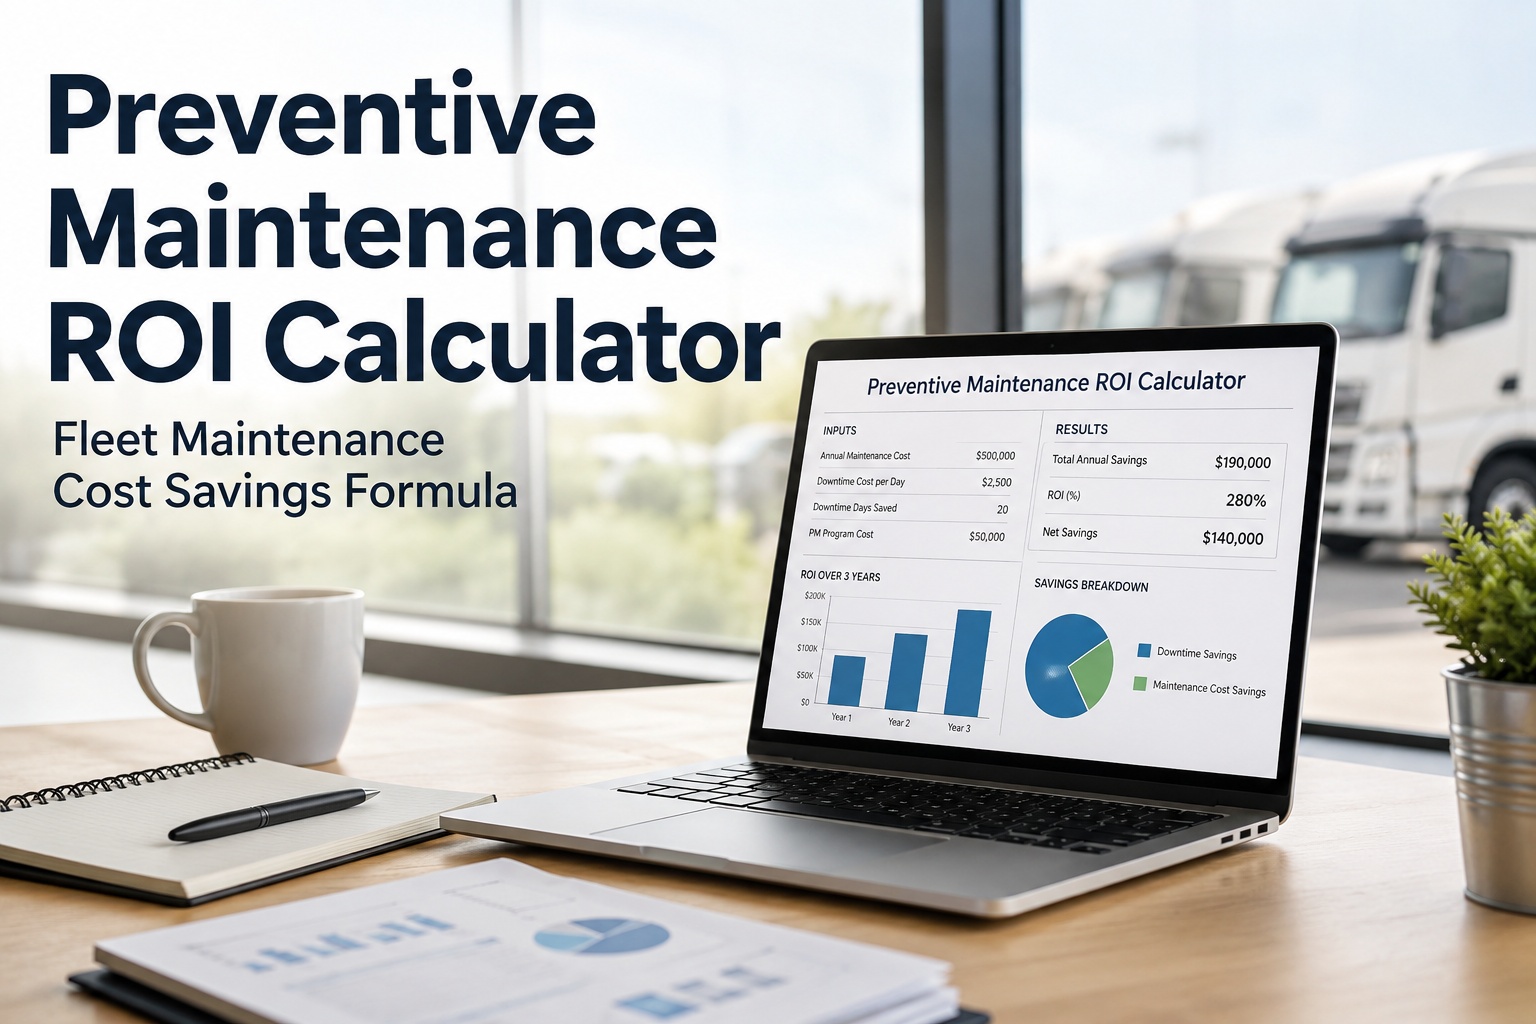
A documented preventive maintenance program typically reduces unplanned downtime by 30-45% within the first two quarters of full implementation. The PM investment is real — but the recovery dwarfs it. Here's the 50-truck example worked in both directions.
The number that matters isn't the software cost. It isn't even the total PM cost. It's the delta between reactive and proactive downtime spend — and that delta consistently runs 3-6x the PM investment for fleets that actually execute the program. Try HVI free to calculate the specific ROI for your fleet.
From an operations director running 76 tractors on regional distribution
We ran the number our CFO asked for in Q4 2023. Actual downtime cost across 76 tractors that year: $1.14 million. When we told her, she asked why we hadn't been reporting that on the monthly dash. The honest answer was that we'd been showing only the shop invoice number — roughly $340,000. The other $800,000 was hiding in ops.
Implemented HVI in Q1 2024 with per-event cost capture. Sixteen months later, actual downtime cost dropped to $612,000 — a $528,000 annual recovery. The software cost across all trucks was under $40,000. Even accounting for the added PM parts and labor, the recovery was thirteen times the investment. We now report both direct and indirect downtime on the monthly package and the CFO stopped asking the question.
JRJamal R.Operations Director · Regional distribution carrier · 76 tractors + 118 trailers
Frequently asked questions
How much does fleet downtime actually cost per day?
For a typical Class 8 truck in 2026, unplanned downtime costs approximately $760 per day as a blended average across all failure types. This number combines direct costs (repair labor 30-40%, parts, towing 5-10%) with indirect costs (lost revenue miles 30-40%, driver wages 10-15%, rental replacement, customer SLA penalties 5-15%). Individual event costs range from under $1,000 for a quick electrical fix caught at pre-trip to over $5,000 per day for a roadside engine failure with load transfer. Downtime cost varies by fleet type: dedicated regional operations typically run lower per-day cost, long-haul with high driver-hour cost run higher, and specialized hazmat or refrigerated operations run highest due to load-specific penalties. The $760 figure derives from ATRI 2024 operational cost data adjusted for 2026 conditions.
Why do fleets underestimate their downtime cost by 40-60%?
Most fleets track only the shop invoice number — the direct repair labor and parts cost. That number is typically 30-40% of the true downtime cost. The other 60-70% is spread across categories that don't roll up into a single line item: lost revenue miles (accounted separately in the ops report), driver wages during breakdown (payroll bucket), rental replacement (P&L operating expense), missed SLA penalties (customer service ledger), and reputation impact (nowhere on the balance sheet). Because these costs live in different systems and different departments, the total number is rarely calculated. A properly configured fleet KPI dashboard aggregates all five categories per event to produce the true cost — and the aggregate is consistently 2-3x higher than the shop invoice alone.
Can preventive maintenance really reduce downtime cost that much?
Yes, and the reduction is well-documented. Fleets moving from reactive maintenance to a documented preventive program consistently see 30-45% downtime reduction within the first two quarters of full implementation. The math works because preventive maintenance shifts failure timing: instead of a brake system failing on the shoulder at 2 AM (24-hour event, $5,000+ direct cost, driver overnight, load transfer, customer penalty), the same brake system gets flagged at pre-trip inspection and repaired in-shop during a planned 4-hour window ($1,200 direct cost, no driver clock, no rental, no penalty). Same component, same repair, same technician — timing and location shift the total event cost by 60-80%. The PM investment cost is real but consistently 3-6x smaller than the recovered downtime cost.
What is a good downtime rate for a fleet?
Downtime rate benchmarks: under 5% is best-in-class for well-managed for-hire fleets running disciplined preventive maintenance programs. 5-10% is the typical operational range where most disciplined fleets sit. 10-15% signals a reactive-heavy shop with paper-based tracking and inconsistent PM discipline. Above 15% indicates a fleet in operational distress where breakdowns are effectively driving the schedule. Vocational fleets (construction, mining, specialized equipment) typically run higher legitimate downtime because the assets sit stationary during production cycles — but even there the target remains under 10% with proper PM discipline. Downtime rate is calculated as unavailable engine-days divided by total available engine-days across the reporting period. This is the single most predictive metric of fleet financial health after cost per mile.
How quickly does downtime cost tracking pay for itself?
Fleet maintenance software including downtime cost tracking typically pays for itself within 60-90 days of full implementation for fleets above 20 units. The recovery is fast because the first month of tracking usually surfaces 2-3 categories of hidden cost the fleet was previously eating unnoticed — a specific truck consistently costing 4x fleet average, a driver-specific pattern of preventable roadside events, or a shop-side pattern of delayed PM that was quietly cascading into unplanned failures. Fixing any one of these typically recovers more than the annual software cost. Fleets under 20 units see the payback in 90-180 days because the smaller failure sample size takes longer to surface patterns. Above 50 units, ROI is typically visible within Q1 and dramatic by Q2. Consult your specific numbers with the fleet downtime cost calculator at the top of this page.
Calculate and reduce fleet downtime cost with Heavy Vehicle Inspection.
HVI captures every downtime event with both direct and indirect cost categories: repair, parts, tow, driver wages, lost revenue, rental, SLA penalties. Per-truck downtime dashboards. PM ROI analysis showing the specific recovery unlocked. Live for your fleet in 5-7 days.
Per-event tracking · Cost category breakdown · PM ROI dashboard · SOC 2 Type II