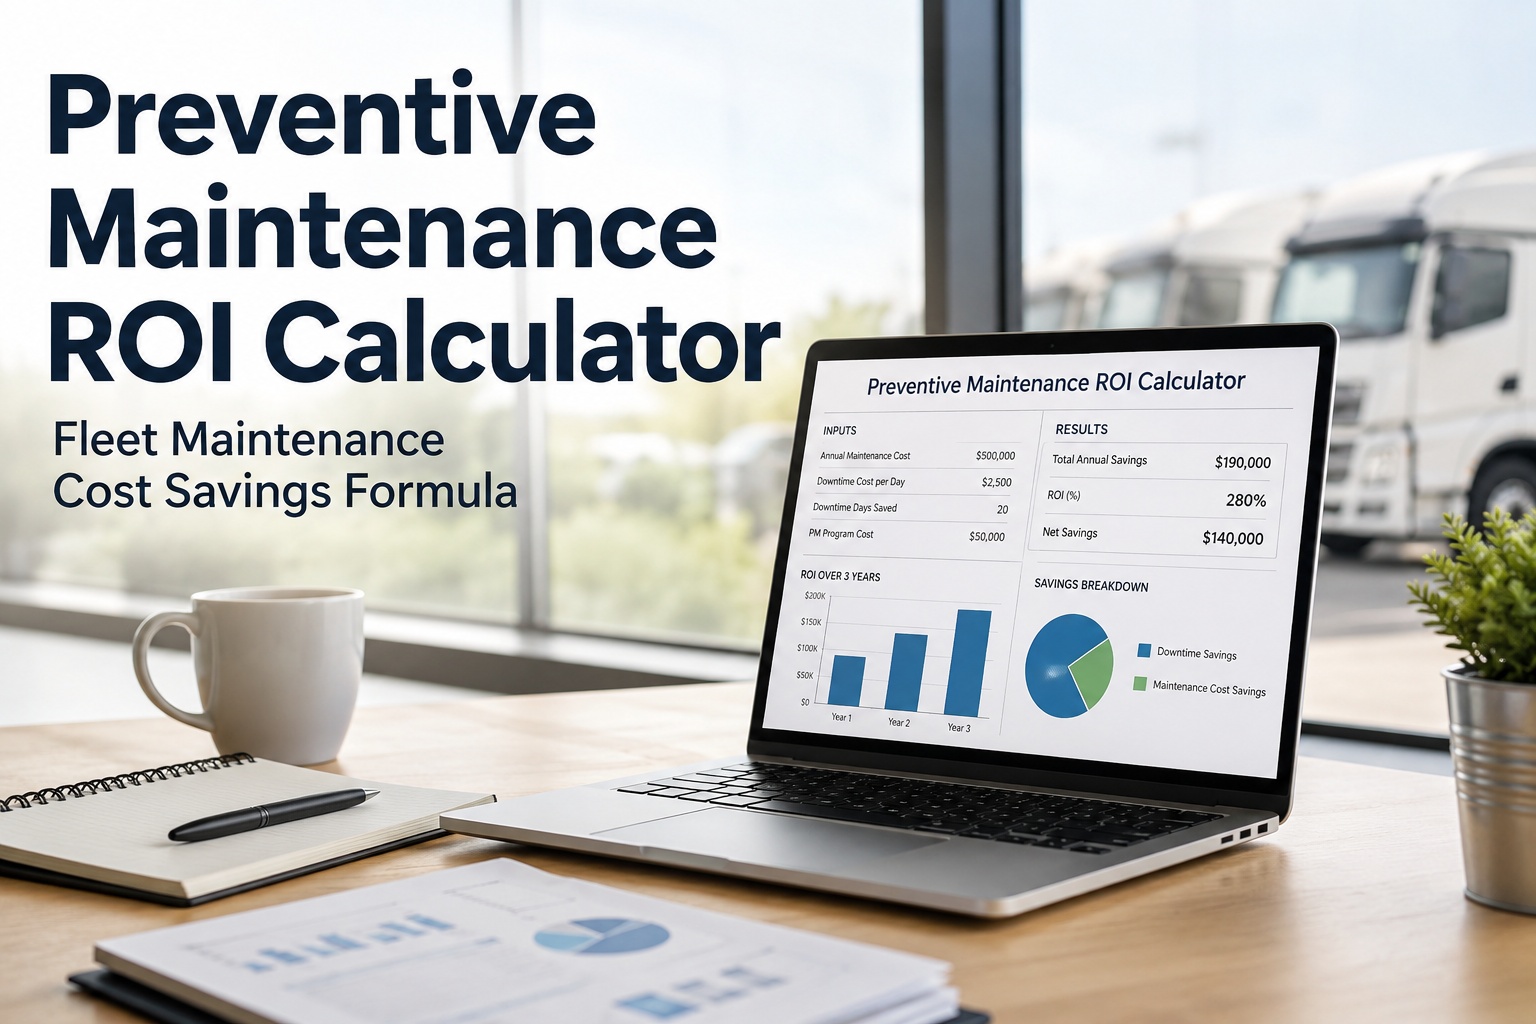
Preventive maintenance ROI calculator inputs are simple: fleet size, current PM state, and industry cost benchmarks. Output: the annual dollar difference between where your fleet's maintenance spending is today and where it would land at best-in-class PM discipline. For most commercial fleets that number lands between $75,000 and $3,000,000 annually — real recoverable dollars hiding in a shift from reactive-heavy to preventive-heavy maintenance ratios. This preventive maintenance ROI calculator guide walks the four-variable ROI formula, an interactive calculator to see your own fleet's number, the four cost buckets that make up the delta, a 3-state comparison of reactive vs balanced vs PM-optimized fleets, and the five mistakes fleets make when calculating PM ROI for a CFO business case. Book a demo after you see your number.
Preventive Maintenance ROI Calculator
Pick your fleet size and current PM state. See what shifting to best-in-class PM discipline is worth annually.
Whatever number you just saw is what's hiding inside your maintenance budget today. Below is where every dollar of the delta comes from, why the CFO business case works, and the five mistakes fleets make when running this calculation for leadership.
The 4 cost buckets that make up the PM ROI delta
The $6,000-per-truck annual delta between reactive-heavy and PM-optimized fleets isn't one line item — it's four buckets that each move independently. Understanding where each dollar comes from is what makes the ROI defensible to the CFO.
Direct labor + parts savings
Roadside emergency repair costs 2–4x shop repair. Emergency parts orders carry premium pricing. Planned PM captures both cost avoidances.
Downtime avoidance
Every unplanned breakdown day costs $500–$800 in lost revenue capacity. Reactive-heavy fleets average 8–12 breakdown days/truck/year; PM-optimized fleets under 3.
Cargo delay + detention pay
Breakdown mid-run triggers detention pay for waiting drivers, missed delivery penalties, and rescheduling costs. Direct P&L hit that reactive-only accounting often misses.
CSA + insurance premium impact
Vehicle Maintenance BASIC violations from reactive-only programs drive CSA scores up and insurance premiums with them. Underwriters increasingly price PM discipline into renewal rates.
Four buckets, $6,000 per truck per year. On a 100-truck fleet, the four buckets together represent $600,000 in annual recoverable spend that a reactive-heavy fleet is losing to the fifth bucket: doing nothing. Book a demo to see all 4 cost buckets tracked automatically
The 3 PM states side-by-side — where does your fleet actually sit?
Every fleet operates in one of three PM states. The differences aren't philosophical — they show up in specific measurable KPIs that a CFO can verify against invoices, insurance renewals, and CSA scores.
Moving from reactive-heavy to PM-optimized on a 100-truck fleet is $600,000/year in recoverable spend distributed across the five KPIs above. The shift takes 12–18 months to fully realize but starts showing measurable results by month 3 as breakdown days drop and roadside events decline. Book a demo to see PM ratio tracked in real time — or start free and see where your fleet sits today .
5 mistakes fleets make when calculating PM ROI
Every PM ROI business case that fails at the CFO stage traces back to one of five recurring calculation mistakes. All five are preventable with the framework in this guide.
Counting only direct labor + parts savings in the ROI
ROI calculation includes shop labor savings and parts cost savings only. Ignores downtime, cargo delay, insurance impact, and CSA-related costs. Total ROI understated by 60–70%.
Modeling ROI at fleet-average state instead of current state
Fleet assumes industry-average $15K/truck maintenance cost as baseline. Actual fleet is at $19K reactive-heavy state. Gap between current and optimized is understated because baseline was too generous.
Ignoring the CSA + insurance premium bucket
Fleet excludes CSA and insurance from ROI because those numbers are "hard to attribute" to PM specifically. CFO calls the business case incomplete because two P&L lines are missing.
No payback period in the business case
Business case shows annual ROI dollars but no payback period. CFO wants to know "how many months until this pays for itself?" — not just the run-rate savings. Without payback the business case gets deferred to next quarter.
Modeling instant transition instead of realistic 12–18 month ramp
ROI assumes full $600K/year savings starting month one. CFO stress-tests the assumption and finds it doesn't hold — PM ratio shifts take 12–18 months. Credibility of entire business case collapses.
Every mistake above turns an honest, defensible business case into one the CFO rejects — not because PM ROI isn't real, but because the calculation looked sloppy. Get the four buckets, current-state baseline, and realistic ramp right, and the business case defends itself. Book a demo to see CFO-ready ROI reporting — or start free and calculate your fleet's ROI this week .
From a director of maintenance who won the CFO approval
Our first PM software business case got rejected. CFO said the ROI numbers were "too optimistic" — we'd modeled full savings starting month one, and we'd only counted direct maintenance costs. She wasn't wrong. We rebuilt it: current state baseline from 12-month invoice data, all four cost buckets including downtime and insurance, and a realistic 12-month ramp on the savings curve.
Second submission: approved in the same board meeting. Year one on our 47-tractor fleet we actually landed at $268,000 recovered against a modeled $290,000 — within 8%. Software cost was recovered by month 5. What surprised me most: the downtime avoidance bucket by itself was 40% of the total. Nobody had been costing that line item before.
Frequently asked questions
How do you calculate preventive maintenance ROI for a fleet?
Preventive maintenance ROI equals the annual delta between current-state and PM-optimized-state maintenance cost, multiplied by fleet size, minus the software and program investment. The industry-standard delta between a reactive-heavy fleet and a PM-optimized fleet in 2026 is approximately $6,000 per truck per year, distributed across four cost buckets: direct labor and parts savings (~$2,200), downtime avoidance (~$1,800), cargo delay and detention pay (~$1,200), and CSA plus insurance premium impact (~$800). For a 100-truck fleet moving from reactive-heavy to PM-optimized, that's roughly $600,000 in annual recoverable spend. Typical CMMS software payback lands in 3–6 months for any fleet with more than 20 vehicles. The realistic savings ramp is 12–18 months to hit steady-state, with year-one savings typically 50–60% of run rate. Any ROI calculation should use current-state maintenance spend as baseline (not industry average) and include all four cost buckets to survive CFO scrutiny.
What is a good PM ratio for a commercial fleet?
PM ratio is the percentage of maintenance spend on planned (preventive + predictive) work versus reactive (breakdown + emergency) work. Best-in-class fleets in 2026 hit 75%+ planned. Industry average sits at 40–60% planned. Reactive-heavy fleets run below 30% planned — and those fleets consistently show 20%+ higher total maintenance costs, higher CSA Vehicle Maintenance BASIC scores, and higher insurance premium trajectories than balanced or PM-optimized peers. The gap between 30% and 75% PM ratio maps directly to the $6,000-per-truck annual cost delta. Moving from reactive-heavy to PM-optimized doesn't happen overnight — typical transition takes 12–18 months, with measurable results starting to appear by month 3 as breakdown days drop and roadside events decline. The transition requires PM scheduling by meter reading or calendar, digital inspection workflows, and inventory management for common wear parts — capabilities integrated in modern CMMS platforms.
How much does downtime cost a commercial truck fleet?
Downtime cost for a Class 8 tractor typically runs $500–$800 per day in lost revenue capacity, with wide variance by cargo type and route. Refrigerated freight, hazmat, and high-value cargo run at the top of the range. The full cost of a single unplanned breakdown includes direct roadside service (2–4x shop repair cost), premium emergency parts pricing, driver detention pay while waiting for repair, missed delivery penalties, and rescheduling costs. A reactive-heavy fleet typically averages 8–12 breakdown days per truck per year — that's $4,000–$9,600 per truck annually just in direct downtime revenue loss, before including the other cost buckets. A PM-optimized fleet runs under 3 breakdown days per truck per year, cutting the downtime cost by 60–75%. This is the single largest bucket in PM ROI math and the one most reactive-only accounting misses because it doesn't show up as a maintenance line item — it shows up as lost revenue that never got booked.
What's the typical payback period for CMMS software?
Typical CMMS (Computerized Maintenance Management System) software payback for a commercial fleet lands at 3–6 months, driven by the combination of maintenance cost savings, downtime avoidance, and administrative efficiency gains. For a 100-truck fleet at $10–25 per vehicle per month software cost (roughly $12,000–$30,000 annual software spend), the payback math against $300,000–$600,000 in annual maintenance savings is straightforward — payback is measured in months, not years. Smaller fleets under 20 vehicles typically see payback in 6–9 months because the per-truck fixed savings compound less against a smaller total spend. Larger fleets above 200 vehicles often hit payback in 2–3 months because per-vehicle software pricing tiers down at scale. Software cost is almost always the smallest line item in the maintenance economics — a fact that surprises most CFOs the first time they see the numbers side-by-side.
How do I build a preventive maintenance business case for my CFO?
Six components make a CFO-ready PM business case. First, current-state baseline calculated from your actual 12-month maintenance invoice data divided by truck count — not industry averages. Second, target state defined explicitly as PM-optimized (75%+ planned ratio, ~$12K per truck per year cost). Third, all four cost buckets included: direct labor/parts, downtime avoidance, cargo delay and detention, and CSA/insurance impact. Fourth, realistic 12–18 month savings ramp modeled explicitly — not instant transition. Fifth, software and implementation costs itemized with payback period in months (typically 3–6). Sixth, sensitivity analysis showing ROI even under conservative assumptions (e.g., only 60% of modeled savings realized). Skip any one of these six and the CFO will find the gap during stress-testing. Include all six with defensible numbers and the business case typically wins approval in a single review cycle. The Sarah P. quote above walks through exactly this pattern — first submission rejected for missing components, second submission approved with the full framework.
Turn the ROI number you just calculated into an approved CFO business case
HVI schedules PM by meter or calendar, tracks planned-versus-reactive ratio in real time, captures downtime days per truck automatically, and generates ROI reports suitable for direct CFO submission. Live in under two weeks — typical fleets recover the software cost from cost bucket 2 (downtime avoidance) alone within the first quarter.
No credit card · No hardware · PM ROI dashboard ready day one