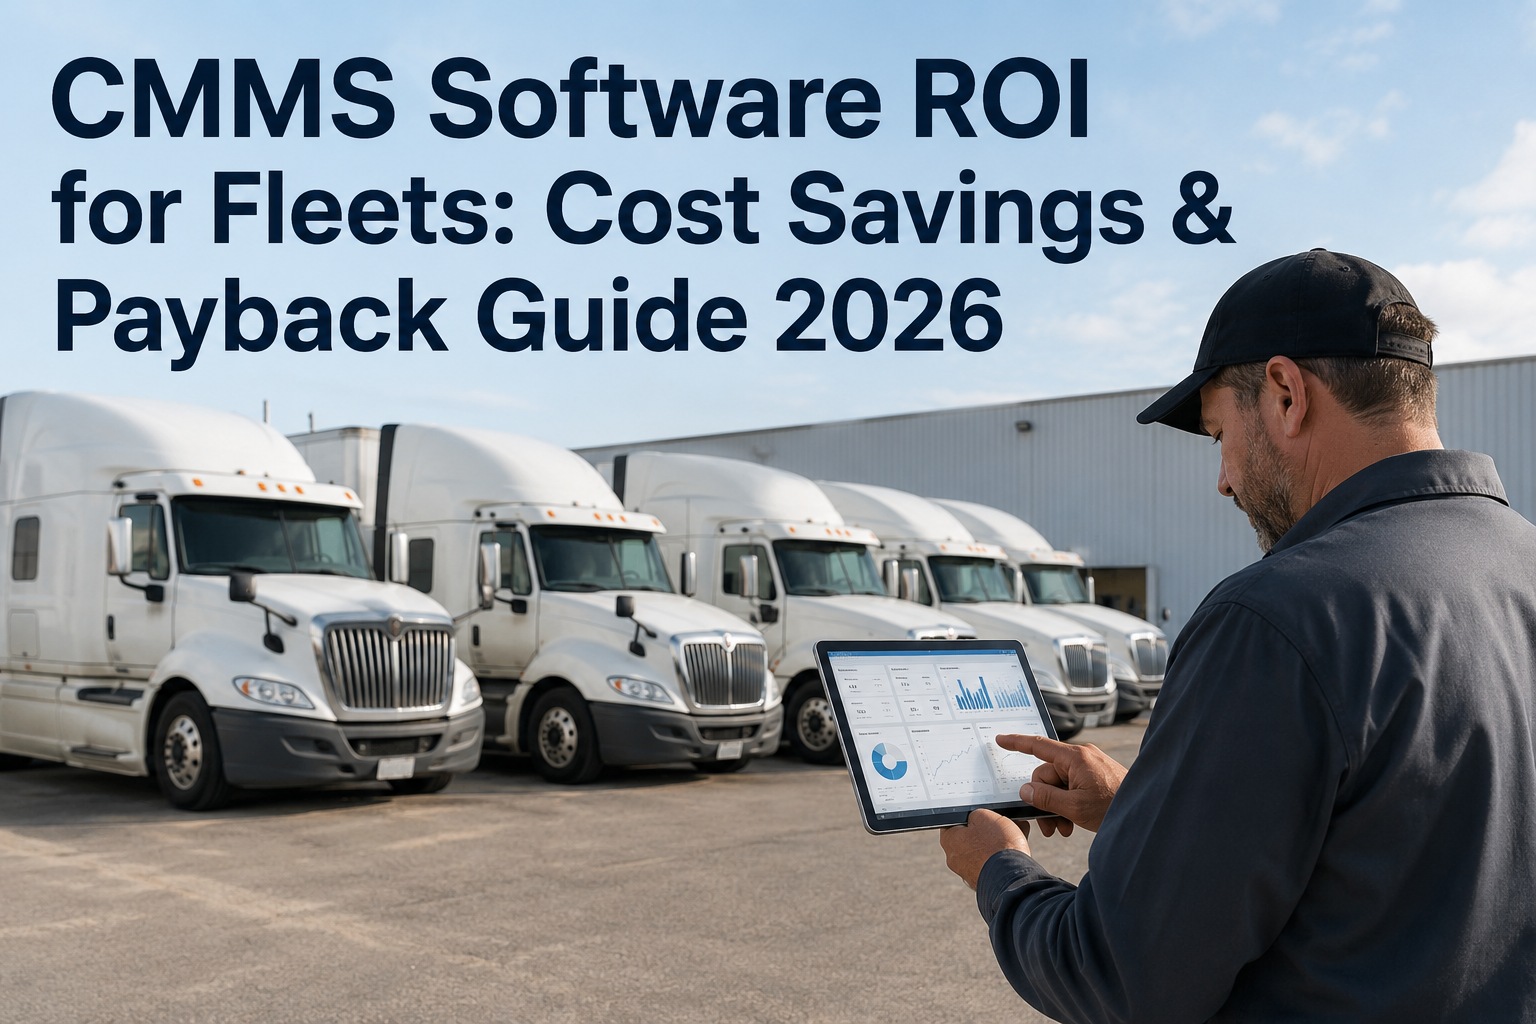
CMMS software doesn't create ROI by digitizing maintenance — it creates ROI by shifting reactive spend to planned spend, recovering unplanned downtime hours, freeing technician time, tightening parts control and preventing emergency repairs. The five levers combine into a single business case; the payback period depends on fleet size, maintenance maturity, and software cost. Independent research (Aberdeen Group, US DOE) documents 27–45% downtime reduction and 3–9 month typical payback for mid-sized fleets. This 2026 guide walks the transparent 5-lever framework. Book a demo .
CMMS ROI — The Five Levers and the Payback Curve
Illustrative 100-vehicle fleet. Assumes typical labor rates, downtime costs, and a 27% baseline downtime reduction (Aberdeen Group).
Illustrative model based on independent benchmarks (Aberdeen 27% downtime reduction, US DOE reactive multiplier 3–5x). Actual fleet outcomes depend on baseline maintenance maturity, adoption rate, and specific inputs.
CMMS ROI conversations fall into two categories: those where the fleet has real baseline data (unplanned downtime hours, reactive-vs-planned spend ratio, technician time on manual scheduling, parts spend per vehicle) and those where they don't. The first conversation ends with an approved software line item; the second stays a conversation. The framework below is the one operations teams use to convert the second conversation into the first — five measurable savings levers, transparent assumptions per lever, and a payback timeline the CFO can defend to a board. Individual fleet numbers vary significantly; the framework holds regardless of the inputs plugged in.
The five levers explained — where CMMS ROI actually comes fromIndependent benchmarks per lever, plus the fleet-specific input needed to plug in your own numbers
Most weak CMMS business cases fail because they quantify one or two levers and miss the other three. The strongest cases quantify all five with conservative percentages against independently sourced benchmarks. Book a demo to walk through your fleet's lever-by-lever numbers
Benchmark: Aberdeen Group documents 27% average downtime reduction for organizations using CMMS vs those without. US DOE Operations & Maintenance Best Practices Guide cites 35–45% for mature programs. Fleet input: unplanned downtime hours per year × revenue exposure per hour × conservative 18–27% reduction. Why largest: revenue-per-hour multipliers make downtime hours the highest-dollar variable in most fleet ROI models.
Benchmark: US DOE research shows reactive repairs cost 3–5x the equivalent planned service across sectors. World-class fleets target 80% planned / 20% reactive. Fleet input: current annual emergency repair count × average emergency cost × conservative 20–30% shift to planned. Why measurable: emergency events are typically already tracked in the work order system — baseline data usually exists.
Benchmark: Technician wrench-time typically recovers 6–10% when guided workflows replace paper-based scheduling. Admin/data entry time recovered typically 3–5 hours per week per person. Fleet input: technician headcount × fully loaded hourly rate × annual hours × 6–10% recovery + admin hours recovered × loaded rate. Why undercounted: commonly excluded from initial business cases because it's harder to attribute post-implementation.
Benchmark: Average PM compliance without CMMS runs around 54% per industry surveys. CMMS-enabled fleets commonly reach 85%+ within 6 months. Fleet input: baseline PM compliance rate × historical failure-chain cost from missed PMs × compliance lift. Why compounds: higher PM compliance reduces downstream emergency repair frequency, which then reduces downtime hours — feeding levers 1 and 2.
Benchmark: MRO inventory waste (obsolete, excess, expired) typically runs 20–35% of parts spend in fleets without inventory visibility. Emergency purchases at 5–10x standard freight cost. Fleet input: current parts spend × conservative 15–25% waste reduction + emergency purchase reduction. Why smallest: smallest lever in most models, but often the fastest to demonstrate post-implementation.
The strongest business cases apply each lever independently against fleet-specific baseline data, then sum — not multiply, not overlap, not double-count. Book a demo to walk your fleet's lever-by-lever numbers
The payback formula — how to calculate months to break-evenThe two variables that determine whether the business case is a 4-month payback or a 14-month one
Payback period is the number CFOs typically want first — because it frames the CMMS decision as risk-bounded rather than open-ended commitment.
ROI scales with fleet size — three illustrative scenarios25, 100, and 500 vehicle fleets with transparent assumptions — not universal benchmarks
The same 5-lever framework produces different absolute numbers depending on fleet size, baseline maintenance discipline, and revenue exposure per hour. The payback ratio stays comparable; the total savings scales with fleet size.
The pattern holds across fleet sizes: payback compresses on high-downtime-cost operations, extends on already-mature programs. Book a demo to model your fleet's specific scenario
What determines whether your fleet lands on the fast payback or the slow oneSix factors that swing the payback timeline — and which ones the fleet can influence
Two fleets of identical size can see 2-month and 12-month payback periods on the same CMMS. The variance is driven by measurable factors — understanding them lets fleets set realistic expectations and pull the levers that compress payback. Start a free trial to begin collecting baseline data.
Faster payback fleets
Slower payback fleets
From a VP of Fleet Operations on building the ROI case that got approved
Our CFO wanted a three-year ROI model before approving any CMMS. We spent six months building baseline data from our own work order system — unplanned downtime events per vehicle per month, reactive-vs-planned spend ratio, average emergency repair cost, technician time on manual scheduling. Not vendor projections. Our own numbers.
Payback came out at 7.2 months on our 112-tractor fleet, applying conservative percentages against each of the five levers. CFO approved it in the same meeting — because every input was defensible. We ended year one at 3.8x return, ahead of the projection. The lesson wasn't that the software was magic; it was that a business case built on your own baseline data with independently sourced benchmarks against each lever is what gets budgets approved. Vendor "up to X% savings" numbers don't survive capital committee review.
Frequently asked questions
How do you calculate CMMS software ROI?
CMMS ROI is calculated as measurable annual financial benefit minus annual CMMS cost, divided by annual CMMS cost, expressed as a percentage. The strongest business cases quantify all five savings levers rather than one or two: (1) downtime reduction — unplanned downtime hours × revenue exposure per hour × conservative reduction percentage (Aberdeen Group documents 27% average; US DOE cites 35–45% for mature programs); (2) emergency repair reduction — current emergency events × average cost × shift-to-planned percentage (reactive costs 3–5x planned per US DOE); (3) labor productivity — technician wrench-time recovered (6–10%) + admin/data entry hours recovered; (4) PM compliance value — baseline compliance rate × historical missed-PM failure cost × compliance lift (industry average moves from ~54% to 85%+); (5) parts & inventory — current parts spend × conservative waste reduction (15–25%) + emergency purchase reduction. Sum the five levers, subtract annual CMMS cost, divide by CMMS cost. Individual fleet numbers vary; the framework holds regardless of inputs plugged in.
What is the typical payback period for CMMS software?
Typical CMMS payback for mid-sized fleets runs 3–8 months when downtime and labor baselines are accurately measured. The payback formula is: (implementation cost + annual software cost) ÷ (monthly measurable benefit from the five savings levers). Payback compresses for fleets with high revenue exposure per hour of downtime, current high reactive-to-planned maintenance ratios, and existing baseline data that makes ROI provable quickly. Payback extends for fleets already running mature preventive maintenance programs where lever gains are smaller, fleets missing baseline data (which takes 60–90 days to establish before improvement is measurable), and fleets with weak adoption (industry data shows roughly 40% of CMMS implementations underperform primarily due to adoption issues rather than software capability). Software cost typically ranges $10–30 per vehicle per month for fleet-focused CMMS platforms. Implementation cost for standard SaaS deployment often runs $0–$5,000. An illustrative 100-vehicle fleet with $30,000 all-in year-1 cost and $224,000 in measurable savings shows approximately 1.6-month payback — a common range but not a universal benchmark.
Which CMMS savings lever is largest for most fleets?
Downtime reduction is the largest single savings lever for most commercial fleets, and by significant margin. This is because revenue-per-hour multipliers make each recovered downtime hour worth more than each recovered technician labor hour or each recovered parts dollar. A 50-vehicle fleet losing 2 hours per vehicle per month at $100 per operating hour loses $120,000 per year to downtime alone — more than most parts savings estimates for the same fleet. Aberdeen Group documents 27% average downtime reduction for organizations using CMMS versus those without; US DOE Operations & Maintenance Best Practices Guide cites 35–45% reduction for mature programs. The order of magnitude of the five levers for a typical mid-size commercial fleet is roughly: downtime reduction (largest, 40–45% of total ROI), emergency repair reduction (25–30%), labor productivity (12–18%), PM compliance value (6–10%), parts & inventory (5–8%). Individual fleet mix varies significantly based on the specific operation.
Why do some CMMS implementations fail to deliver projected ROI?
Industry research indicates roughly 40% of CMMS implementations underperform their projected ROI. The primary reason is not software capability — it's user adoption. When technicians, drivers, or supervisors don't consistently use the system, the data required to demonstrate ROI never accumulates. Common adoption failure modes: desktop-only systems requiring users to switch context away from the vehicle or work station; complex workflows that take longer than the paper process being replaced; missing offline capability in field environments with unreliable connectivity; lack of executive sponsorship or middle-management enforcement; training that ends after go-live without ongoing reinforcement. Fleets that consistently achieve 90%+ adoption typically share several attributes: mobile-first design that operators can use at the vehicle; guided workflows shorter than the paper equivalent; offline capability with sync when connectivity returns; measurable adoption tracking in the first 90 days; and management visibility into who is and isn't using the system. Adoption isn't a technology problem; it's a change management problem with a technology component. Fleets that budget for change management alongside software cost consistently outperform those that budget only for software.
Does HVI help build a CMMS ROI business case?
Yes, at the baseline-data and workflow-measurement layer that ROI calculation requires. HVI centralizes fleet inspections, defect reports, preventive maintenance schedules, work orders, parts and inventory records, and maintenance cost data per asset — giving the operations team the measurable inputs needed to build a business case against each of the five ROI levers (downtime, emergency repairs, labor productivity, PM compliance, parts control). Features include mobile-first inspection and work order workflows that support high adoption rates, PM scheduling with automated overdue tracking, defect-to-work-order routing, parts and inventory tracking with usage visibility, cost analytics per asset and per maintenance category, and searchable multi-year maintenance history for baseline vs improvement comparison. HVI is not a management consulting service, financial modeling firm, ROI guarantor, or benchmarking service. Fleet-specific ROI depends on the fleet's own baseline data, labor rates, revenue exposure per hour of downtime, adoption rate, and market conditions. What HVI provides is the platform and the workflow measurement layer that make the business case defensible — the fleet's operations and finance teams build the specific ROI case using their own inputs.
The CMMS business case that gets approved is built on your own baseline data — not vendor promises
HVI gives you the platform to capture the baseline data (downtime, emergency repairs, PM compliance, labor time, parts spend) that turns "we should probably get a CMMS" into a defensible business case with a payback timeline finance can approve.
No credit card · No hardware · Setup in minutes