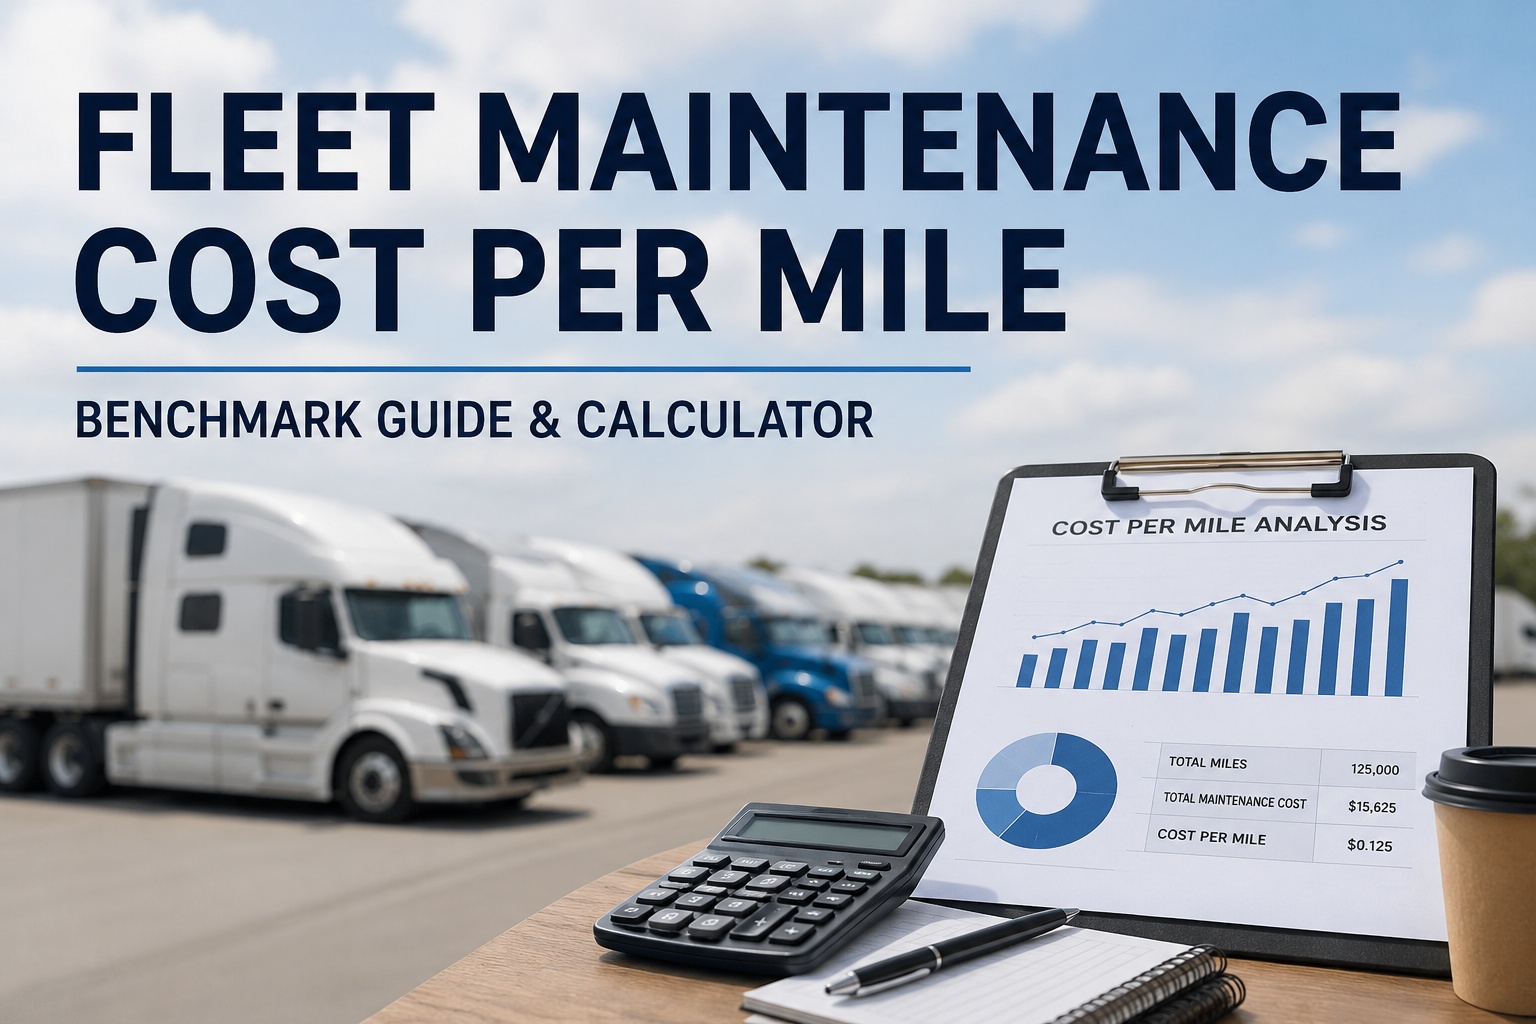
Fleet maintenance cost per mile is the single most-tracked KPI in commercial trucking — and one of the most commonly miscalculated. The 2026 ATRI Analysis of Operational Costs of Trucking sets the 2025 industry benchmark at $0.215 per mile, up 8.6% from $0.198 in 2024. Top-quartile fleets hit $0.12-$0.18/mi; bottom-quartile fleets exceed $0.30/mi. The difference isn't fleet size — it's calculation discipline, planned-vs-reactive PM ratio, and fleet-age curve management. Book an HVI demo for real-time CPM tracked automatically.
Same formula. Same fleet size. $0.15 vs $0.32 per mile.
The gap between top-quartile and bottom-quartile fleets isn't fleet size or region — it's five measurable operational differences that show up in the CPM calculation.
What fleet maintenance cost per mile actually includes
The most common source of CPM miscalculation isn't math — it's inclusion boundaries. Fleets that compare their internal CPM to ATRI benchmarks without understanding what ATRI includes or excludes routinely get misleading comparisons. Here's what the standard definition covers.
- Scheduled preventive maintenance (oil, filters, fluids, lubrication)
- Unscheduled repairs (breakdowns, component failures)
- Parts (OEM and aftermarket)
- Shop labor (internal technicians)
- Outsourced repair labor (dealer, third-party shop)
- Roadside service and mobile repair
- Aftertreatment service (DPF cleaning, DEF system service)
- Diagnostic labor (finding the problem)
- Tires (tracked as separate ATRI category at $0.051/mi)
- Fuel and DEF (separate fuel category)
- Towing and recovery (separate line item)
- Body shop repair (collision, not maintenance)
- Vehicle detailing and washing
- Fleet management software (Category 7 admin)
- Driver bonuses tied to vehicle condition
- Insurance claims for vehicle damage
The exclusions matter as much as the inclusions. A fleet that lumps tires into "maintenance" will report ~$0.28-0.30/mi and think it's underperforming against ATRI's $0.215/mi benchmark. Without the tires, the same fleet might be running $0.23/mi — close to industry average, not below it. Book an HVI demo to see maintenance CPM tracked with ATRI-compliant category structure
The CPM formula — step-by-step derivation
Maintenance cost per mile is elementary arithmetic, but the inputs require discipline. The formula assumes annual data (12-month rolling window) because monthly CPM fluctuates too much with major service events to be useful for benchmarking.
Scheduled PM + unscheduled repair + parts + labor + aftertreatment + diagnostic. Include internal shop time at fully-loaded technician cost, not hourly rate. Exclude tires, fuel, towing.
Use ECM-reported odometer readings, not billing miles or dispatched miles. Include empty miles — a truck accumulates wear whether loaded or not. Rolling 12-month window for stability.
The result is fleet-wide CPM. Compare to ATRI 2025 benchmark of $0.215/mi. Fleet-specific variance drives management decisions — but only if steps 1-2 are done consistently.
Per-truck CPM identifies outliers within the fleet. One truck at 3x fleet-average CPM tells you where to focus. Fleet-wide CPM alone hides the trucks driving variance.
Steps 1-4 executed monthly with rolling 12-month calculations give fleet CFOs the truest reading of maintenance economics. Digital fleet analytics platforms automate all four steps from telematics + work order + parts inventory integrations, eliminating the manual overhead that keeps most fleets from tracking CPM continuously. Start a free trial to see the formula run against your actual fleet data.
The 6 factors that drive maintenance CPM variance
The 60-150% cost gap between top-quartile and bottom-quartile fleets isn't random. Six specific operational factors explain most of the variance, and every one is measurable.
The single biggest CPM driver. Trucks under 5 years old cost roughly $0.11-0.14/mi to maintain. Trucks 5-10 years old cost $0.19-0.26/mi. Trucks over 10 years cost $0.35-0.65/mi — 5.5x the young-fleet baseline per Fleetio's 2025 benchmark data. Fleet-wide CPM tracks fleet age composition more than any other variable.
Fleets running 80%+ planned maintenance vs 20% reactive average $0.14-0.18/mi. Fleets at 50/50 average $0.20-0.24/mi. Fleets running 30% planned / 70% reactive average $0.28-0.35/mi. Reactive repair costs 3-5x more than the same fix caught at scheduled PM.
Long-haul highway operation produces lower CPM than urban stop-and-go or vocational (dump, mixer, refuse). Industry averages: long-haul $0.16-0.20/mi, regional $0.20-0.26/mi, vocational $0.28-0.38/mi. Same truck, same driver, different route — different CPM.
Fleets doing 75%+ of maintenance in-house pay $45-$75/hour in labor. Fleets outsourcing the same work to dealers pay $125-$175/hour. Labor is 40-45% of R&M cost, so the in-house/outsourced mix moves CPM $0.03-0.06/mi.
Fleets running one OEM/model family have lower CPM than fleets running mixed rosters. Parts inventory is smaller and moves faster; technician training is deeper; diagnostic time drops. Typical CPM impact: $0.02-0.04/mi favorable to standardized fleets.
Fleets with 95%+ PM compliance run $0.03-0.06/mi below fleets with 60-70% compliance. Missed PM cascades: skipped oil change → premature engine wear → higher long-term R&M. The compliance rate is the leading indicator; CPM is the lagging indicator.
Each factor is measurable and improvable. Fleets that instrument all six typically move CPM 15-30% below their baseline within 18 months of digital fleet analytics deployment. Start a free trial to instrument all six factors against your baseline.
Reactive vs planned ratio — the hidden CPM driver
Maintenance CPM is a lagging indicator. The leading indicator is the reactive-vs-planned ratio — the percentage of R&M spend going to unscheduled emergency repair versus scheduled preventive service. It's the single strongest predictor of where a fleet's CPM will trend over the next 12 months.
- 80%+ of R&M spend goes to scheduled service caught before failure
- Trucks meet PM at scheduled intervals with 95%+ compliance
- Unplanned downtime under 5% of available equipment hours
- Typical CPM: $0.12-0.18/mi
- Reactive events are caught early — a defect on inspection, not a breakdown roadside
- Roughly balanced planned and reactive maintenance
- PM compliance 70-85% (some skipped services)
- Unplanned downtime 8-12% of available hours
- Typical CPM: $0.20-0.24/mi (ATRI $0.215 sits here)
- Roadside events a routine part of operations, not an emergency
- Majority of R&M spend responds to breakdowns already occurred
- PM compliance under 60%; scheduled services routinely deferred
- Unplanned downtime 15%+ of available hours
- Typical CPM: $0.30+/mi
- Fleet operates in constant firefighting mode; drivers dead-time high
The math is simple: an emergency repair costs 3-5x the same fix caught at scheduled PM. A brake system service on a scheduled PM might run $800-$1,200; the same brake failure at roadside costs $2,400-$6,000 in road service plus dispatch impact plus driver dead-time. Move the reactive ratio down and CPM follows in 6-12 months. Book an HVI demo to instrument reactive-vs-planned ratio per truck and per shop
The 5 highest-leverage CPM reduction strategies
Reducing maintenance CPM is a systematic exercise, not a single action. Five strategies executed together consistently produce the largest CPM improvements in commercial fleets.
Automate PM scheduling from telematics data. Every truck's next service auto-generates the work order when its interval hits. PM compliance climbs from 60-70% under paper to 95%+ within 90 days. Typical CPM impact: $0.03-0.06/mi reduction as reactive events drop.
Track every work order as planned or reactive. Set a fleet-wide target (e.g., "80% planned by Q4"). Publish the number weekly. Fleets that measure and manage this ratio see it improve 8-12 percentage points in year one, with CPM following.
Trading trucks at 5-7 years or 500-700K miles keeps R&M in the low portion of the age curve. Running to 10+ years compounds R&M cost 4-5x. Cycle optimization is where the largest lifetime CPM savings live — a $0.15/mi savings on a 500,000 mile life is $75,000 per truck.
Consolidate to one OEM/model family per duty profile. Parts inventory shrinks; technician training deepens; diagnostic time drops. Not always possible for large mixed fleets, but where achievable produces $0.02-0.04/mi durable savings.
Fleet-wide CPM averages hide the trucks driving variance. Identify units at 2x fleet-average CPM and either service intensively, replace, or reassign to lower-duty routes. Per-truck focus reduces fleet-wide CPM 8-15% within 12 months.
Every strategy on the list is simultaneously executable. Fleets deploying all five typically see cumulative CPM reduction of 25-35% within 24 months — on a fleet at industry average, that's $0.05-0.08/mi or $6,000-$10,000 per truck per year. Book an HVI demo to model CPM reduction scenarios for your fleet
When maintenance CPM is misleading — 4 edge cases
CPM is the industry-standard metric, but it has edge cases where the number can mislead executive decisions. Understanding when CPM breaks down is what separates sophisticated fleet management from naive KPI tracking.
A fleet of brand-new trucks under warranty shows extremely low CPM ($0.06-0.12/mi) because major components are covered. This is temporary; CPM will rise as warranty expires and normal wear begins. Comparing year-1 CPM to ATRI benchmarks under-states the fleet's future maintenance cost profile. Solution: model lifetime CPM across 7-year horizon, not just current-year.
A fleet cutting PM to hit a Q3 cost target artificially depresses CPM in the reporting period. The deferred wear catches up in Q1-Q2 next year with elevated reactive repair. Solution: track deferred PM as a separate line item and reconcile actuals against schedule to catch pattern.
A truck sitting parked for months (customer route lost, driver assignment gap) still incurs some maintenance cost but produces no miles. CPM approaches infinity. Solution: exclude trucks under a utilization threshold (e.g., minimum 5,000 miles/quarter) from fleet CPM calculation or track per-day cost instead.
A $28,000 engine overhaul on one truck adds significantly to a small fleet's annual R&M spend, spiking CPM for that year even if underlying maintenance discipline is strong. Solution: track capitalized major repairs separately from routine R&M; report both figures for board-level visibility.
Understanding the four edge cases turns CPM from a raw number into a diagnostic instrument. Fleet CFOs who report CPM alongside supporting metrics (fleet age distribution, planned/reactive ratio, deferred PM backlog, utilization outliers) present a defensible economic picture that boards trust.
From a Director of Maintenance running 240 tractors across multi-state operations
Our maintenance CPM was $0.28 per mile when I took over. Board was asking why we were 30% above ATRI benchmark. First thing I did was audit what we were counting — turned out we were including tires ($0.06/mi) and roadside towing in "maintenance." Reclassifying to ATRI-standard categories immediately dropped reported CPM to $0.22 — still above benchmark but not by 30%.
Then we tackled the real problem: reactive ratio was 58%. Digital PM platform with hour/mile-triggered work orders got us to 26% reactive within a year. CPM dropped from $0.22 to $0.185 in year two — below ATRI's $0.215 benchmark. Half the improvement was measurement discipline; half was operational. Neither works without the other.
Frequently asked questions
What's the industry-average fleet maintenance cost per mile in 2025?
The 2026 ATRI Analysis of the Operational Costs of Trucking (analyzing 2025 data across 178,091 Class 8 trucks and 14.08 billion miles) sets the industry-average maintenance cost per mile at $0.215 — up 8.6% from $0.198 per mile in 2024. This represents approximately 8.9% of total operating costs and equates to roughly $16,200 per heavy-duty truck per year at industry-average utilization. The ATRI benchmark covers parts, shop labor (in-house and outsourced), aftertreatment service (DPF cleaning, DEF system), diagnostic labor, and roadside repair — but excludes tires (tracked separately at $0.051/mi), towing and recovery, fuel, and body shop / collision repair. Fleets comparing internal CPM to the ATRI benchmark should verify their calculation uses the same inclusion boundaries. Top-quartile fleets consistently hit $0.12-$0.18 per mile through PM discipline and fleet-age management. Bottom-quartile fleets exceed $0.30 per mile driven primarily by aging equipment and high reactive-repair ratios. The 60-150% gap between top and bottom quartile fleets is the largest single opportunity in fleet cost management — larger than fuel economy programs, larger than driver retention programs, larger than insurance premium optimization on a per-mile basis. Regional operating environment also affects CPM: fleets operating primarily in the Northeast run 12-18% higher CPM than fleets in the South Central US due to weather stress on equipment, toll structures, and dealer labor rates.
How do I calculate my fleet's maintenance cost per mile correctly?
Maintenance CPM equals total annual R&M costs divided by total annual fleet miles, calculated on a rolling 12-month window for stability. Step 1: Sum all R&M line items across the fleet — scheduled PM, unscheduled repair, parts (OEM and aftermarket), shop labor (internal at fully-loaded technician cost, external at invoiced rate), aftertreatment service, diagnostic labor, and roadside repair. Include internal shop time as a real cost, not just direct labor — a $28/hr technician at fully-loaded cost with benefits, tools, and shop overhead runs $55-75/hr; using the wage rate alone under-reports true CPM by 30-40%. Step 2: Exclude tires (industry standard tracks separately at $0.051/mi), fuel and DEF (separate category), towing and recovery (separate line item), body shop / collision repair (not maintenance), vehicle detailing, fleet management software, and insurance claims for vehicle damage. Step 3: Sum all fleet miles from telematics ECM-reported odometer readings. Do not use billing miles, dispatched miles, or estimated miles — telematics odometer is the only defensible source. Include empty miles because trucks accumulate wear whether loaded or not. Use rolling 12-month window (not calendar year) for stability. Step 4: Divide costs by miles. Step 5: Also calculate per-truck CPM to identify outlier equipment driving fleet variance. Fleet-wide CPM plus per-truck CPM together give management the diagnostic picture needed for decisions. Digital fleet analytics platforms automate all five steps from telematics + work order + parts inventory integrations.
How does fleet age affect maintenance cost per mile?
Fleet age is the single biggest driver of maintenance CPM variance. Fleetio's 2025 benchmark data documents that CPM increases 35% for vehicles over 10 years old versus vehicles under 5, and industry data consistently shows an even steeper curve at extreme ages. Rough breakdown by truck age: Years 0-2 (under warranty): $0.06-0.11 per mile — major components covered, only routine PM out-of-pocket. Years 3-5 (post-warranty, low mileage): $0.12-0.17 per mile — normal wear items begin failing, but powertrain remains reliable. Years 6-8 (mid-life): $0.18-0.26 per mile — aftertreatment service cycles begin, injectors and turbos start requiring attention. Years 9-11 (aging): $0.28-0.42 per mile — major component overhauls likely, powertrain repair costs accelerate. Years 12+ (end-of-life): $0.45-0.75 per mile — trucks approach or exceed cost-to-replace on the year, reactive repair dominates spend. The curve isn't linear; it accelerates. This is why replacement cycle optimization is the single most valuable fleet CFO decision. Trading trucks at the 5-7 year / 500-700K mile inflection point keeps fleet-wide CPM in the low-cost portion of the age curve. Running to 10+ years accepts high R&M in exchange for lower equipment payment cost, but the R&M premium usually exceeds the payment savings. Fleet CFOs should model expected CPM by truck-year across the fleet's age distribution to project multi-year maintenance budgets accurately.
What's the reactive-vs-planned ratio and how does it affect CPM?
The reactive-vs-planned ratio measures what percentage of R&M spend responds to breakdowns already occurred versus scheduled preventive service caught before failure. It's the strongest leading indicator of where CPM will trend over the next 12 months. Top-quartile fleets: under 20% reactive — 80%+ of R&M spend goes to scheduled service. PM compliance 95%+. Unplanned downtime under 5% of available hours. CPM typically $0.12-0.18 per mile. Industry-average fleets: 30-45% reactive. PM compliance 70-85%. Unplanned downtime 8-12%. CPM $0.20-0.24 per mile — ATRI's $0.215 benchmark sits in this zone. Bottom-quartile fleets: 55%+ reactive. PM compliance under 60%. Unplanned downtime 15%+. CPM exceeds $0.30 per mile. The economic math is severe: an emergency repair costs 3-5x the same fix caught at scheduled PM. A brake system service on a scheduled PM might run $800-$1,200; the same brake failure roadside costs $2,400-$6,000 in road service plus dispatch impact plus driver dead-time plus potential customer service failure. Move the reactive ratio down and CPM follows in 6-12 months. This is why digital PM platforms with hour/mile-triggered work orders produce the largest measurable CPM improvements — they mechanically shift the reactive/planned mix by making scheduled service the default and reactive the exception. Fleet management platforms that don't track the reactive/planned ratio explicitly are missing the leading indicator that predicts CPM direction.
Is fleet maintenance CPM the same for long-haul vs regional vs vocational fleets?
No — duty cycle materially affects maintenance CPM, and fleet CFOs comparing performance across segments need duty-cycle-specific benchmarks rather than blanket ATRI averages. Long-haul (over-the-road, primarily highway operation): typical CPM $0.16-0.20 per mile. Steady-state highway operation produces the lowest per-mile maintenance cost because the powertrain runs at optimal RPM band, thermal cycling is minimal, and brake usage is light. Regional (dedicated routes, mixed highway and city): typical CPM $0.20-0.26 per mile. More start-stop cycles, more brake usage, more transient loads on aftertreatment. Less-than-truckload (LTL, high stop-count): typical CPM $0.22-0.28 per mile. Extreme stop-and-go, curbside operation, tighter driving environments cause elevated brake and body wear. Vocational (dump, mixer, refuse, construction): typical CPM $0.28-0.38 per mile. Off-highway operation, extreme load cycles, extended PTO idle time, and harsh operating environments produce the highest per-mile maintenance cost. Refrigerated: typical CPM $0.22-0.28 per mile — additional trailer reefer unit maintenance adds to the total. Owner-operator small fleets: typical CPM $0.20-0.28 per mile — higher outsourced labor rates offset by strong PM discipline. Fleet CFOs benchmarking across segments should segment their own fleet by duty cycle and compare each segment to its appropriate industry benchmark rather than fleet-average against ATRI's blended $0.215 figure — which is dominated by long-haul truckload operations and can mislead multi-segment carriers.
Every truck. Every work order. Every mile — CPM in real time.
HVI's fleet analytics module ships with maintenance CPM tracking pre-configured to ATRI-standard category boundaries. Fleet-wide CPM benchmarked against 2026 ATRI report; per-truck CPM identifies outlier equipment driving variance; reactive-vs-planned ratio tracked automatically from work order classification. Executive dashboards deliver the CFO metric without spreadsheets. Live for your fleet in under three weeks — typical result: 15-25% CPM reduction within 18 months of deployment.
ATRI 2026 benchmark integration · Reactive/Planned ratio · Per-truck CPM · SOC 2 Type II