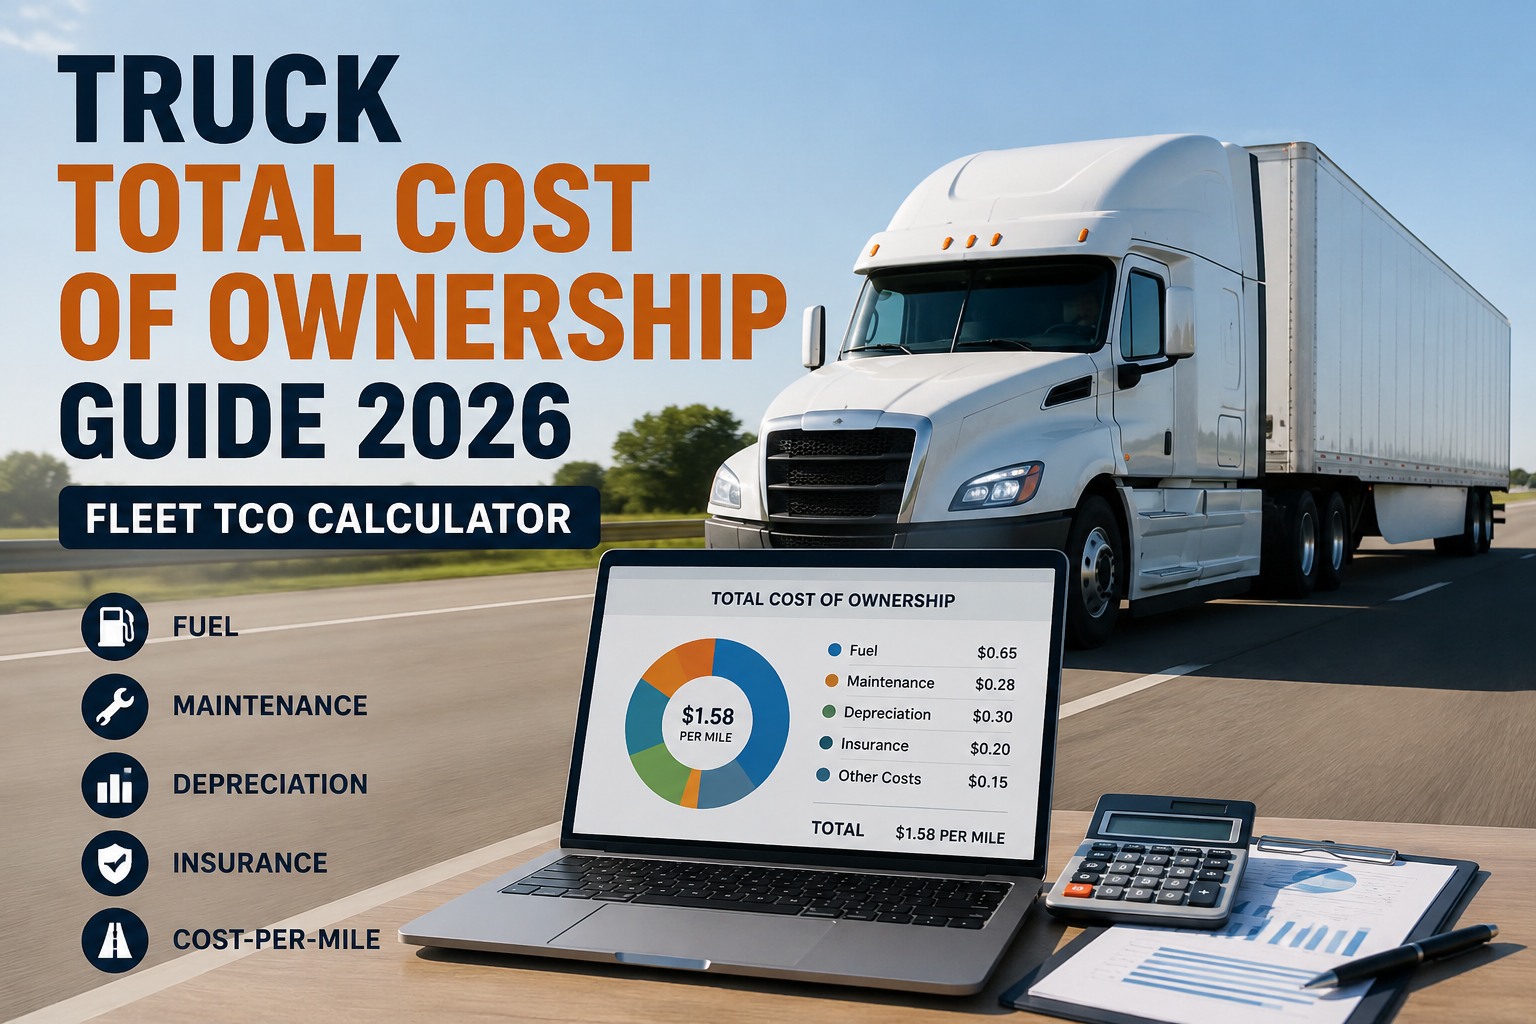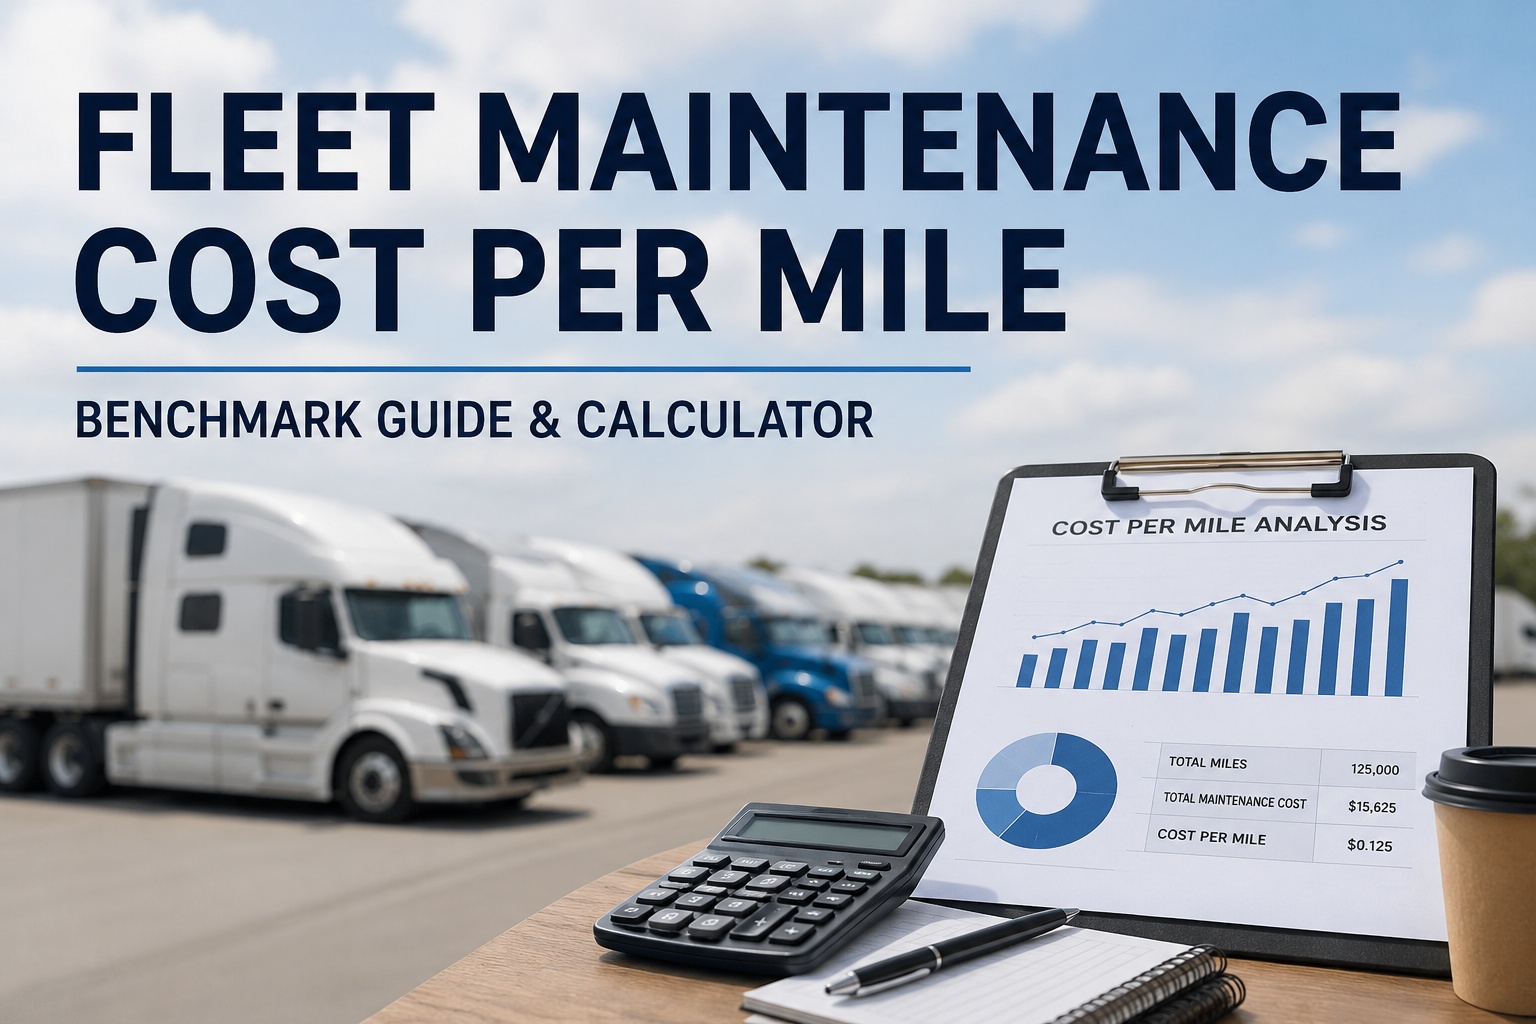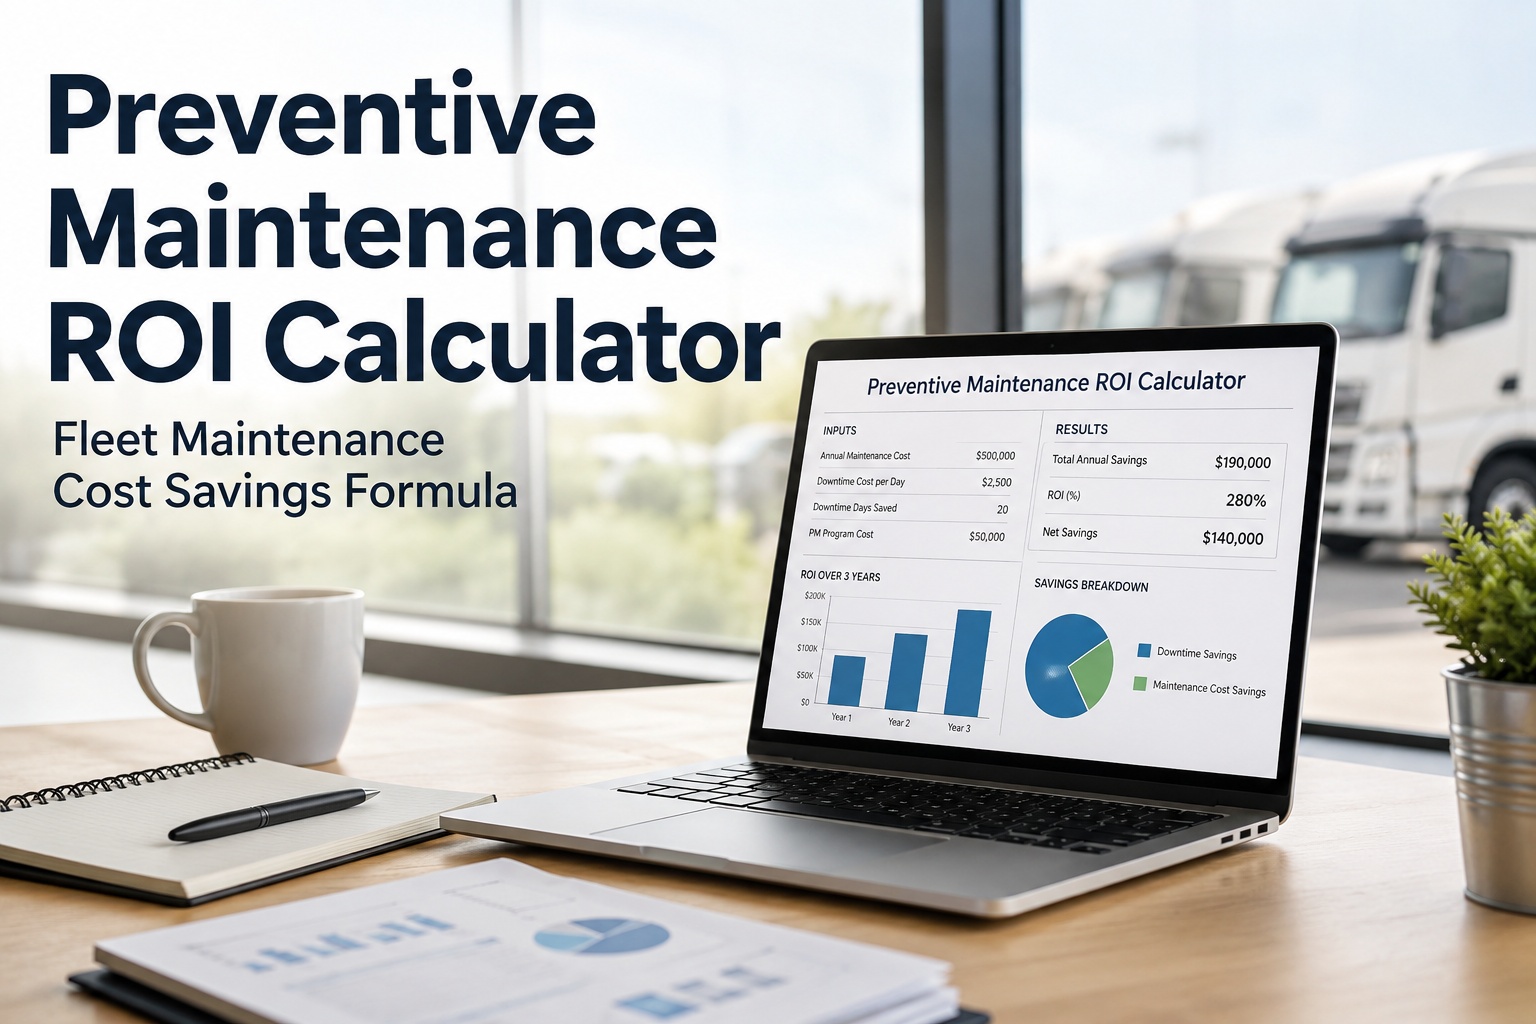
Heavy truck total cost of ownership breaks down into seven cost categories that ATRI benchmarks annually across 178,091+ Class 8 trucks. In 2025 the industry-average TCO hit $2.336 per mile — the highest per-mile cost ATRI has ever recorded. Fleet CFOs who understand the breakdown make smarter capital deployment decisions than those who focus only on purchase price. Book an HVI demo for real-time fleet TCO visibility.
Seven cost categories. One total. $280,320 per truck per year.
The 2024 industry-average Class 8 truck running 120,000 miles/year at $2.336/mile hits $280,320 in operating cost. Understanding the breakdown is where fleet economics start.
Wages plus benefits. Largest single line item. Rose 2.4% in 2024.
Fell 13% in 2024 from record 2022 peak. Still ~10¢ higher than 2019.
Record high in 2024. Up 8.3% year-over-year. Up 70% vs 2015.
Fell 2% in 2024 as replacement cycle tightened to 7.3 years.
Rose 3% in 2024. Record high. Nuclear verdict environment.
Record high in 2024. Retreads reduce this ~40% for drive/trailer.
Tolls set new record in 2024. Fuel tax subject to state variance.
The TCO formula defined — what fleet CFOs need to know
Total cost of ownership is the sum of all costs associated with acquiring, operating and disposing of a heavy truck across its useful life. Purchase price is a single-line item and typically represents 8-12% of lifetime cost — the remaining 88-92% is where fleet economics actually happen.
The industry-standard TCO formula breaks operating costs into per-mile line items that can be benchmarked against ATRI data. Every fleet has its own cost structure, but understanding the industry-average provides the reference point against which fleet-specific performance is measured.
A new Class 8 tractor costs $150,000-$200,000. Over 7.3 years of operation at 120,000 mi/yr = 876,000 miles, that same truck costs $2,046,000 to operate. Purchase price is 7-10% of lifetime cost. CFOs who negotiate hard on purchase price and lose sight of the other 90%+ optimize the wrong variable.
Fleet of 10 trucks and fleet of 1,000 trucks can compare TCO directly on a per-mile basis. Total fleet cost divides by total fleet miles and produces a comparable metric. This is why ATRI publishes on per-mile basis and why fleet CFOs benchmark that way.
Deferred maintenance increases fuel consumption. Underinflated tires wear brakes faster. Old trucks with high R&M costs also have higher insurance rates due to breakdown-related incidents. TCO categories are not independent variables.
Driver compensation at 43.8% of TCO dwarfs every other line item. But driver performance also drives fuel efficiency, tire wear, brake life, and incident rates. Investing in driver quality often produces better TCO returns than optimizing any equipment category.
Understanding these four principles before diving into individual cost categories is what separates strategic TCO thinking from tactical cost management. Book an HVI demo to see fleet-wide TCO analytics across all seven categories
Cost Category 1 — Driver Compensation (43.8% of TCO)
Driver wages plus benefits combine to form the single largest TCO line item at 43.8% of total operating cost. ATRI's 2025 report shows wages rose 2.4% in 2024 (half a point below inflation) while benefits rose 4.8% to a new record. Total driver compensation now runs $1.02+ per mile at the industry average.
- Base wages — typically $0.55-$0.75 per mile for solo OTR drivers depending on experience and fleet
- Bonuses & incentives — safety, on-time delivery, fuel economy, tenure bonuses adding $0.05-$0.15 per mile
- Health insurance — employer contribution typically $0.08-$0.12 per mile
- Retirement contribution — 401(k) match typically $0.02-$0.04 per mile
- Payroll taxes — FICA/Medicare typically $0.06-$0.09 per mile
- Workers compensation insurance — typically $0.03-$0.05 per mile
- Paid time off — vacation and sick pay typically $0.02-$0.04 per mile
Driver retention is the primary lever. Turnover costs $10,000-$25,000 per driver in recruiting, training, and reduced productivity during onboarding. Fleet with 100% annual turnover pays 2-3x the retention cost of a fleet with 30% turnover, even at the same wage scale. Second lever: driver performance improvement programs (fuel economy, safety, on-time) that produce measurable per-mile savings across other cost categories.
Cost Category 2 — Fuel (21.3% of TCO)
Fuel is the second-largest and most volatile TCO line item. ATRI reports fuel costs fell 13% in 2024 from the 2022 record peak, but at $0.498 per mile still runs 20-25% higher than pre-pandemic norms. On a 120,000 mi/yr operation, fuel represents $59,700+ annually per truck.
- Diesel price per gallon — primary variable, tracks EIA weekly reports; 2024 average ~$3.50-$4.00/gal
- Miles per gallon (MPG) — fleet average 6.5 MPG; efficient long-haul units achieve 7.5-8.5 MPG
- Idle fuel consumption — typical 0.8 gal/hr; hoteling idle at rest breaks adds $2,000-$4,000/yr
- DEF consumption — typically 2-3% of diesel volume; adds $0.02-$0.03 per mile
- Fuel discount programs — fleet purchasing programs typically save $0.02-$0.05 per gallon
- Route efficiency — empty miles (currently 16.7% industry average) directly translate to fuel cost
MPG improvement is the highest-leverage lever. A 0.5 MPG improvement (say 6.5 to 7.0 MPG) reduces fuel cost by 7.1% or approximately $4,200 per truck per year on a 120,000-mile operation. Levers include: aerodynamic add-ons (skirts, tails, gap reducers), engine management (idle limits, cruise control discipline), tire pressure discipline, driver performance coaching, and route optimization to reduce empty miles. Auxiliary Power Units (APUs) reduce hoteling idle by 60-80%. Book an HVI demo to see fuel benchmark analytics by driver and route
Cost Category 3 — Repair & Maintenance (8.5% of TCO)
Repair and maintenance combines scheduled PM with unscheduled repairs. ATRI reports R&M costs fell 2% in 2024 to $0.198 per mile, correlating with the industry-wide replacement cycle tightening to 7.3 years. Younger fleets have lower R&M costs because major component failures haven't yet accumulated.
- Scheduled PM — oil changes, filters, fluids, chassis lubrication; typically 30-40% of R&M spend
- Wear items — brakes, clutches, batteries; typically 15-20% of R&M spend
- Powertrain repair — engine, transmission, driveline; typically 20-25% of R&M spend
- Aftertreatment service — DPF, DEF, SCR, DOC; typically 8-12% of R&M spend
- Electrical & electronics — sensors, ECMs, wiring; typically 8-10% of R&M spend
- Cab & body repair — interior, exterior, minor collision; typically 5-8% of R&M spend
- Diagnostic labor — shop time to identify problems; typically 10-15% of R&M spend
PM discipline is the primary lever. Fleets with 95%+ PM compliance have R&M costs 30-40% below fleets with 60-70% compliance because scheduled service prevents catastrophic failure. Second lever: replacement cycle optimization. Trading trucks at 400,000-500,000 miles keeps R&M in the low-cost portion of the life curve; running to 800,000+ miles accepts high R&M in exchange for lower payment costs. Digital PM platforms with hour/mile-triggered work orders typically reduce R&M spend 15-25% by eliminating over-service and under-service simultaneously.
Cost Category 4 — Truck & Trailer Payments (16.7% of TCO)
Truck and trailer payment costs hit a record $0.39 per mile in 2024, up 8.3% year-over-year and 70% versus 2015. This category includes purchase financing, leasing costs, and depreciation of owned equipment. It is now the third-largest TCO line item after driver compensation and fuel.
- Purchase financing — principal & interest on financed equipment; typical 5-year note at 6-9% APR
- Operating lease payments — monthly rent for leased equipment; typically 3-5 year terms
- Depreciation on owned equipment — typically 20-25% year 1, 15-18% year 2, 10-12% years 3-7
- Residual value at trade-in — typically 20-30% of purchase price at 7-year replacement cycle
- Interest rate exposure — variable-rate financing exposes fleet to Fed rate changes
- Fleet age composition — average fleet age drives depreciation curve exposure
Fleet age optimization is the primary lever. Trading at 7 years or 700,000 miles typically produces the lowest lifecycle cost by balancing depreciation curve, R&M cost curve, and residual value. Buying used at 3-4 years can reduce payment costs but increases R&M costs. Second lever: financing structure optimization — balloon payments, lease-to-own conversions, and manufacturer captive financing programs can meaningfully affect per-mile equipment cost. Third lever: fleet standardization — running one OEM/model family reduces parts inventory, technician training, and fleet management complexity.
Cost Category 5 — Insurance Premiums (4.6% of TCO)
Insurance premiums hit a record high in 2024, rising 3% year-over-year to $0.108 per mile. Nuclear verdicts (jury awards exceeding $10 million against motor carriers) have driven excess liability pricing to unsustainable levels for many small and mid-size fleets. Insurance is now a strategic TCO variable, not a fixed cost.
- Primary auto liability — typically $2,500-$4,500 per truck per year for $1M limit
- Excess liability — layers above $1M primary; increasingly expensive due to nuclear verdicts
- Physical damage / collision — typically 3-5% of stated value annually
- Cargo insurance — typically $500-$1,500 per truck depending on cargo type
- Workers compensation — driver injury coverage; varies by state and claim history
- General liability — non-auto coverage for facilities, operations, cyber
CSA score management is the primary lever. Fleets with clean CSA BASIC scores across all seven categories qualify for preferred insurance markets and 15-30% lower premiums than fleets with elevated Vehicle Maintenance or Unsafe Driving scores. Second lever: driver-specific safety programs — camera systems, driver coaching, telematics-based scoring — that reduce accident frequency and severity. Third lever: risk retention structures for larger fleets — captive insurance, self-insured retentions above $250K per claim — that reduce premium in exchange for balance sheet exposure.
Cost Category 6 — Tires (2.2% of TCO)
Tires set a new record high in 2024 as raw material costs, tariff exposure, and premium OTR mining tire pricing pushed the industry average to $0.051 per mile. Tire economics are position-specific — steer tires typically require premium quality, drive/trailer tires can use retreads for meaningful savings.
- New steer tires — premium virgin required; $500-$700 each; 130,000-160,000 mi life
- New drive tires — premium or standard; $400-$550 each; 200,000-250,000 mi life
- New trailer tires — economy acceptable; $250-$450 each; 250,000-300,000 mi life
- Retread drive tires — 40-50% of new tire cost; 150,000-200,000 mi additional life
- Retread trailer tires — 30-40% of new tire cost; 200,000-250,000 mi additional life
- Alignment & rotation — $50-$150 per service; extends tire life 15-25%
Retread program adoption is the primary lever for fleets running drive and trailer tires. Migrating a fleet from all-new to a properly-executed retread program on drive/trailer positions reduces tire cost per mile 30-40% while maintaining safety. Second lever: tire pressure discipline — a 10% under-inflation reduces tire life 25% and fuel economy 3-5%. Third lever: alignment programs that catch dogtracking and camber wear early. Fourth lever: driver behavior programs targeting excessive scrubbing (aggressive cornering, hard braking).
Cost Category 7 — Permits, Tolls, and Administration (2.9% of TCO)
The catch-all category covers costs that don't fit into the primary six but collectively represent $0.068 per mile at the industry average. Tolls set a new record high in 2024 as public infrastructure funding shifts increasingly to user-fee models.
- Tolls — record high in 2024; heavy exposure on East Coast and Chicago routes
- Fuel taxes — federal + state + IFTA reporting; varies by route composition
- Vehicle registration & permits — IRP, overweight permits, oversize permits
- Federal Heavy Vehicle Use Tax — annual $550 per Class 8 truck
- Compliance software & systems — ELD, DVIR, dispatch, fleet management
- Administrative overhead — dispatch, safety, HR, back-office allocation
Route optimization is the primary lever for tolls. Freight lanes with toll-heavy routes cost $0.15-$0.35 per mile in tolls alone on the East Coast; alternative routes may add 30-60 minutes but save meaningful cost. Second lever: state-level fuel tax base planning through IFTA optimization — matching fuel purchase state to reporting state reduces net tax liability. Third lever: consolidating compliance software onto integrated platforms rather than paying per-module — a fleet running separate ELD, DVIR, fuel-card, and PM systems typically pays 2-3x what integrated platforms cost. Book an HVI demo to consolidate PM, DVIR, and fleet analytics onto one platform
Calculating cost per mile — the derivation
Cost per mile is the single most important TCO metric because it normalizes across fleet sizes, truck types, and operating regions. The derivation is simple algebra but the inputs matter.
The example fleet matches the ATRI industry benchmark exactly. Real fleets show variance in both directions — efficient long-haul operations run $2.10-$2.20 per mile; regional stop-and-go operations run $2.45-$2.65 per mile. Fleet-specific benchmarking against industry average reveals where cost management focus should land. Book an HVI demo to see your fleet's TCO plotted against ATRI benchmark per category
The other benchmarking dimension that matters is regional variance. ATRI 2025 data documents Northeast operating costs 16.8% higher than South Central per mile, driven by toll structures, insurance environment, wage market pressure, and fuel price differentials. Fleets operating cross-region need per-lane cost visibility to price freight correctly — a rate that produces margin on Chicago-Dallas fails on Boston-Philadelphia at the same nominal rate per mile.
Repair vs replacement — the decision framework
The single most consequential TCO decision is when to replace an aging truck versus continuing to repair it. Wrong-way decisions cost fleets $30,000-$80,000 per truck over the remaining useful life. The framework below combines age, mileage, and repair-to-book-value ratio into a decision matrix.
The matrix collapses complex decisions into a defensible framework: young trucks warrant repair even at high absolute cost; old trucks with any significant repair require replacement analysis. The EVALUATE cells trigger deeper analysis including remaining useful life, resale market conditions, driver assignment, and route criticality. Try HVI free to model repair-vs-replacement scenarios per truck in your fleet.
The 5 highest-leverage TCO reduction strategies
Beyond category-specific levers, five cross-cutting strategies consistently produce the largest TCO improvements when executed properly.
Turnover costs $10,000-$25,000 per driver in recruiting, training, and productivity loss. A fleet reducing turnover from 90% to 45% on 200 drivers saves $900K-$2.25M annually. Retention pays for meaningful wage increases and still improves TCO.
95%+ PM compliance reduces R&M costs 30-40% and reduces unplanned downtime 60-70% versus 60-70% compliance. Both effects compound: fewer breakdowns mean less driver dead-time, fewer customer service failures, fewer insurance claims.
Every 0.5 MPG improvement reduces fuel cost 7-8% or approximately $4,000 per truck per year. Levers include driver coaching, aerodynamic add-ons, tire pressure discipline, idle limitation, and route optimization to reduce empty miles.
Clean CSA scores across all seven BASICs unlock preferred insurance markets and 15-30% premium reductions. On a fleet paying $0.108/mi in insurance, a 20% reduction is $2,592 per truck per year and eliminates nuclear-verdict litigation exposure.
Trading at the 7-year / 700,000-mile industry standard typically produces the lowest lifecycle cost. Deviating either direction (shorter for lower R&M, longer for lower payment) requires per-truck analysis. Fleet-wide policy decisions here move millions of dollars.
Every strategy on the list is more valuable to fleet TCO than the negotiated purchase price on the next truck order. CFOs who focus on the five strategies routinely outperform peer fleets on operating margin regardless of the freight cycle. Start a free trial to instrument all five strategies against your fleet's specific TCO baseline.
From a CFO managing a 420-truck TL carrier
We ran a 420-truck fleet at $2.42 per mile for years and thought that was normal. Board would ask about our operating margin and we'd point to fuel prices, driver market, insurance environment — all the external factors that everyone in trucking cites. When we finally instrumented TCO by category across the fleet, we discovered our R&M was $0.243 per mile vs ATRI's $0.198 benchmark. That's $0.045 per mile of avoidable cost — $270,000 per year on our fleet.
We tightened the PM program, moved to digital work orders with hour-triggered scheduling, and cut unplanned downtime 44% in year one. R&M came down to $0.203 per mile. Fuel and driver comp didn't move much — those were market-driven — but the R&M line item alone saved us $240K+ in year one, and insurance came down another $180K in year two once CSA scores improved from the reduced breakdown-related incidents. TCO visibility is what turned a $2.42/mile fleet into a $2.28/mile fleet. Same trucks. Same drivers. Different management.
Frequently asked questions
What's the current industry-average total cost of ownership for a heavy truck?
The 2025 ATRI benchmark (published in the 2026 Analysis of the Operational Costs of Trucking report) is $2.336 per mile — the highest per-mile cost ATRI has ever recorded across its analysis history covering 178,091+ Class 8 trucks and 14.08 billion miles. Excluding fuel, non-fuel operational costs rose 4.2% to $1.854 per mile. On a Class 8 truck running 120,000 miles per year, this equates to approximately $280,320 in annual operating cost. The cost breaks into seven categories: driver compensation 43.8% ($1.023/mi), fuel 21.3% ($0.498/mi), truck and trailer payments 16.7% ($0.390/mi), repair and maintenance 8.5% ($0.198/mi), insurance premiums 4.6% ($0.108/mi), tires 2.2% ($0.051/mi), and permits/tolls/admin 2.9% ($0.068/mi). Individual fleet performance varies significantly from the industry average based on operating region (Northeast costs 16.8% higher than South Central), duty cycle (long-haul lower than regional), fleet age composition, and management discipline across the seven categories. Efficient long-haul operations run $2.10-$2.20 per mile; regional stop-and-go operations run $2.45-$2.65 per mile. Fleet CFOs benchmarking against the industry average identify where their cost structure deviates and where TCO management focus should land.
How do I calculate my fleet's cost per mile?
Cost per mile equals total fleet operating costs divided by total fleet miles, calculated annually for the most stable benchmark. Sum all seven cost categories over the calendar year: driver wages plus benefits, fuel plus DEF, truck and trailer payments or depreciation on owned equipment, repair and maintenance including PM and unplanned repair, insurance premiums across primary auto liability plus excess plus physical damage plus cargo, tire costs including new plus retread plus alignment, and permits/tolls/administrative overhead. Divide by total fleet-wide miles driven over the same period. The resulting per-mile cost is directly comparable to ATRI's industry benchmark of $2.336 for 2025 data. Fleet-specific variance from benchmark reveals cost management opportunity: costs above benchmark identify optimization targets; costs below benchmark identify strategic advantages worth protecting. For meaningful benchmarking, track per-mile costs at three levels: fleet-wide (compares to ATRI), by duty cycle (compares within regional/OTR/vocational segments), and per truck (identifies outlier equipment or drivers driving cost variance). Digital fleet analytics platforms automate cost-per-mile calculation from telematics, fuel card, insurance, and financial system integrations — eliminating the manual overhead of monthly CPM reporting while providing continuous rather than quarterly visibility.
When is it time to replace a truck instead of repairing it?
The industry-standard framework combines truck age, accumulated mileage, and current repair cost as a percentage of remaining book value. Three simplifying rules cover most decisions. Rule 1: A repair costing more than the truck's book value is always a replace decision — no exceptions. Rule 2: A truck at 7+ years or 700,000+ miles facing a repair over 50% of book value is a replace decision because you're funding depreciation on the residual value that repair adds. Rule 3: A truck under 4 years or 400,000 miles is typically a repair decision unless the repair is catastrophic (engine, transmission, or frame damage over 100% of book value). Between these clear zones is the "evaluate" zone requiring per-truck analysis including remaining useful life projection, current used-Class 8 market pricing, replacement equipment availability, driver assignment continuity, and route-criticality of the specific truck. The industry-average replacement cycle is currently 7.3 years — a decrease from 7.5 years in 2023 driven by carriers trading trucks sooner to lock in residual value and reduce R&M exposure on aging equipment. Fleets that manage replacement decisions data-driven rather than reactively typically save $30,000-$80,000 per truck over remaining useful life. Digital fleet analytics platforms with lifecycle cost curves per truck automate the repair-vs-replace analysis and produce defensible recommendations that finance committees can review.
Which TCO category offers the biggest cost reduction opportunity?
Driver compensation at 43.8% of TCO is the largest single line item, but it's also the least discretionary because driver market wages are externally set. The highest-leverage reduction opportunities are in the mid-size categories where fleet management discipline can move the needle meaningfully. Repair and maintenance at 8.5% of TCO is typically the highest-leverage category for CFO focus. Fleets with 60-70% PM compliance typically run 30-40% higher R&M costs than fleets with 95%+ compliance, because scheduled service prevents catastrophic failure. Moving from 65% PM compliance to 95% compliance on a fleet with $0.24/mi R&M reduces it to approximately $0.20/mi — that's $4,800 per truck per year on a 120,000-mile operation. Fuel at 21.3% of TCO is the second-highest-leverage category because MPG improvement compounds directly: every 0.5 MPG improvement reduces fuel cost 7-8% or $4,000 per truck per year. Insurance at 4.6% of TCO is a strategic leverage point because CSA score management unlocks 15-30% premium reductions worth $2,000-$3,500 per truck per year for fleets that qualify. The right approach is a portfolio strategy: fleet management focuses on driver retention (largest category), PM discipline (highest R&M leverage), fuel economy programs (highest fuel leverage), and CSA score maintenance (insurance leverage) simultaneously. Fleets executing on all four levers typically move overall TCO 5-8% below industry benchmark within 24 months.
Do fleet management software costs count in TCO?
Yes. Fleet management software (CMMS, DVIR platforms, ELD systems, dispatch, fleet analytics, telematics) falls into Category 7 (Permits, Tolls, and Administration) at typical annual cost of $200-$800 per truck depending on the platform stack. On a per-mile basis this represents approximately $0.002-$0.007 per mile — well under 1% of total TCO. The economically important question isn't whether software counts (it does, as a cost) but whether software delivers measurable reduction in other cost categories. Digital PM platforms reducing R&M spend by 15-25% return their cost 30-50x on the R&M line item alone. Telematics platforms enabling fuel economy programs that improve MPG by 0.3-0.5 return their cost multiple times over on fuel. CSA score management systems reducing insurance premiums by 15-30% pay for themselves in the first year on that line item. The ROI framing that matters for CFO decision-making isn't "what does the software cost" but "what does the software prevent in avoidable cost across the six much-larger TCO categories." Fleets that treat software spend as a category-7 cost line item and evaluate it purely on price tend to underinvest in the exact platforms that could reduce their overall TCO 5-10% — a rounding error saved on category-7 spend costs meaningfully more than the savings in categories 1-6 combined.
Every category. Every truck. Every mile — benchmarked against ATRI in real time.
HVI's fleet analytics module ships with all seven TCO cost categories pre-configured and ATRI-benchmarked. Executive dashboards show fleet-wide cost per mile against 2025 ATRI averages; drill-down views identify outlier trucks and drivers driving cost variance. Fuel, R&M, tires, permits, and insurance data pull from telematics, fuel card, and financial system integrations automatically. Repair-vs-replace analysis runs per truck with lifecycle cost curves. Live for your fleet in under three weeks — typical CFO result: 5-8% TCO reduction within 24 months of deployment.
ATRI benchmark integration · Executive dashboards · Repair-vs-replace analysis · SOC 2 Type II