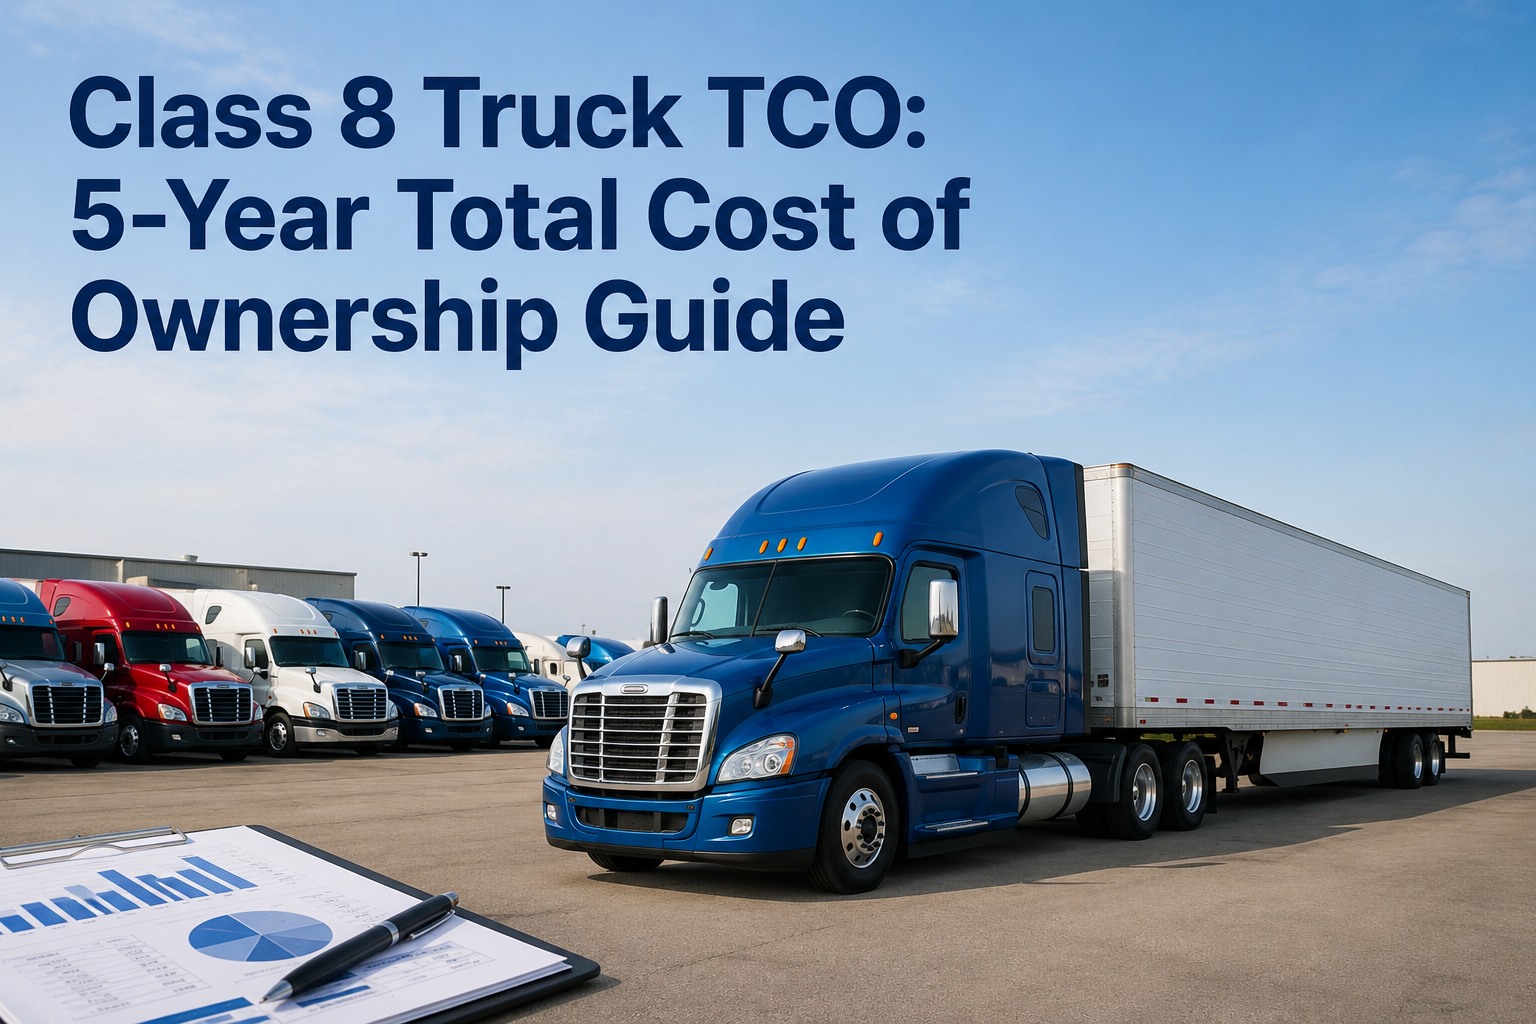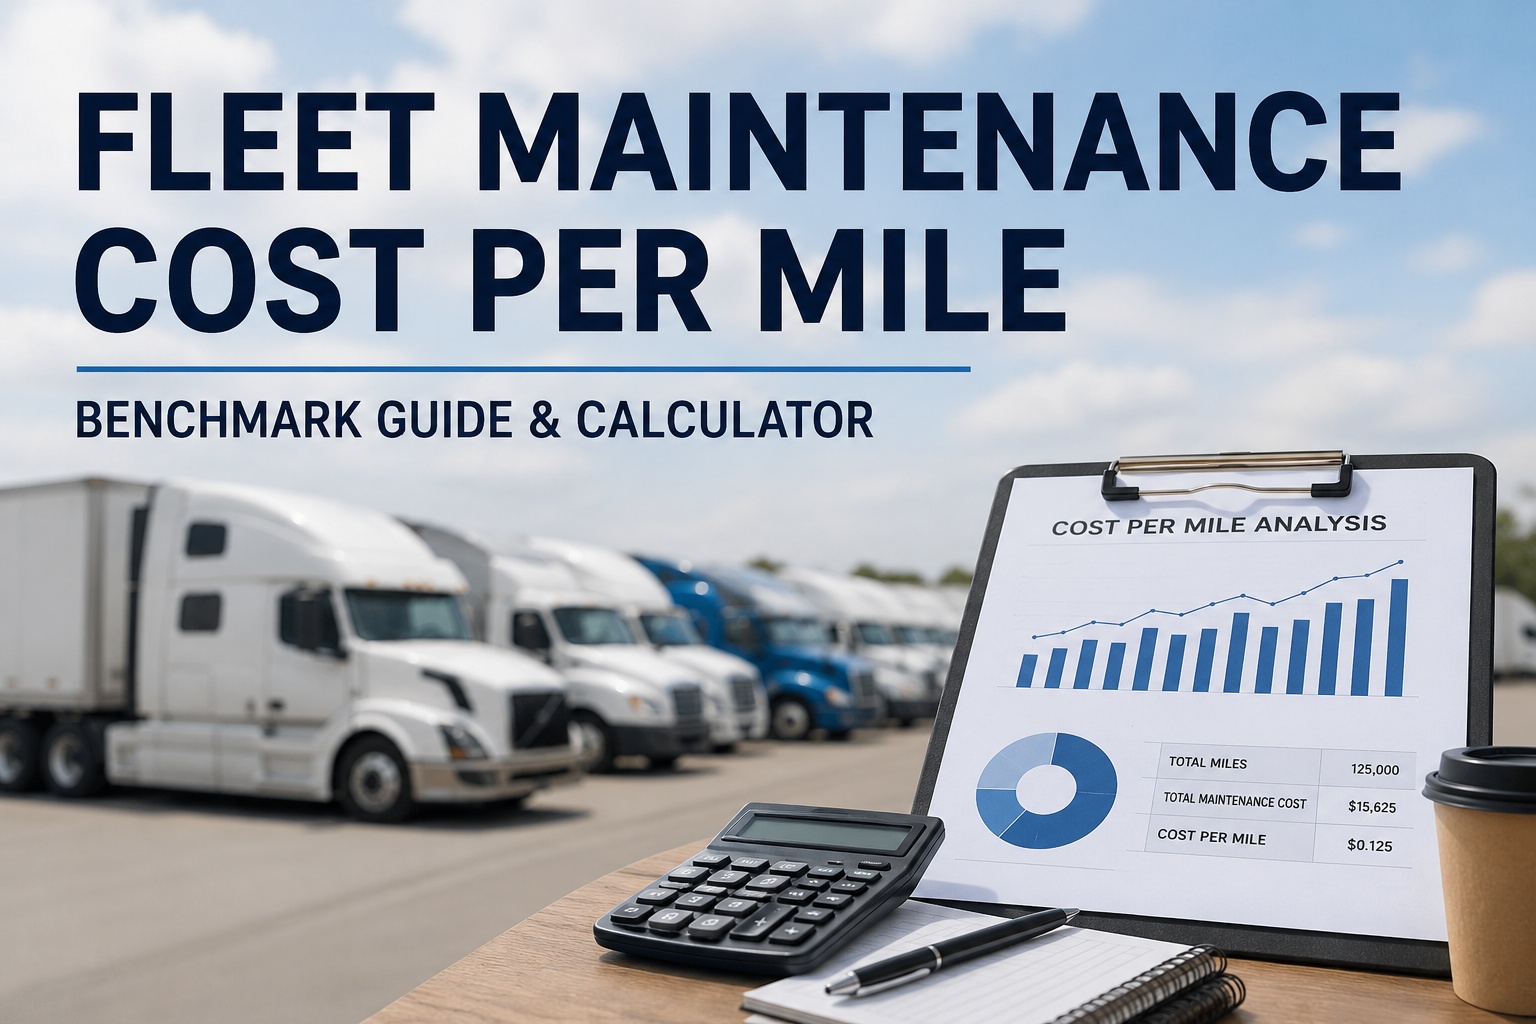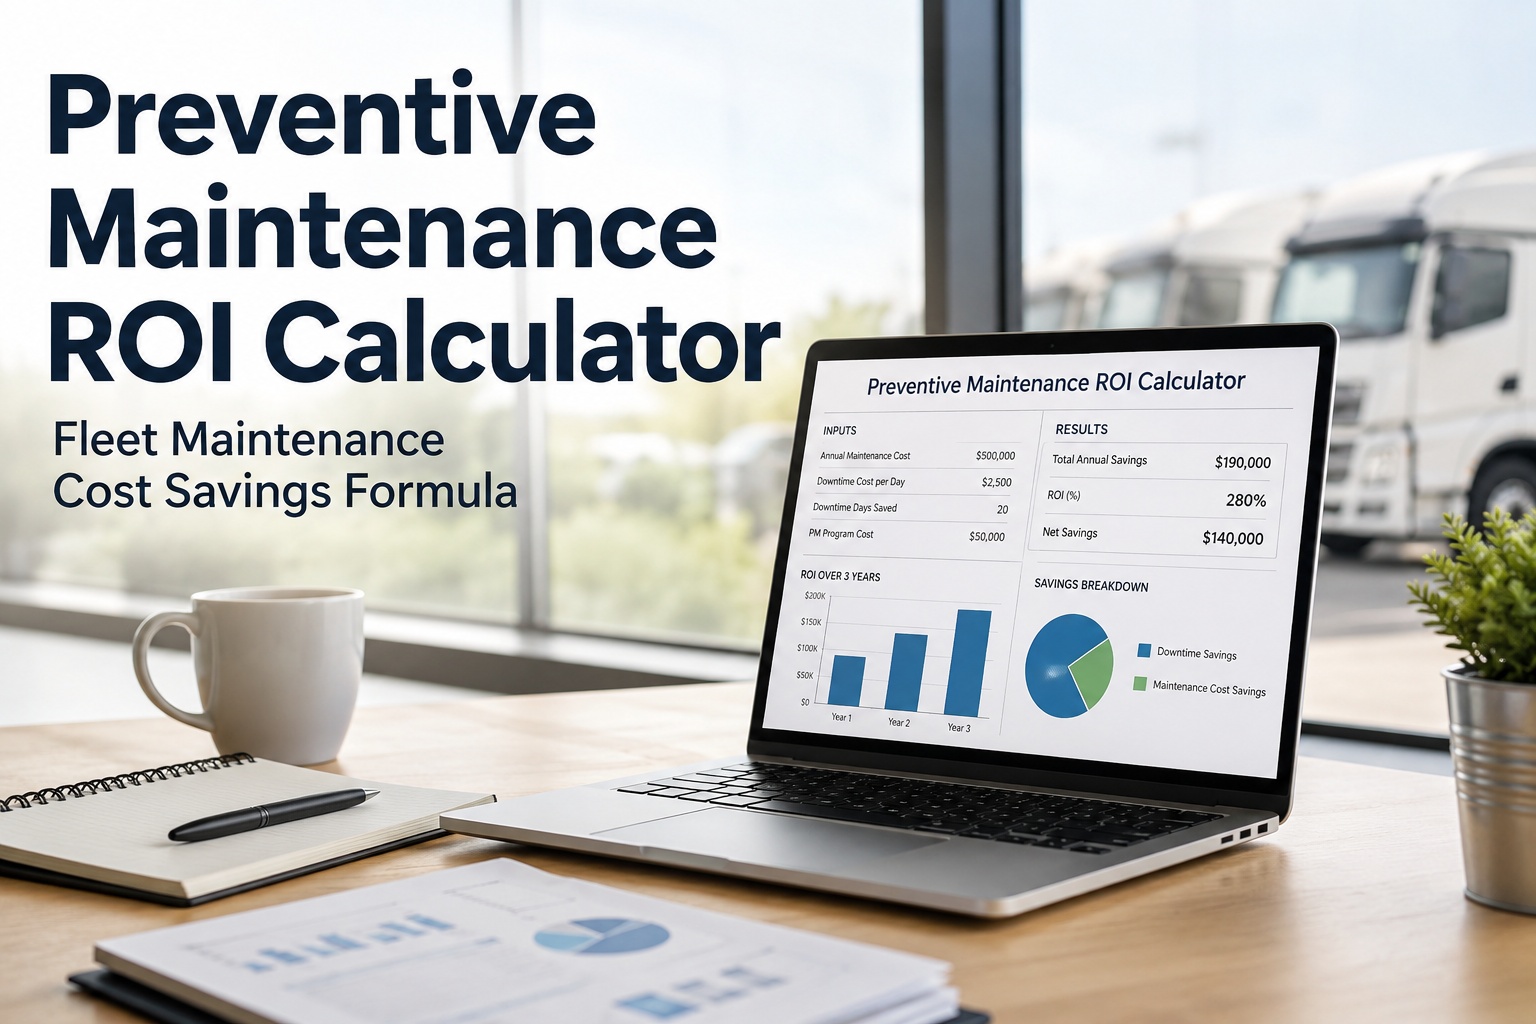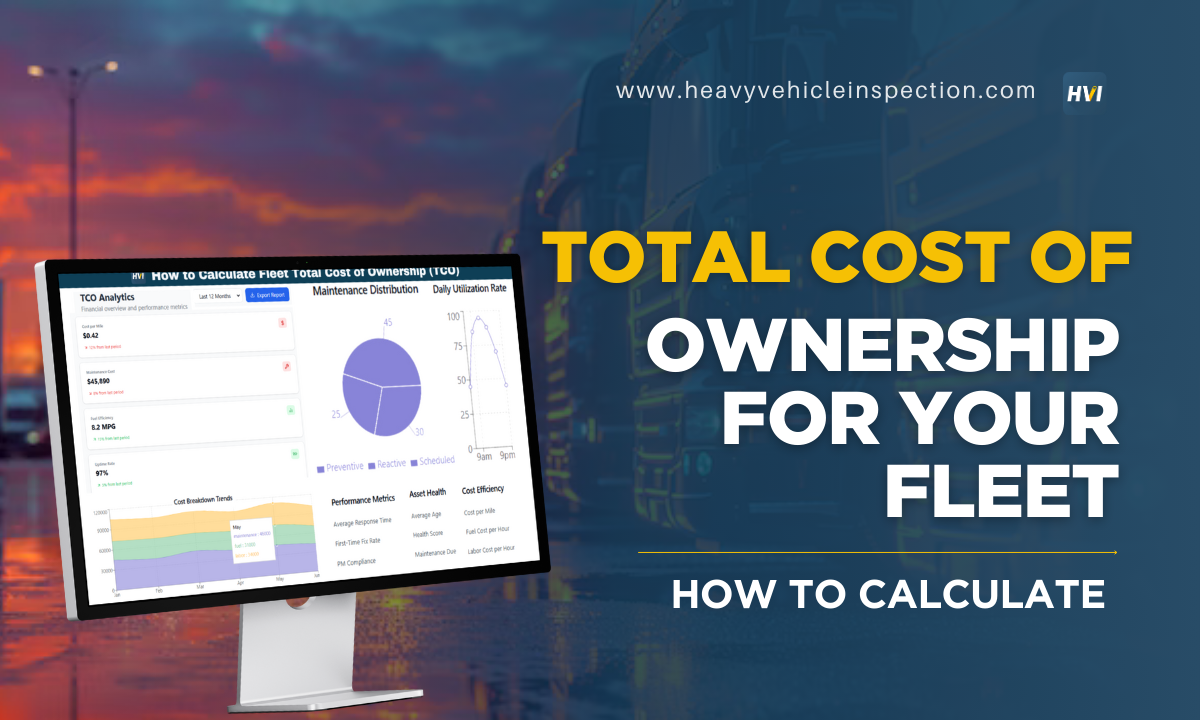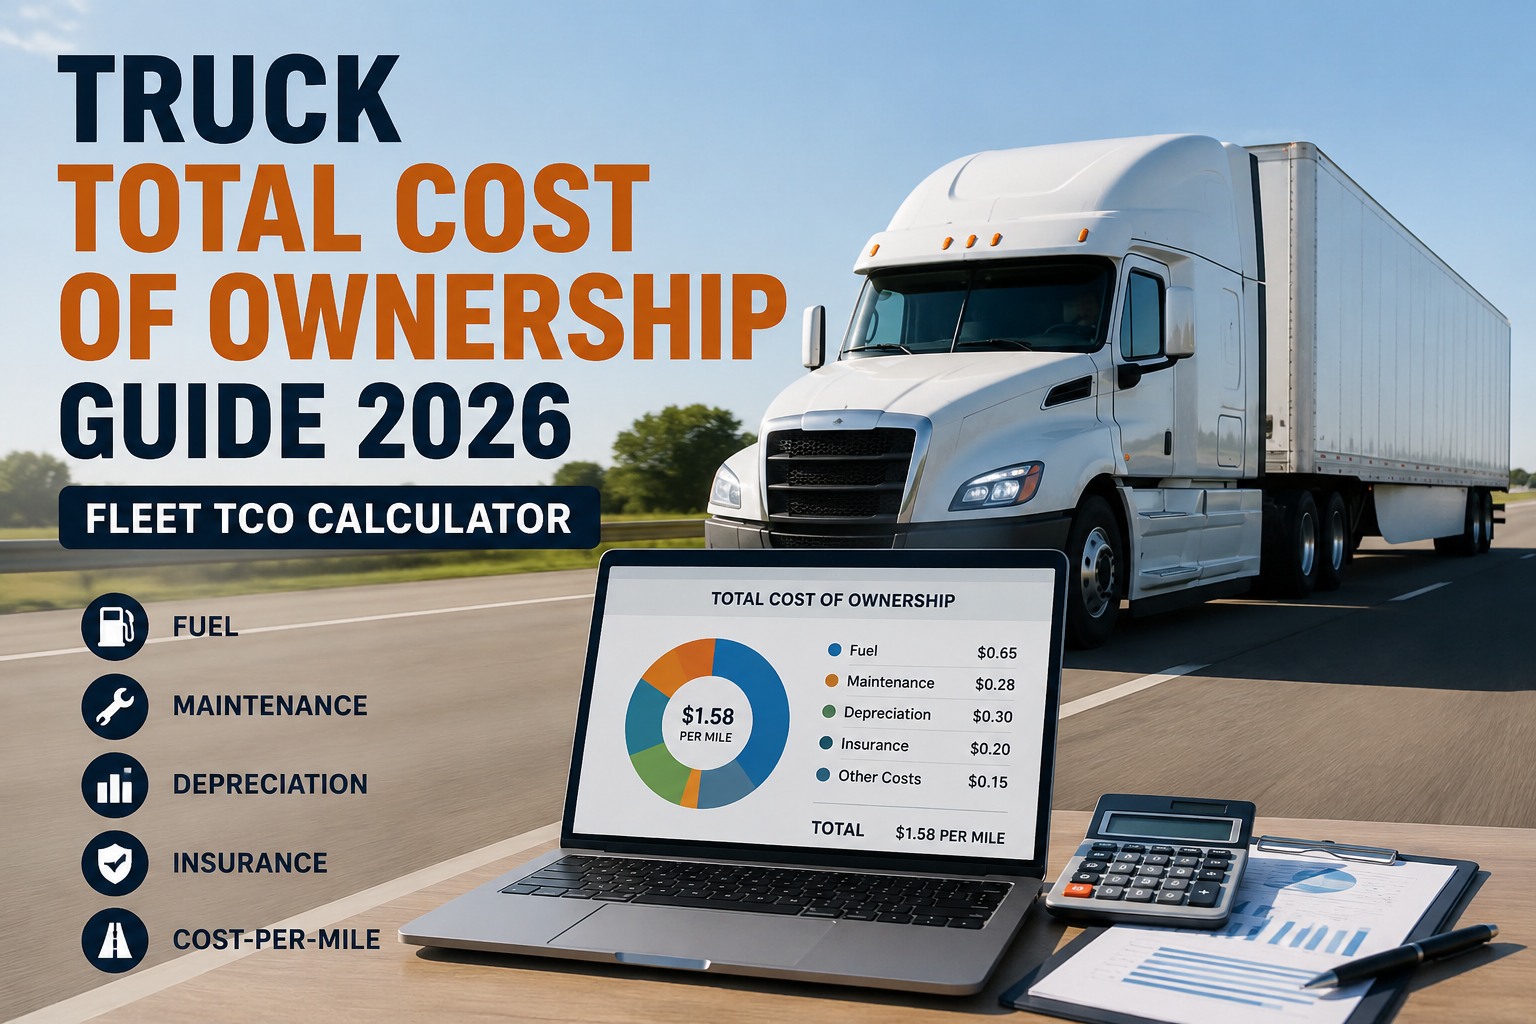
The sticker price of a new Class 8 tractor is around $180,000. The five-year total cost of ownership is closer to $1.2 million. That's the number every fleet decision should calibrate against — and it's the one most fleets can't produce on demand. Truck total cost of ownership hit an ATRI-recorded $2.336 per mile in 2025, up 45% since 2020, and Q1 2026 shows the trend continuing. This guide walks through the actual TCO stack, where recoverable dollars live, and the replacement math that separates disciplined fleets from over-leveraged ones. Book a demo
The 2026 TCO stack — where every dollar of $2.34 per mile actually goes
Six categories. Three you control day-to-day. Three you inherit at purchase.
Two structural realities sit inside this stack. First: the top three categories together represent 80% of every dollar spent. Second: only the middle three (fuel, maintenance, insurance) actually respond meaningfully to operational discipline. Driver comp is dictated by the labor market, truck payments are set at purchase, and permits/tolls are essentially fixed. That means 39% of total per-mile cost — roughly $0.83 out of $2.34 — is where recovery actually lives. Getting good at those three categories is what separates fleets that survive the freight recession from those that don't.
Visible vs invisible costs — what your P&L shows vs what actually kills margin
Most fleets budget accurately for the visible costs and get blindsided by the invisible ones. Here's the honest split between what appears clearly on financial statements and what hides inside operational assumptions until year-end reconciliation makes them impossible to ignore.
- Driver wages & benefits — $52K–$65K per driver base
- Fuel spend — roughly $48,800/yr per truck at 100K miles
- Truck & trailer payments — ~$18,000/yr per unit financed
- Insurance premiums — ~$13,500/yr per Class 8 unit
- Permits & licensing — usually annual line item
- Unplanned downtime — $800–$1,200/day per stranded truck in lost revenue
- Roadside repair premium — 3–5× the cost of shop repair
- Missed load penalties — contract terms most fleets never model
- Depreciation acceleration — poor maintenance history cuts resale 15–25%
- Fuel card fraud/leakage — typically 6–15% of fuel spend without controls
- Insurance premium creep — poor CSA scores drive 8–15% renewal increases
The invisible column typically adds another $0.35–$0.55 per mile of cost that never appears cleanly on any budget line. Over a truck's 5-year lifecycle, that's $175,000–$275,000 in erosion the CFO can't explain without operational data. This is why TCO analysis is only as good as the operational data feeding it — and why fleets running paper DVIRs and monthly reconciliations chronically underestimate their true TCO by 20–30%. Book a demo to see visible and invisible costs surfaced per unit in a single view
The 5-year TCO curve for a Class 8 tractor — when costs actually escalate
TCO isn't distributed evenly across a truck's life. The first two years are relatively flat; year three is where the curve starts bending; years four and five are where fleets either capture value or leak it. Understanding the shape of the curve is what makes replacement-window decisions rational instead of intuitive.
Three observations worth pausing on. First: annual TCO drops in year 2 as the truck settles in, then rises every year after. Second: the $0.20/mile ATRI maintenance average obscures a doubling of maintenance spend from year 2 to year 5 — from $12K–$18K to $25K–$35K. Third: the total isn't a flat 100K annual cost — it's a curve, and the last 18 months of an average lifecycle carry disproportionate cost. Fleets that don't know where each unit sits on this curve routinely hold trucks past their optimal replacement window, adding $30K–$50K in avoidable cost per unit. Book a demo to see per-unit TCO curves plotted against your actual maintenance and downtime data
The 6 TCO levers — where recovery actually lives
Not every cost line responds equally to operational improvement. Here are the six levers with the strongest documented ROI in 2026, in order of typical dollar impact per Class 8 tractor per year.
Preventive maintenance discipline
Missed PMs escalate into unplanned failures at 3–5× the shop-repair cost. Roadside events at $800–$1,200/day of lost revenue compound the direct repair bill. Fleets with strict PM adherence typically cut unplanned downtime 30–45%.
Fuel economy management
Tire pressure, alignment, idle time, and driver coaching consistently produce 2–4% MPG improvement. At $48,800 annual fuel spend per truck, even a 3% improvement is $1,464. Compounded with fraud detection ($8K–$22K first-week discovery), fuel is often the largest recoverable line.
Insurance premium optimization
Documented safety programs, clean CSA scores, and digital DVIRs with photo evidence produce 8–15% insurance premium reductions at renewal. On a $13,500 base premium, that's $1,080–$2,025 saved — every year, compounding.
Resale value protection
Photo-verified maintenance history and disciplined resale preparation produce 15–20% resale premiums vs. undocumented equivalents. On a truck with $50K expected resale value, that's $7,500–$10,000 additional recovered at trade-in.
Tire management
Alignment and pressure discipline produce 10–18% tire wear reduction. Tire costs rose 6.4% in 2025 alone. On a fleet spending $5,000/truck/year on tires, disciplined management recovers $500–$900 annually per unit.
Utilization / deadhead reduction
Moving loaded-mile percentage from 80% to 90%+ is a rate-per-mile equivalent lift. Every deadhead mile eliminated recovers roughly the full cost of that mile in avoided expense.
Combined across a fleet running the full playbook, these six levers typically produce $18,000–$24,000 in annual TCO savings per Class 8 tractor. On a 50-truck fleet, that's roughly $900,000–$1.2M in annual operating cost recovery — the difference between a fleet that survives freight-recession compression and one that doesn't. Start free and connect your first cost feeds on day one
The replacement window decision — when to hold vs when to trade
The oldest question in fleet management: at what point does the maintenance curve on a specific unit make replacement more economical than continued operation? Most fleets answer by feel. The disciplined answer is a three-metric test.
Cost-per-mile trajectory
Track cost-per-mile per unit monthly. When a specific tractor's CPM exceeds fleet average by 15% for two consecutive quarters, the unit is heading into the replacement zone. Ignoring the signal typically costs $10K–$18K before the replacement finally happens.
Downtime hours per quarter
Unplanned downtime is where TCO actually spikes. When a unit accumulates more than 80 hours of unplanned downtime in a rolling 90 days, replacement math flips: the revenue loss from continued operation exceeds the payment differential of a newer unit.
Resale value curve position
Resale value drops non-linearly — slow at first, then steep in years 5–7. Holding past the steep-drop inflection means giving away resale equity. Data-driven fleets typically trade before the accelerated depreciation zone, not after.
All three triggers should be tracked continuously per unit, not annually per fleet. When two of three fire on a specific tractor, the replacement conversation moves from theoretical to actionable. When three of three fire, the fleet is already losing money by continued operation — the only question is how much longer the loss compounds before someone acts. Book a demo to see the three-metric replacement test running live against your fleet
From a CFO who cut fleet TCO $19,400 per truck across 84 tractors in 14 months
Our all-in TCO for 2023 came out to $2.51/mile. Industry average was $2.27 that year, so we were running 10% hot without knowing where the leak was. We were profitable, but on the freight side we were losing bids to competitors quoting rates I couldn't match. When I finally had the data I needed — per unit, per driver, per lane — the leak wasn't one thing. It was six.
Fuel fraud was $4,200 per truck. Missed PMs were driving unplanned downtime that added $6,800. Insurance was 12% above what our safety record justified because we couldn't produce the documentation. Tires were burning through 20% faster than they should have. Fourteen months later we were at $2.36/mile — still not best-in-class, but $19,400 per truck per year of recovered TCO across 84 tractors. That's $1.6M annually. My board stopped asking why we had software costs.
Frequently asked questions
What is the total cost of ownership for a Class 8 truck in 2026?
According to the American Transportation Research Institute (ATRI), the average all-in operating cost for a Class 8 truck reached $2.336 per mile in 2025 — an all-time high — and Q1 2026 data shows continued increases in insurance, fuel, and driver benefits. Translated to annual dollars for a truck running 100,000 miles per year: approximately $233,600 in operating cost, or roughly $1.16 million over a five-year lifecycle. The breakdown by category: driver compensation at $1.00 per mile (44% of total), fuel and DEF at $0.48–$0.60 per mile (22%), truck and trailer payments at $0.33 per mile (15%), repair and maintenance at $0.20 per mile (10%), insurance at $0.15 per mile (7%), and remaining costs (tires, tolls, permits) at $0.06 per mile (2%). Total cost per mile rose 45% between 2020 and 2026, from approximately $1.65 to $2.40, driven by post-pandemic driver wage compression, fuel baseline resets, financing cost normalization, and 55% increase in repair costs alone. The purchase price of a new tractor represents only 15–20% of five-year total ownership cost — the operating cost dominates. Fleet TCO analysis is meaningful only when built on unit-level data across all six categories, tracked continuously, not annually.
How do you calculate a truck's cost per mile?
Cost per mile is calculated by dividing total annual operating expense by total annual miles driven. The formula is straightforward: (fixed costs + variable costs) / total miles = cost per mile. Fixed costs (allocated per mile) include truck and trailer lease or depreciation, insurance premiums, permits and licensing, back-office and overhead allocations, and driver pay and benefits. Variable costs include fuel and DEF, tires, tolls, repairs, maintenance, and any per-load consumables. The industry standard for Class 8 tractors in 2025 was $2.336 per mile all-in, per ATRI's 178,091-tractor sample covering 14.08 billion miles. Owner-operators and smaller fleets typically calculate CPM monthly to catch trends early; larger fleets use rolling 90-day averages for smoother decision-making. Two data-quality traps to avoid: (1) missing invisible costs like unplanned downtime revenue loss, roadside repair premiums, and depreciation acceleration from poor maintenance documentation, which typically add $0.35–$0.55 per mile of cost that never appears cleanly in P&L; (2) using fleet-wide averages instead of per-unit CPM, which hides the specific tractors driving the average up and delays replacement decisions. Fleets running paper DVIRs and monthly reconciliations chronically underestimate their true TCO by 20–30%. Digital fleet management platforms that surface per-unit CPM against fleet average in real time make the difference between reactive and proactive cost control.
When is the ideal replacement window for a Class 8 tractor?
The traditional answer is 4–5 years or 500,000–750,000 miles, but the useful answer is data-driven per unit rather than fleet-wide by age. Three metrics jointly determine the replacement window. Cost-per-mile trajectory: when a specific tractor's CPM exceeds fleet average by 15% for two consecutive quarters, the unit is heading into the replacement zone; ignoring that signal typically costs $10,000–$18,000 in avoidable expense before replacement finally happens. Downtime hours per quarter: when a unit accumulates more than 80 hours of unplanned downtime in a rolling 90 days, the revenue loss from continued operation (at $800–$1,200 per day of stranded revenue) exceeds the payment differential of a newer unit. Resale value curve position: resale drops non-linearly — slow through year 4, then steep in years 5–7 — and holding past the accelerated depreciation zone means giving away resale equity. Data-driven fleets typically trade at year 4–5 or 500K–600K miles when at least two of these three triggers fire. When all three fire, the fleet is already losing money by continued operation. The maintenance curve on Class 8 tractors doubles from year 2 to year 5 — from $12K–$18K annually to $25K–$35K — making per-unit tracking essential for rational replacement timing. Fleet-wide age policies produce systematically worse economics than per-unit data-driven policies.
What are the most controllable TCO categories?
Three categories — fuel and DEF, repair and maintenance, and insurance — account for approximately 39% of total per-mile cost (roughly $0.83 out of $2.34) and respond most directly to operational discipline. Driver compensation (44%) is largely dictated by the labor market; truck and trailer payments (15%) are set at purchase; permits and tolls (2%) are essentially fixed. The three controllable categories break into six specific levers, in typical order of dollar impact per Class 8 tractor per year: preventive maintenance discipline recovering $4,000–$7,000 annually through 30–45% unplanned downtime reduction; fuel economy management (tire pressure, alignment, idle reduction, driver coaching) recovering $3,500–$5,500 through 2–4% MPG improvement plus fraud detection; insurance premium optimization recovering $1,000–$2,000 through documented safety programs producing 8–15% renewal reductions; resale value protection recovering $7,500–$10,000 at trade-in through photo-verified maintenance history and disciplined resale preparation; tire management recovering $500–$900 through alignment and pressure discipline; utilization and deadhead reduction with route-dependent but often high-leverage impact. Combined across a fleet running the full playbook, these six levers typically produce $18,000–$24,000 in annual TCO savings per Class 8 tractor. On a 50-truck fleet, that's approximately $900,000–$1.2M in annual operating cost recovery — often the difference between fleets that survive freight-recession compression and those that don't.
How does HVI help fleets analyze and reduce total cost of ownership?
HVI surfaces per-unit total cost of ownership in real time by unifying the operational data streams that determine TCO on one platform: DVIRs, preventive maintenance records, work orders, fuel card transactions, parts inventory, downtime tracking, driver assignment history, and safety flags — all tied to specific units with cost lines attached. On the visibility side, HVI surfaces per-unit cost-per-mile trends automatically, benchmarking against fleet average and flagging units where CPM exceeds average by 15% or more for two consecutive quarters (the trigger for entering the replacement decision zone). On the recovery side, HVI's analytics activate all six TCO levers simultaneously: preventive maintenance scheduling with automatic due-date alerts, AI-powered fuel fraud detection cross-referencing transactions against GPS location, digital DVIR documentation producing insurance-defense-quality photo evidence, tire life tracking per axle and per unit, and utilization analytics surfacing deadhead patterns per driver and per lane. On the replacement decision side, HVI plots each unit's downtime hours, cost-per-mile trajectory, and cumulative maintenance spend against fleet average, so fleet directors can see which specific tractors are approaching replacement territory before annual budget cycles surface the issue. Published customer data shows fleets on HVI report approximately 25% lower annual maintenance cost and typical payback around 3 months, and the TCO analytics extend the same operational discipline across every cost category simultaneously. On a 50-truck fleet, typical annual TCO recovery lands in the $900K–$1.2M range within 12–18 months of full implementation.
Your fleet's TCO is knowable to the dollar per unit. Most fleets just can't see it.
HVI unifies DVIRs, PMs, work orders, fuel data, and downtime tracking on one platform — with per-unit cost-per-mile trends surfaced automatically. When your VP of Operations is deciding whether to hold or trade a specific tractor, the answer is one dashboard away instead of a three-week spreadsheet build. Typical recovery: $18K–$24K per truck annually.
No credit card · Per-unit cost dashboards live on day one