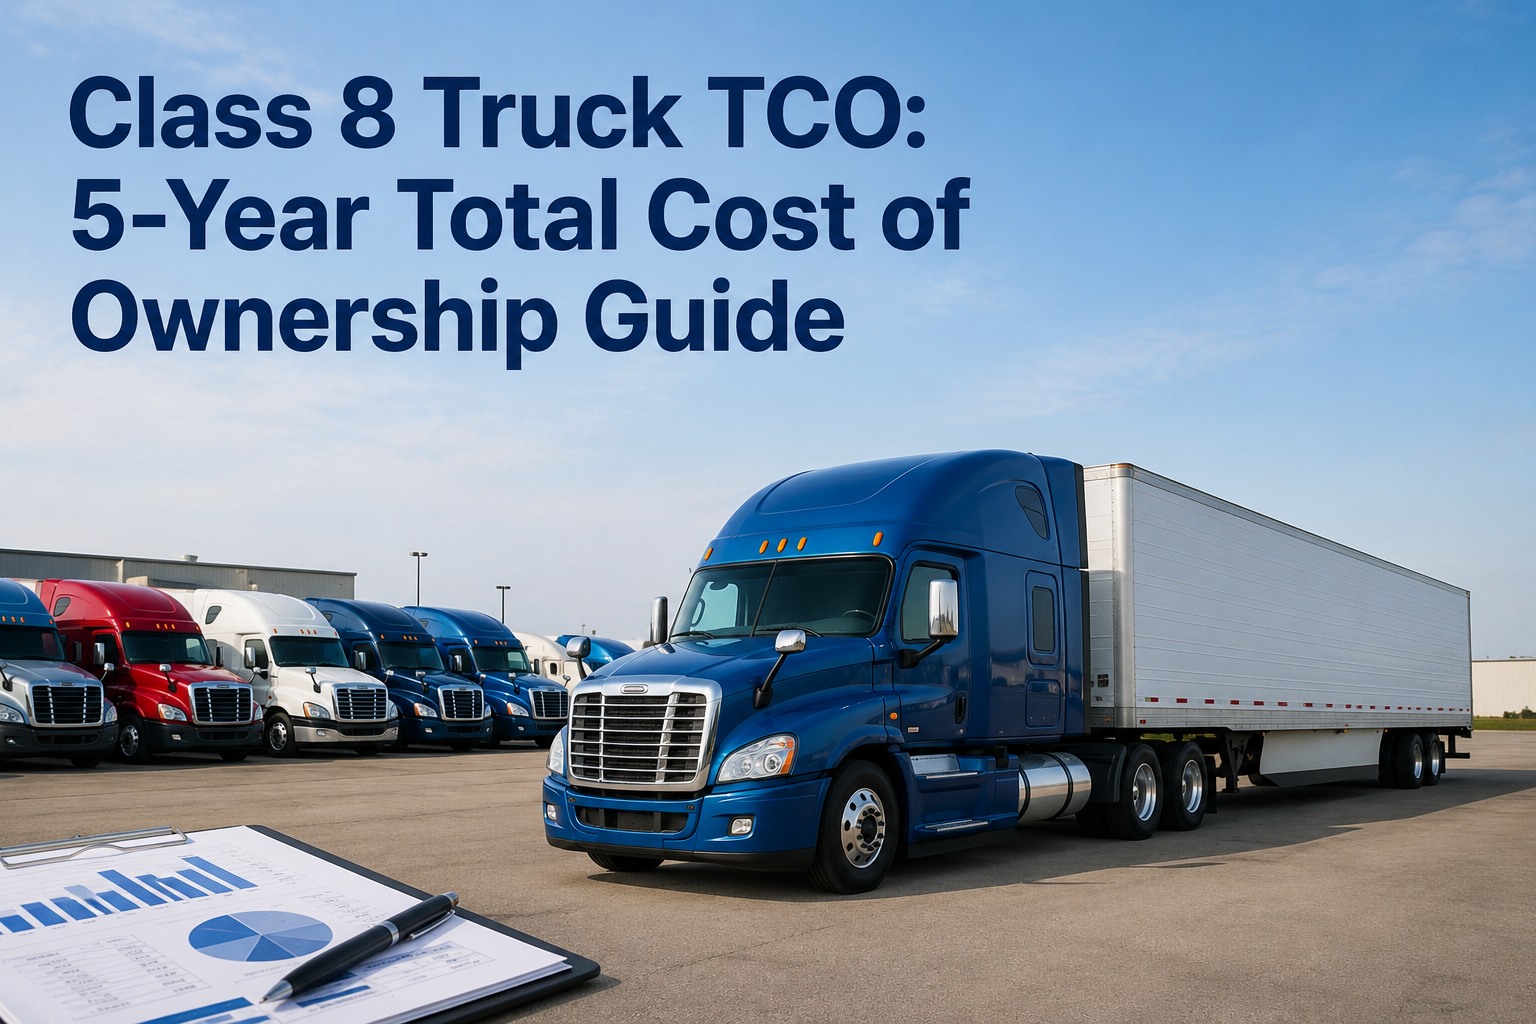
The purchase price of a Class 8 semi is only 15–20% of the truck's 5-year total cost of ownership. Fuel, maintenance, downtime, tires, insurance, and residual value make up the other 80–85% — and that mix shifts dramatically between year 1 (ownership-dominated) and year 5 (maintenance and downtime rising sharply). Fleet directors making acquisition or replacement decisions off sticker price alone routinely misprice lifecycle cost by six figures per unit. This 2026 Class 8 TCO guide walks the 5-year curve and 8 cost categories. Book a demo .
The Class 8 TCO Curve — Where the Cost Actually Lives Year by Year
Purchase price is one bar. Fuel and maintenance are the other four. The mix shifts every year.
Warranty covers most repairs
Maintenance ramps
Out of warranty
Downtime rising
Replacement decision
Class 8 total cost of ownership is a lifecycle number, not an annual one — and it moves differently in different years of a truck's service life. Year 1 is dominated by depreciation and financing costs, with maintenance still under warranty. Years 2–3 typically produce the lowest combined cost per mile, as depreciation eases and out-of-warranty maintenance is still moderate. Years 4–5 see maintenance and downtime rise sharply as major components approach service intervals: engine overhauls, transmission service, aftertreatment refurbishment, driveline work. A fleet buying, holding, or replacing based on year-1 cost math is optimizing for the wrong year. TCO discipline is knowing where each unit sits on the curve and pricing the decisions accordingly.
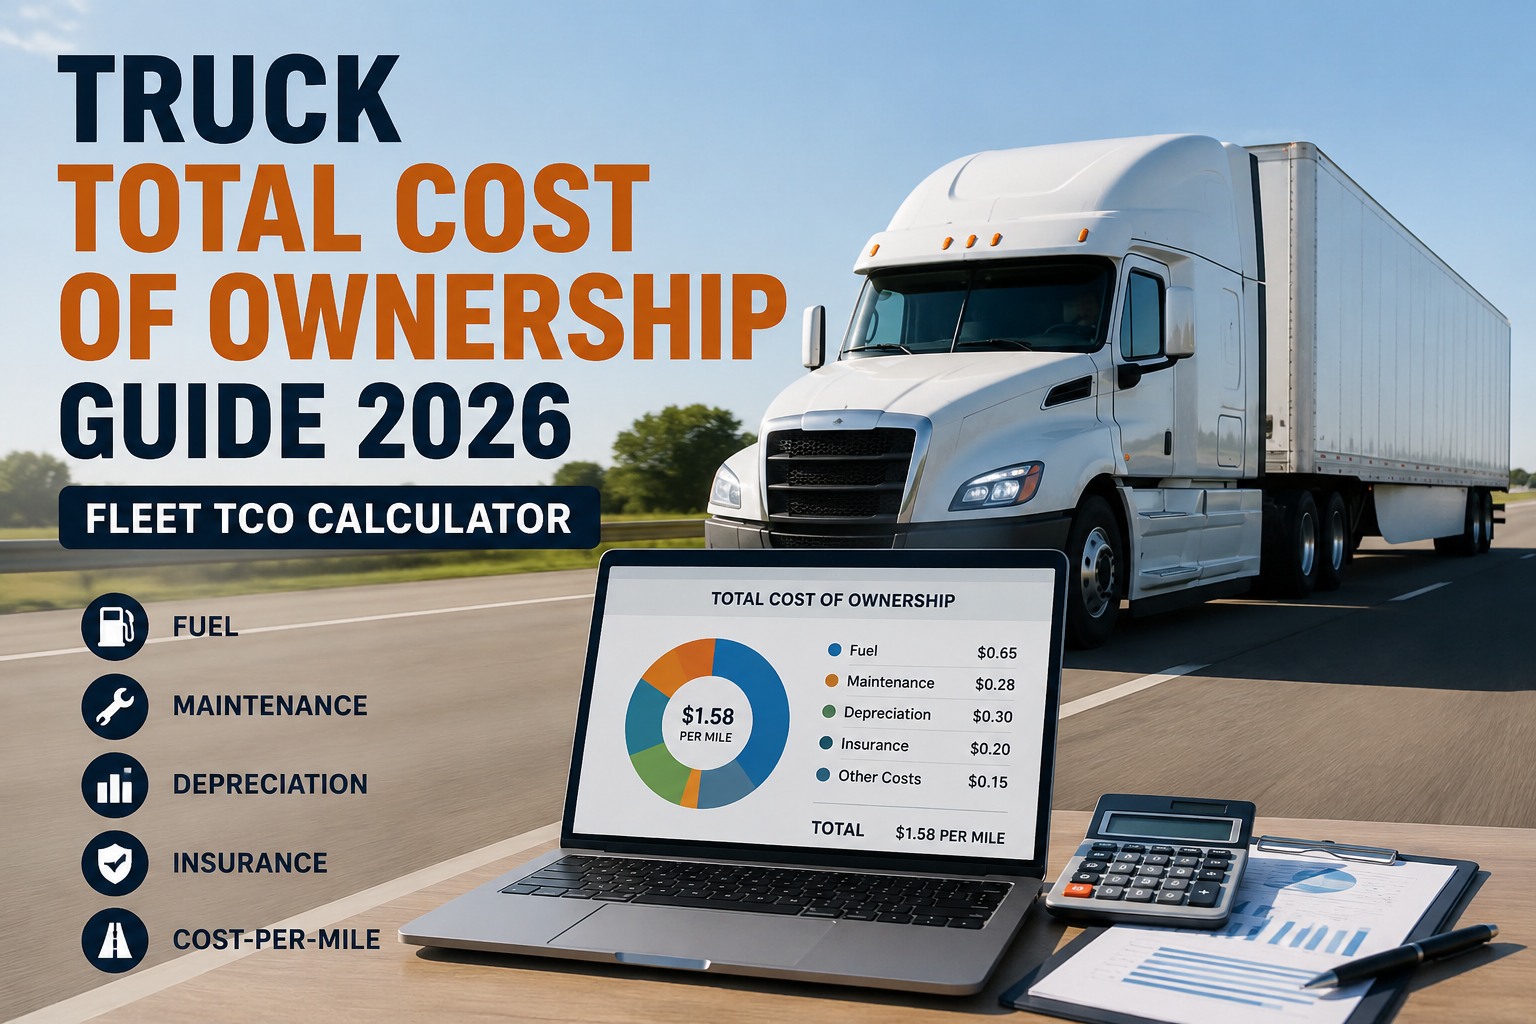
The 8 cost categories that make up Class 8 TCOEvery dollar spent on a truck falls into one of these — and the mix changes with age
A defensible TCO calculation aggregates 8 cost categories over the analysis period and nets against estimated residual value. Missing categories or double-counting is where TCO models produce numbers that lose credibility in the finance review. Book a demo to see per-unit maintenance and fuel data feed TCO analysis
Acquisition + financing
Typical: 15–20% of 5-yr TCO. New tractor $140K–$180K depending on spec and options. Financing adds interest cost over term; lease vs buy shifts the accounting but not the underlying cash cost.
Fuel + DEF
Typical: 25–35% of 5-yr TCO. At 6.5 MPG and $3.75/gal diesel, a 100K-mi/yr tractor burns ~$58K/yr in fuel plus DEF. Fuel efficiency spec choices at purchase compound over the life.
Maintenance parts + labor
Typical: 15–25% of 5-yr TCO, weighted heavily to years 3–5. Industry data patterns suggest maintenance $12K–$18K/yr in years 1–2, escalating to $25K–$35K/yr by years 4–5 as major components hit service intervals.
Tires
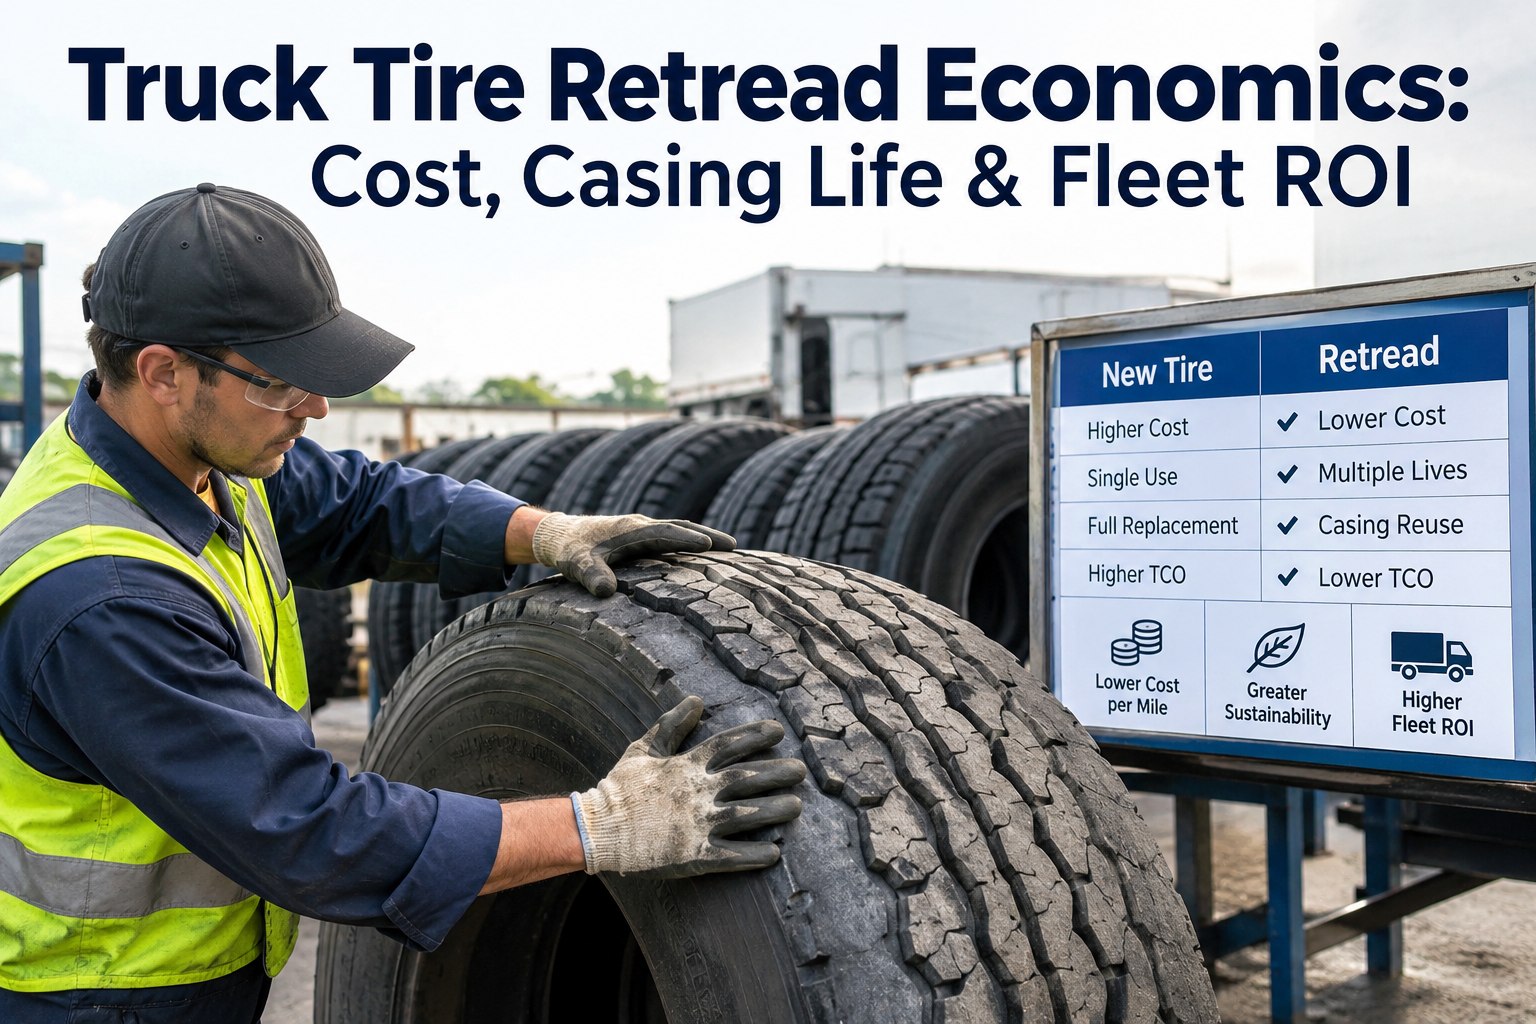
Typical: 3–6% of 5-yr TCO. Steer, drive, and trailer tire replacement over the analysis period. Steer position more expensive per position; drive positions consume more units. Retreads reduce cost where operating conditions allow.
Insurance + permits + taxes
Typical: 6–10% of 5-yr TCO. Commercial auto insurance for Class 8 varies widely by region, cargo type, and CSA scores. Federal Heavy Vehicle Use Tax, IFTA, state registration, and permits round out this category.
Downtime + substitute equipment
Typical: 3–8% of 5-yr TCO. Every day out of service is lost revenue plus (in many cases) rental or substitute equipment cost to cover the load. Undermanaged PM programs push this line item well beyond the typical range in years 4–5.
Labor allocation
Typical: variable — often carried separately in fleet financials rather than per-unit TCO. Driver wages and benefits are the largest single fleet cost overall but usually treated as an operating overlay rather than a unit-cost line. Track methodology consistently for cross-unit comparison.
Residual value (credit)
Typical: subtracts 20–40% of original acquisition cost at 5 years, depending on brand, spec, condition, and market timing. Well-maintained trucks with clean service records command meaningful premiums at trade or resale. Documented maintenance history is a real cash asset.
Every one of these 8 categories accumulates cost data somewhere — the question is whether that data lives in a system you can pull from, or scattered across spreadsheets, invoices, and dealer paperwork. Book a demo to see per-unit cost aggregation in HVI
Where the lowest purchase price becomes the highest TCOThe 4 spec traps that produce cheap trucks with expensive lifecycles
Purchase-price optimization at spec time is where TCO discipline earns its keep — or fails silently for 5 years. A truck spec'd $10K under an alternative can lose the savings back multiple times over through fuel penalty, faster maintenance escalation, or lower residual. The trap is that the savings show up on the invoice while the cost shows up on operating reports nobody links back to the purchase decision.
Fuel-efficiency undersaving
Warranty-scope trade
Off-brand or thin-spec choice
PM program deferral
Replacement timing — the decision TCO exists to informWhen cost-per-mile crossover signals hold-vs-replace
The single most valuable output of a good TCO program is replacement-timing signal. Every fleet knows their oldest trucks cost more — the TCO question is when does cost per mile on unit #217 exceed the equivalent cost per mile on a comparable new tractor factoring depreciation. That crossover point is the rational replacement trigger. Missing it by 12–18 months typically adds $30K–$50K per unit of avoidable cost. Start a free trial to build per-unit cost history that supports replacement analysis.
Trend cost-per-mile per unit, not fleet average
Fleet average smooths over the units driving the number. Per-unit cost-per-mile trended over 12+ months identifies specific tractors approaching replacement threshold before fleet average shifts visibly.
Include downtime hours in the calculation
A unit down 15% of scheduled operating days is a very different cost story than one down 3%. Downtime hours multiplied by revenue-per-day plus rental substitute cost captures the hidden line most TCO models miss.
Compare against a fresh-unit baseline
Replacement math needs today's new-tractor TCO curve for comparison, not the curve from when the old unit was new. Current acquisition cost, current fuel prices, current insurance and warranty terms.
Factor residual on both sides
Selling unit #217 for $30K residual reduces the effective net cost of the new replacement. Timing the trade before major-service events (in-frame overhaul, aftertreatment refurbishment) protects residual value substantially.
Watch for year-5 major-service triggers
Engine in-frame overhaul at 600K–800K miles ($20K–$40K), aftertreatment refurbishment, transmission service — any of these approaching on an older unit shifts the hold-vs-replace math. Anticipate them; don't be surprised.
Document the maintenance history — it's a cash asset
Complete, searchable maintenance records on a Class 8 tractor typically add $2K–$5K to trade value vs a comparable unit with sparse records. The paperwork is the asset at sale time.
Per-unit cost history over 24+ months is what makes replacement timing rational instead of reactive — and what makes the trade paperwork worth what it should be. Book a demo to see multi-year per-unit cost history in HVI
From a fleet director on getting TCO into the acquisition conversation
We used to buy on invoice price. Every trade cycle, someone would ask why our five-year cost per mile was 12–15 cents above where we thought it should be. The answer was always in the same place — year-4 and year-5 maintenance running well above what we'd modeled at purchase, and residuals coming in below what the dealer projected.
We rebuilt the acquisition process around per-unit TCO. Same finance team, same procurement team, but now spec decisions carry a 5-year cost model with maintenance escalation from our actual data. Last two order cycles have run 8 and 11 cents/mile below our previous cohort at the same age. The trucks themselves aren't different. The math driving what we bought and how we specced was.
Frequently asked questions
What is included in the total cost of ownership of a Class 8 truck?
Class 8 truck total cost of ownership includes 8 cost categories aggregated over the analysis period (typically 5 years) minus estimated residual value at end of ownership. The categories: acquisition cost and financing (typically 15–20% of 5-year TCO for new tractors at $140K–$180K); fuel and DEF (25–35%, roughly $58K/yr at 100K mi/yr, 6.5 MPG, $3.75/gal); maintenance parts and labor (15–25%, weighted heavily to years 3–5); tires (3–6%); insurance, permits, and taxes (6–10% including commercial auto insurance, Federal Heavy Vehicle Use Tax, IFTA, state registration); downtime plus substitute equipment cost (3–8%); labor allocation (often carried separately in fleet financials); and residual value as a credit against total cost (typically 20–40% of original acquisition at 5 years). The purchase price alone represents only 15–20% of the 5-year total — operating cost dominates. TCO analysis is meaningful when built on per-unit operational data (actual maintenance, actual fuel, actual downtime) rather than spec-sheet estimates or industry averages alone.
How much does a Class 8 truck cost to operate per mile?
The American Transportation Research Institute (ATRI) reported an industry average of $2.336 per mile all-in for Class 8 tractors in 2025, from a sample of 178,091 tractors covering 14.08 billion miles. That figure includes fixed costs (depreciation or lease, insurance, permits, back-office allocation, driver pay and benefits) and variable costs (fuel and DEF, tires, tolls, repairs, maintenance, per-load consumables). Individual fleet cost per mile typically ranges $0.62–$0.82 for operating cost alone at 100K mi/yr, with all-in figures ranging widely from the ATRI average based on lane profile, driver behavior, PM program maturity, spec choice, insurance rates, and financing terms. Fleets with disciplined PM programs and driver behavior monitoring routinely operate below the industry average; fleets with reactive maintenance and undermanaged idle time run well above. The per-mile number is most useful when trended per unit and per driver over time, not benchmarked as a single point-in-time comparison.
Why does maintenance cost rise so sharply in years 4 and 5?
Class 8 tractor maintenance follows a predictable escalation curve because major component service intervals cluster in years 4–5 of typical operation. In-frame engine overhauls typically occur at 600K–800K miles ($20K–$40K per event); aftertreatment refurbishment or DPF replacement can cost $8K–$15K; transmission service intervals hit; driveline components (u-joints, output seals, differential service) reach service life; brake and steering components accumulate wear cycles. Industry data patterns show maintenance costs in the $12K–$18K/yr range in years 1–2 (under or near warranty), moderate in year 3 (out of warranty but before major-service triggers), and escalating to $25K–$35K/yr in years 4–5 as multiple major-component intervals converge. Actual escalation depends on lane profile, driver behavior, PM program discipline, and spec choice, but the curve shape holds across most Class 8 operations. Understanding where each specific unit sits on the curve is what enables rational replacement timing.
Does HVI support Class 8 TCO analysis?
Partially — HVI supports the cost-side operational data needed for TCO analysis, not the TCO calculation itself or the acquisition, financing, insurance, and residual-value inputs. On the operational cost side, HVI supports maintenance cost tracking per unit with work orders, parts, and labor recorded; parts consumption tagged to specific tractors; fuel consumption tracking per unit; downtime hours captured against every defect and work order; and searchable multi-year cost history per truck for year-over-year TCO trending. Production data (miles driven, cycle counts) integrates from telematics or dispatch systems where connected. HVI is not a financial-planning platform, a procurement or acquisition system, an insurance carrier or broker, a residual-value forecasting service, or a prescriptive TCO calculator. TCO calculation, acquisition inputs, and finance-team judgment remain with CFO, procurement, and finance teams using HVI's operational data as the reliable per-unit history that turns a spec-sheet estimate into a defensible lifecycle number.
When should a Class 8 truck be replaced?
The rational replacement trigger for a Class 8 tractor is the crossover point where cost per mile on the current unit exceeds the cost per mile on a comparable new tractor factoring depreciation on both sides. That crossover typically occurs somewhere between years 5–7 for on-highway tractors at 100K mi/yr, depending on maintenance escalation rate, downtime, and current residual value. Signals that a specific unit is approaching replacement: cost-per-mile trend on the unit rising above fleet-average by more than 15–20% over rolling 6–12 months; downtime hours exceeding 10–15% of scheduled operating days; major-service events (in-frame engine overhaul at 600K–800K miles, aftertreatment refurbishment, transmission service) approaching on inspection or telematics data; and residual value still meaningful at trade (typically $20K–$40K depending on brand, spec, and condition). Missing the replacement trigger by 12–18 months typically adds $30K–$50K per unit of avoidable cost as year-6 and year-7 costs continue escalating and residual value drops. Per-unit TCO trending is what makes the trigger visible before the cost curve is obvious to everyone.
Know exactly where every truck sits on the TCO curve
Stop making $50K replacement decisions off spreadsheets. HVI gives your VP of Ops a per-unit cost dashboard, your CFO a defensible TCO model, and your shop the maintenance history that adds real dollars to trade value.
No credit card · No hardware · Setup in minutes