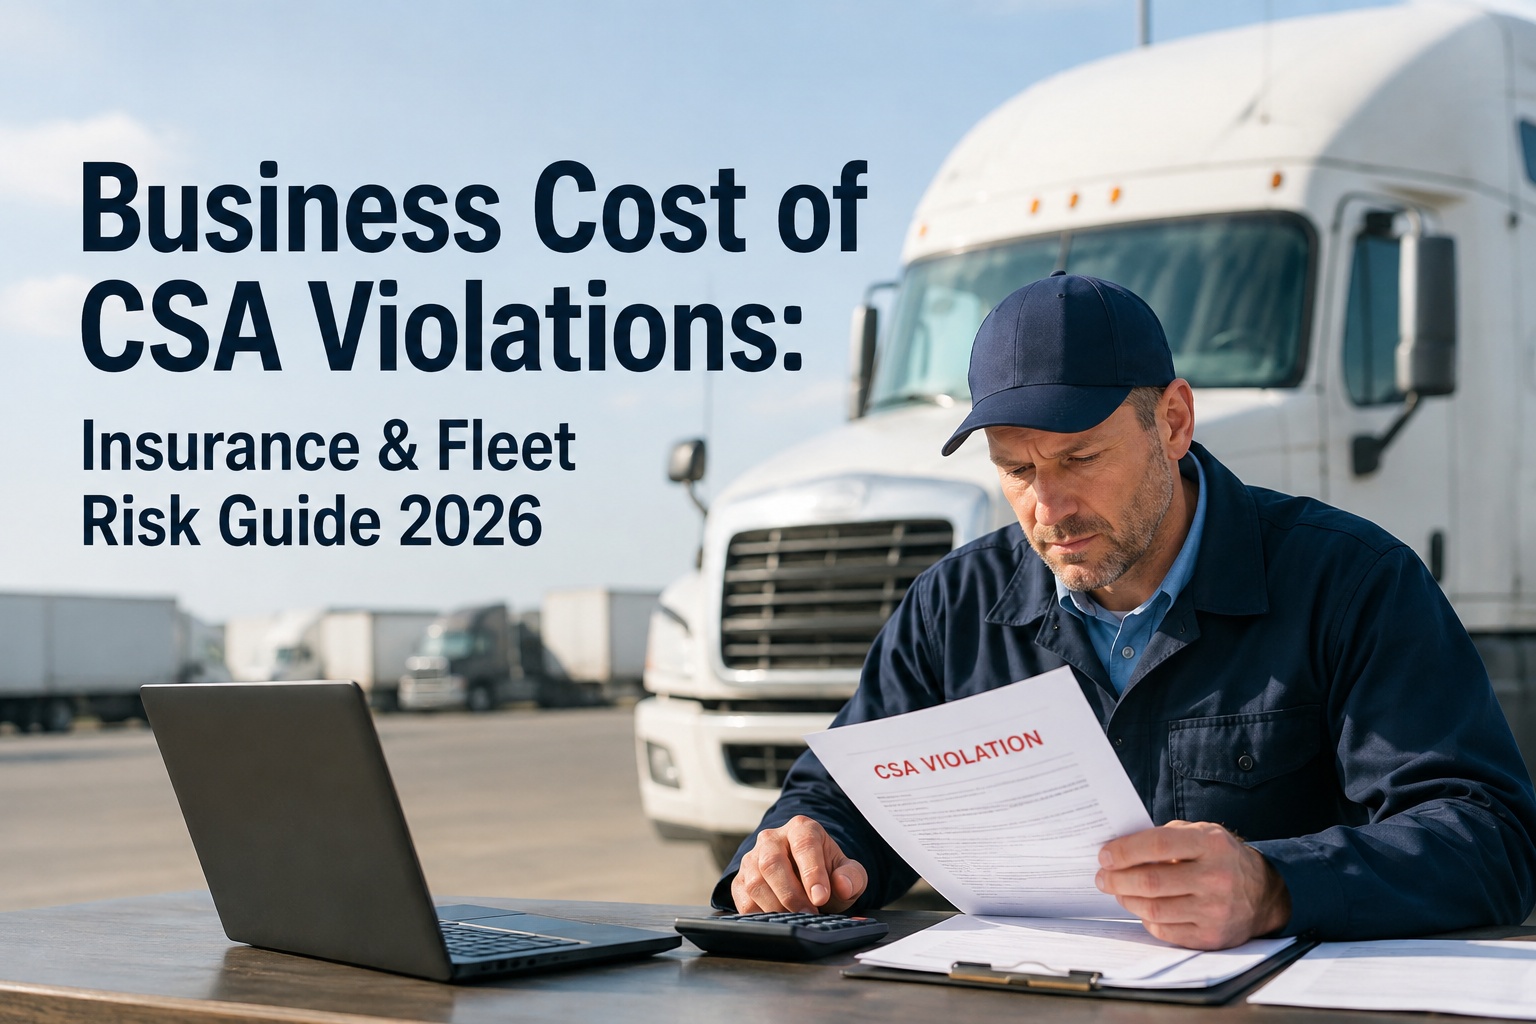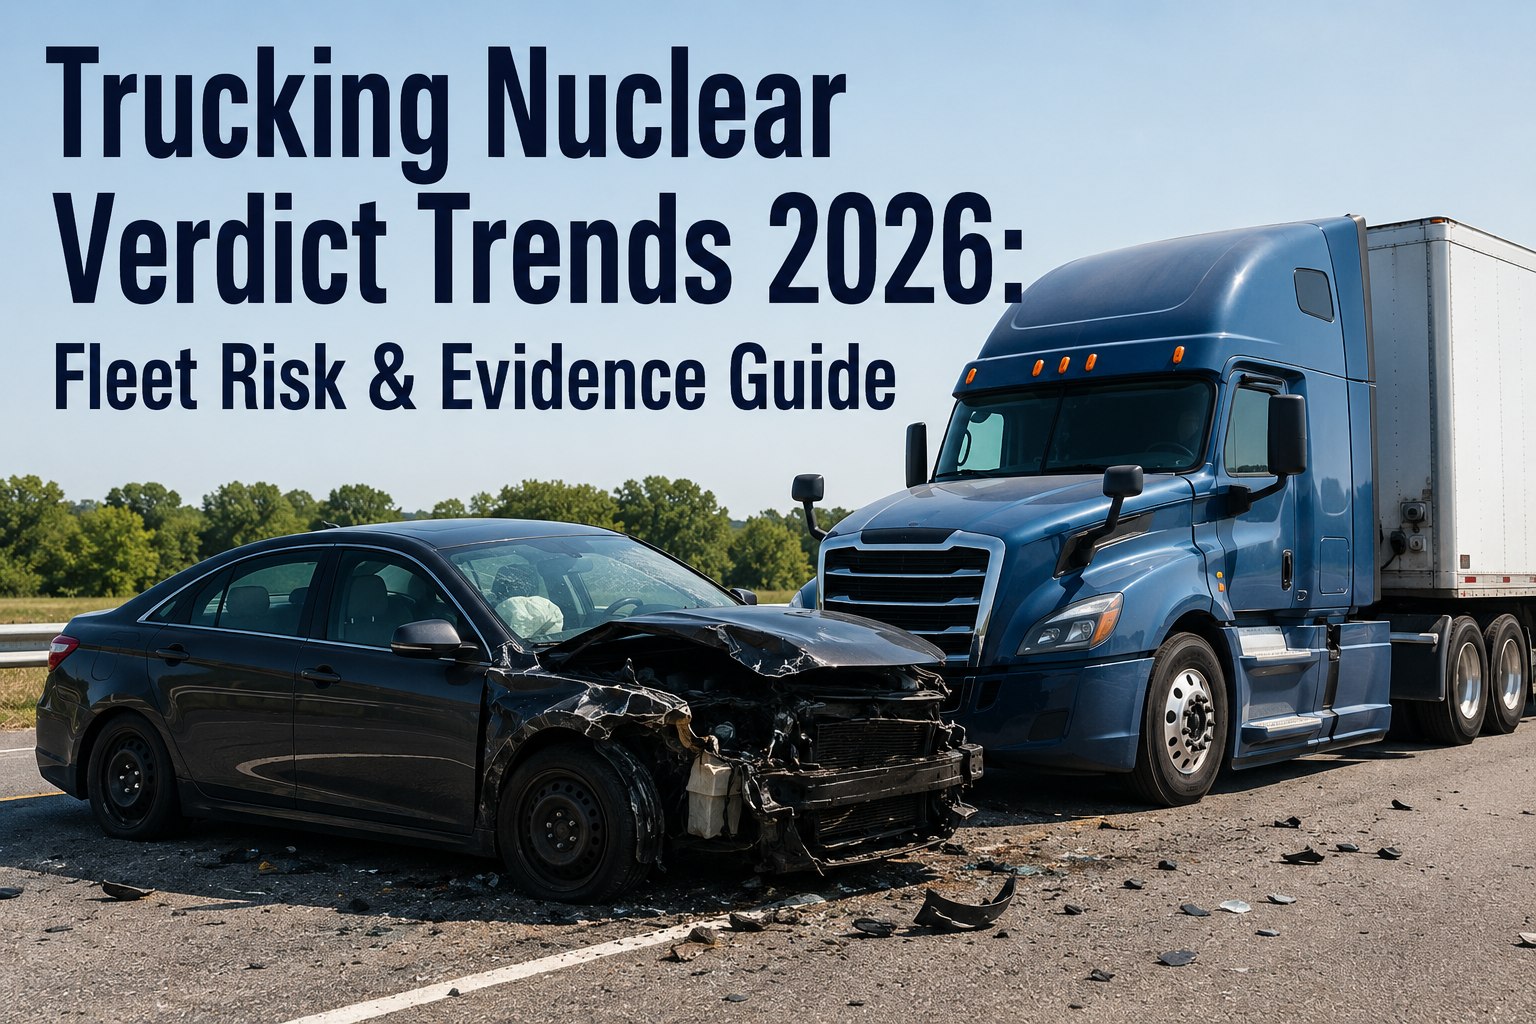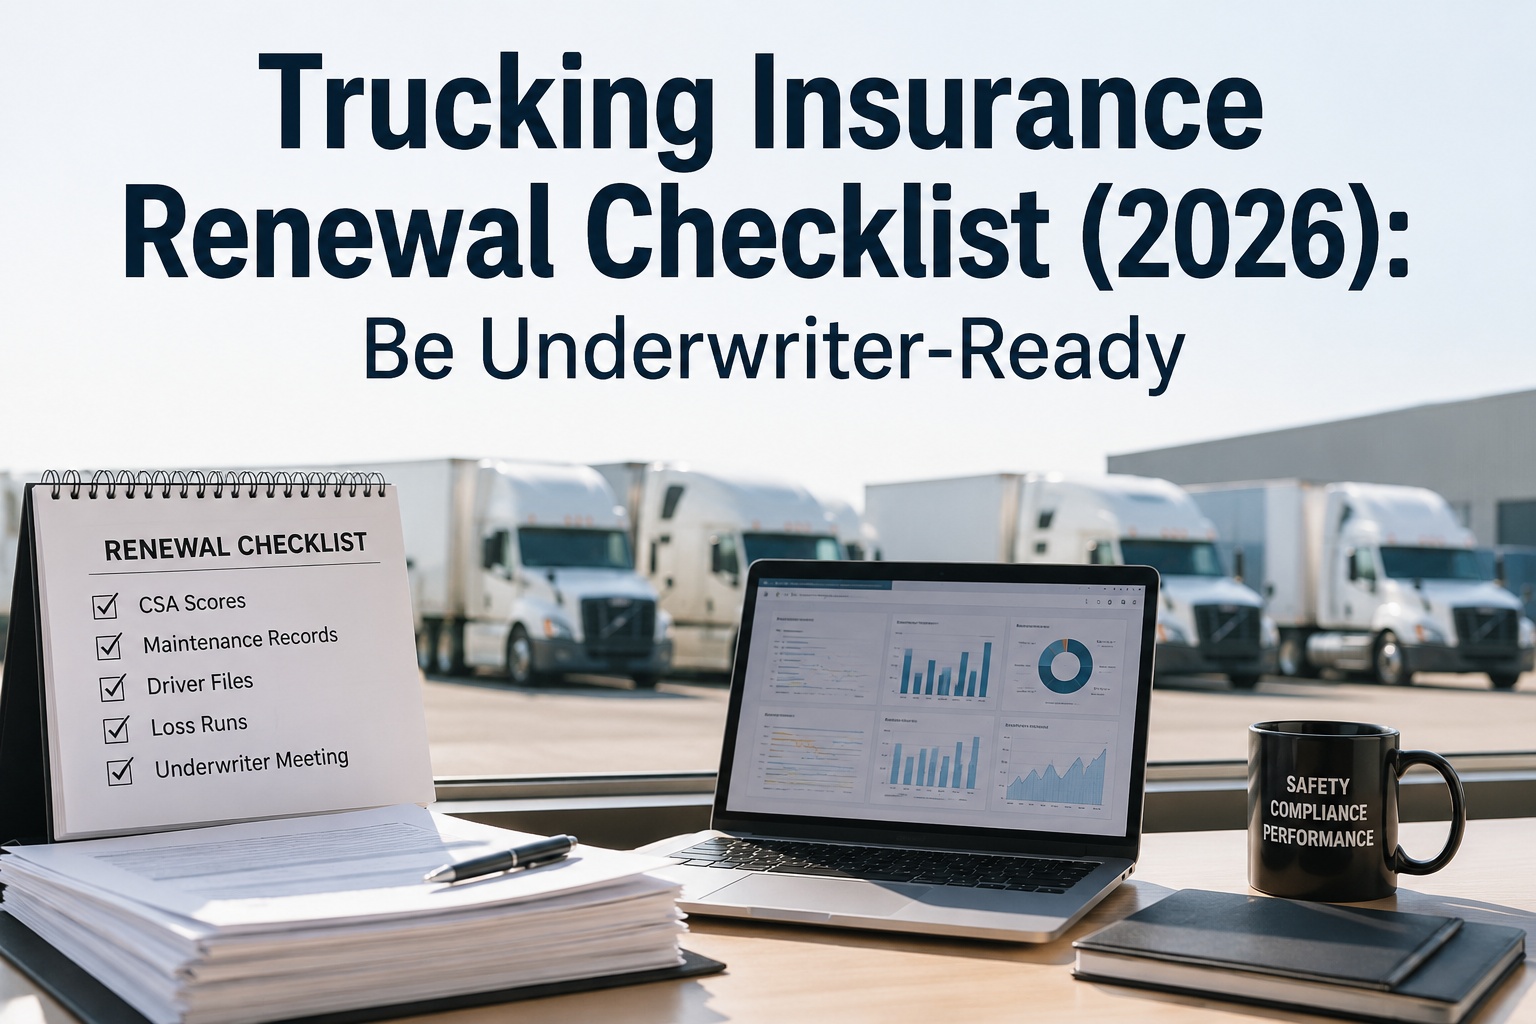
Heavy truck insurance cost keeps climbing every year, even as accident rates drop. The reason isn't just nuclear verdicts and litigation funding — it's that most fleets show up at renewal with the same story every insurer has heard a thousand times. The fleets that show up with underwriter-ready documentation move up the insurance tier ladder, and the ones that don't stay stuck paying 20-40% more than they should. Here's exactly what insurers evaluate and how to change the number. Book an HVI demo → to build your renewal file.
Every fleet sits on one of four rungs of the insurance cost ladder.
Where your fleet lands determines what you pay per truck per year. The move between rungs happens at renewal — and it's driven by three things underwriters actually look at: CSA scores, maintenance documentation, and safety program evidence.
Vehicle Maintenance BASIC
are PM-preventable
documented CSA improvement
The 2026 heavy truck insurance cost landscape by fleet tier
Insurance costs scale non-linearly with fleet size. A 50-truck enterprise doesn't pay 50x what a solo owner-operator pays — it typically pays 10-15x at best pricing, because scale unlocks fleet programs, volume discounts, and negotiated rates. But the same enterprise can pay 25x if it's stuck in surplus lines. Where a fleet lands on this table is a function of documentation quality more than fleet size.
Rates are trending up across every tier. ATRI's 2024 data on trucking operational costs shows insurance as one of the fastest-growing line items — and it keeps climbing despite the fact that DOT-reportable crash rates have declined for four consecutive years. The gap is being driven by litigation behavior, aggressive plaintiff attorney tactics, and litigation funding, which have collectively pushed several major carriers to reduce commercial trucking capacity entirely. Book an HVI demo to see how per-truck cost tracking pairs with the documentation that supports lower renewals.
The four factors underwriters actually evaluate
Insurance underwriters aren't guessing at your risk. They pull four specific data sets before quoting your renewal, and the score in each one directly maps to the tier you get placed in. Fleets that arrive at renewal already knowing what these numbers look like — and having the documentation to explain them — consistently negotiate down from where the initial quote lands.
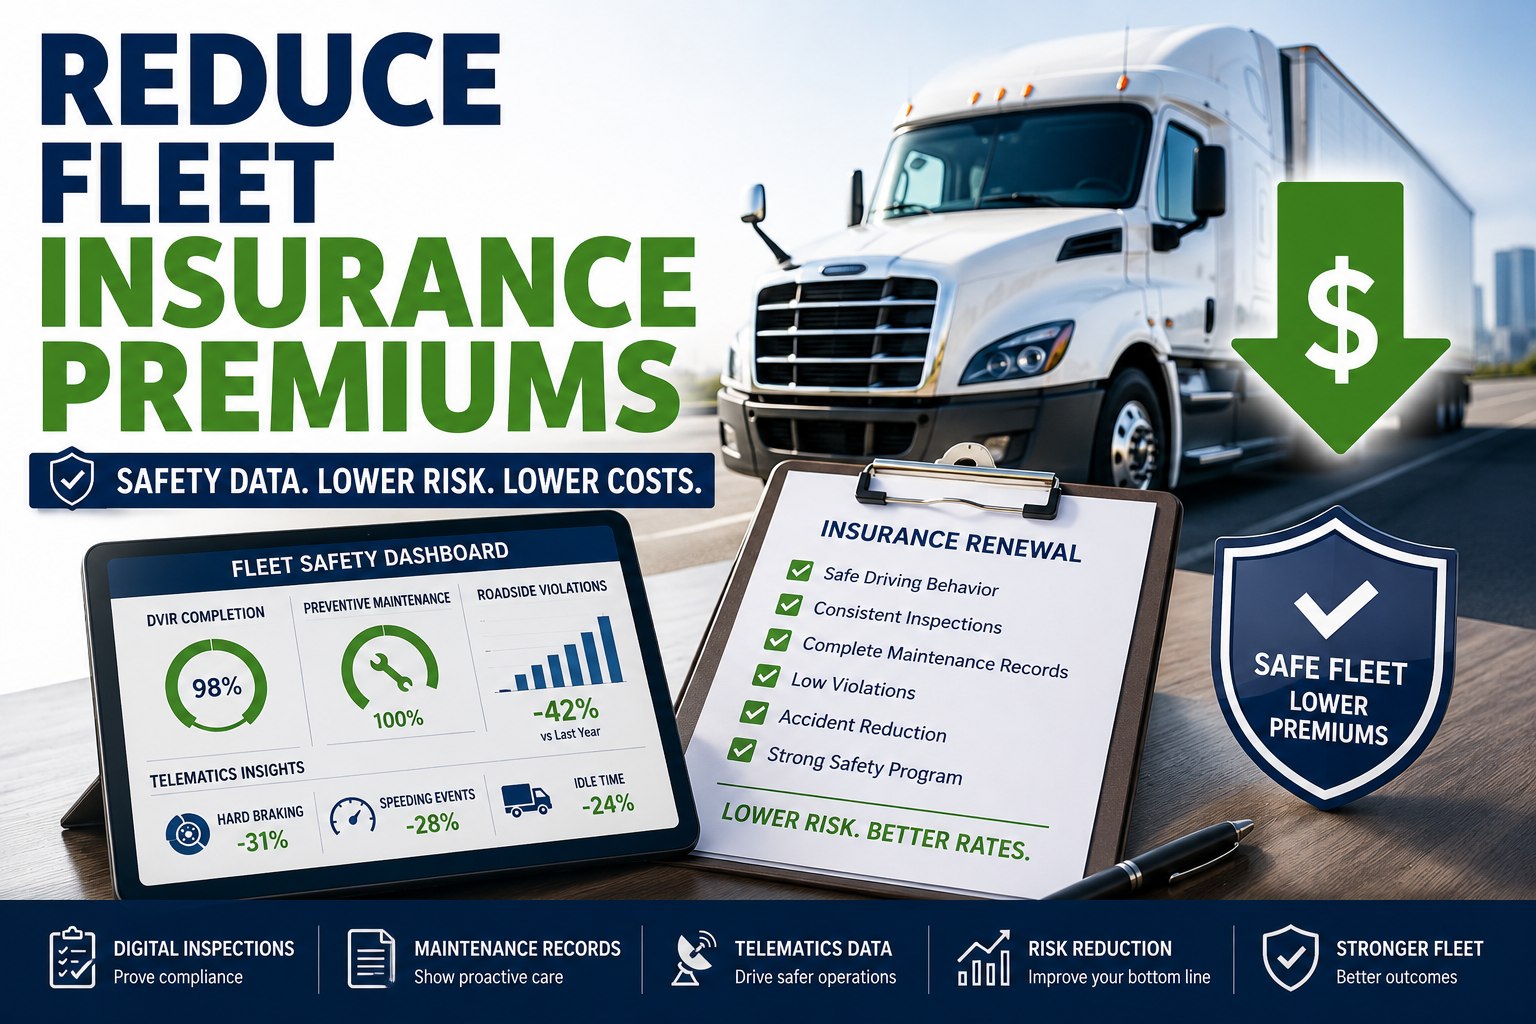
Notice which of the four factors are inside your control. CSA scores can be moved but slowly (24-month rolling window). Loss runs are history — you can't rewrite them. MVR discipline moves the needle over 12+ months. But documented safety program evidence — the maintenance history, the DVIR records, the photo-verified PM completions — that's built in weeks with the right system, and underwriters weight it heavily. Try HVI free to build the documentation portfolio before your next renewal cycle.
The Vehicle Maintenance BASIC — your biggest single lever
Of the four factors underwriters weigh, the Vehicle Maintenance BASIC is the one most fleets can move fastest. It accounts for 34-48% of all CSA points across fleet categories — making it the largest chunk of the CSA score arithmetic. And 73% of vehicle maintenance violations are PM-preventable, which means they're not surprise failures but gradual deteriorations a documented PM program would have caught weeks before the inspection.
The improvement math is straightforward. A fleet at 82nd percentile Vehicle Maintenance (in FMCSA alert territory) that implements documented PM plus DVIR discipline consistently moves to 44th-52nd percentile within 6-7 months — not through DataQ challenges, but because the violations simply stop appearing. And the CSA improvement compounds: shippers stop screening the fleet out, insurance moves from Tier 3 to Tier 2, and the compliance-review risk drops with it. Book an HVI demo to see the exact DVIR + PM template combination that produces the fastest BASIC improvement.
What to bring to the renewal meeting — the underwriter portfolio
Every insurance renewal is a negotiation, and the fleets that bring documentation win negotiations the fleets that just answer questions lose. Here's what a properly assembled underwriter portfolio contains, and what each item does to move the quote.
The fleets that consistently outperform on insurance pricing don't do it with tricks or better negotiators — they do it by treating renewal like a documented business case. Same premium exposure, dramatically different outcome. Try HVI free to auto-generate the portfolio your broker takes to underwriting.
From a fleet operations director who moved from surplus lines back to preferred
We got pushed into surplus lines in 2022 after two at-fault crashes and a spike in our Vehicle Maintenance BASIC to 78th percentile. Our per-truck premium jumped from about $11,000 to $19,400. On 41 tractors that was an extra $344,000 a year on the same operation.
Rebuilt the maintenance program in HVI. Every PM tracked, every DVIR photo-verified, every work order documented. Eighteen months later our Vehicle Maintenance BASIC was at 42nd percentile and we walked into renewal with a 40-page portfolio our broker had never seen from us before. Moved back to standard market at $12,800 per truck. The documentation alone recovered $270,000 annually versus surplus lines pricing.
SMSarah M.Fleet Operations Director · Regional dry-van carrier · 41 Peterbilt tractors
Frequently asked questions
How much does heavy truck insurance cost in 2026?
Heavy truck insurance cost in 2026 ranges from approximately $6,000 to $30,000+ per truck per year depending on fleet tier, CSA performance, and coverage limits. Preferred-tier fleets with clean records and documented safety programs pay $6K-$9K per truck. Standard-market fleets pay $9K-$14K. Elevated-risk fleets in FMCSA alert territory pay $14K-$20K. Fleets pushed into surplus lines (multiple BASIC alerts, poor documentation, high claim frequency) pay $20K-$30K+. The spread between preferred and surplus is often the largest single line-item difference in a fleet's operating budget — and it's driven more by documentation quality than by claims history alone.
How much does a CSA score affect insurance premiums?
CSA score impact on insurance premiums typically runs 10-40% in either direction. Clean CSA performance (below 50th percentile across BASICs) unlocks preferred-tier pricing and safety-technology discounts of 5-30%. Poor CSA performance (multiple BASIC alerts) can push premiums up 20-40% and in severe cases force fleets out of the standard market into surplus lines at 40-80% higher rates. The Vehicle Maintenance BASIC, the Unsafe Driving BASIC, and the Crash Indicator BASIC are weighted most heavily. Insurance underwriters pull CSA data directly from FMCSA's public SMS database at every renewal, so improvement in the 12 months before renewal directly impacts the quote.
Do maintenance records really lower insurance premiums?
Yes, in two ways. Directly: photo-verified maintenance records and DVIR discipline reports are what underwriters use as evidence of a "documented safety program" — the most controllable of the four factors they evaluate. Fleets presenting a proper documentation portfolio at renewal consistently negotiate down from the initial quote. Indirectly: documented PM programs improve the Vehicle Maintenance BASIC (which accounts for 34-48% of CSA points), which in turn moves the fleet up the insurance tier ladder over 6-18 months. Both effects compound. Fleets running paper service records or fragmented spreadsheet PM tracking cannot produce the portfolio underwriters want and pay for the gap.
Why are truck insurance premiums rising if crash rates are declining?
DOT-reportable crash rates have declined for four consecutive years, but premiums have kept climbing. The gap is driven by litigation behavior rather than crash frequency: aggressive plaintiff attorney tactics, the rise of third-party litigation funding, and a wave of nuclear verdicts ($10M+ awards) have pushed several major carriers to reduce commercial trucking capacity or exit the segment entirely. Fewer insurers competing for the same premium volume raises pricing across the board. The result is that even fleets with clean records have seen premium increases — but the fleets with poor records have seen larger increases proportionally, widening the gap between preferred and elevated-risk pricing.
What documentation do underwriters actually want at renewal?
A properly assembled renewal portfolio includes six items: (1) 36-month CSA trend chart per BASIC showing direction of travel; (2) trailing-12-month PM completion rate report (target: above 92%); (3) DVIR discipline report by driver with photo evidence samples; (4) maintenance history per vehicle including work orders, parts, and technician sign-offs for the trailing 24 months; (5) driver MVR pull schedule plus documented termination threshold policy; and (6) corrective action documentation showing how the fleet responded to any violations. Fleets that present this portfolio move down the quote from the initial number. Fleets that just answer questions verbally accept whatever quote appears.
Generate underwriter-ready maintenance and safety records with HVI.
HVI captures photo-verified PM completions, DVIR discipline reports, per-vehicle maintenance history, and CSA trend tracking automatically. The exact renewal portfolio underwriters ask for — assembled in days, not weeks, and available on demand for every insurance meeting. Live for your fleet in 5-7 days.
CSA + FMCSA reporting · DVIR photo evidence · PM audit trail · SOC 2 Type II