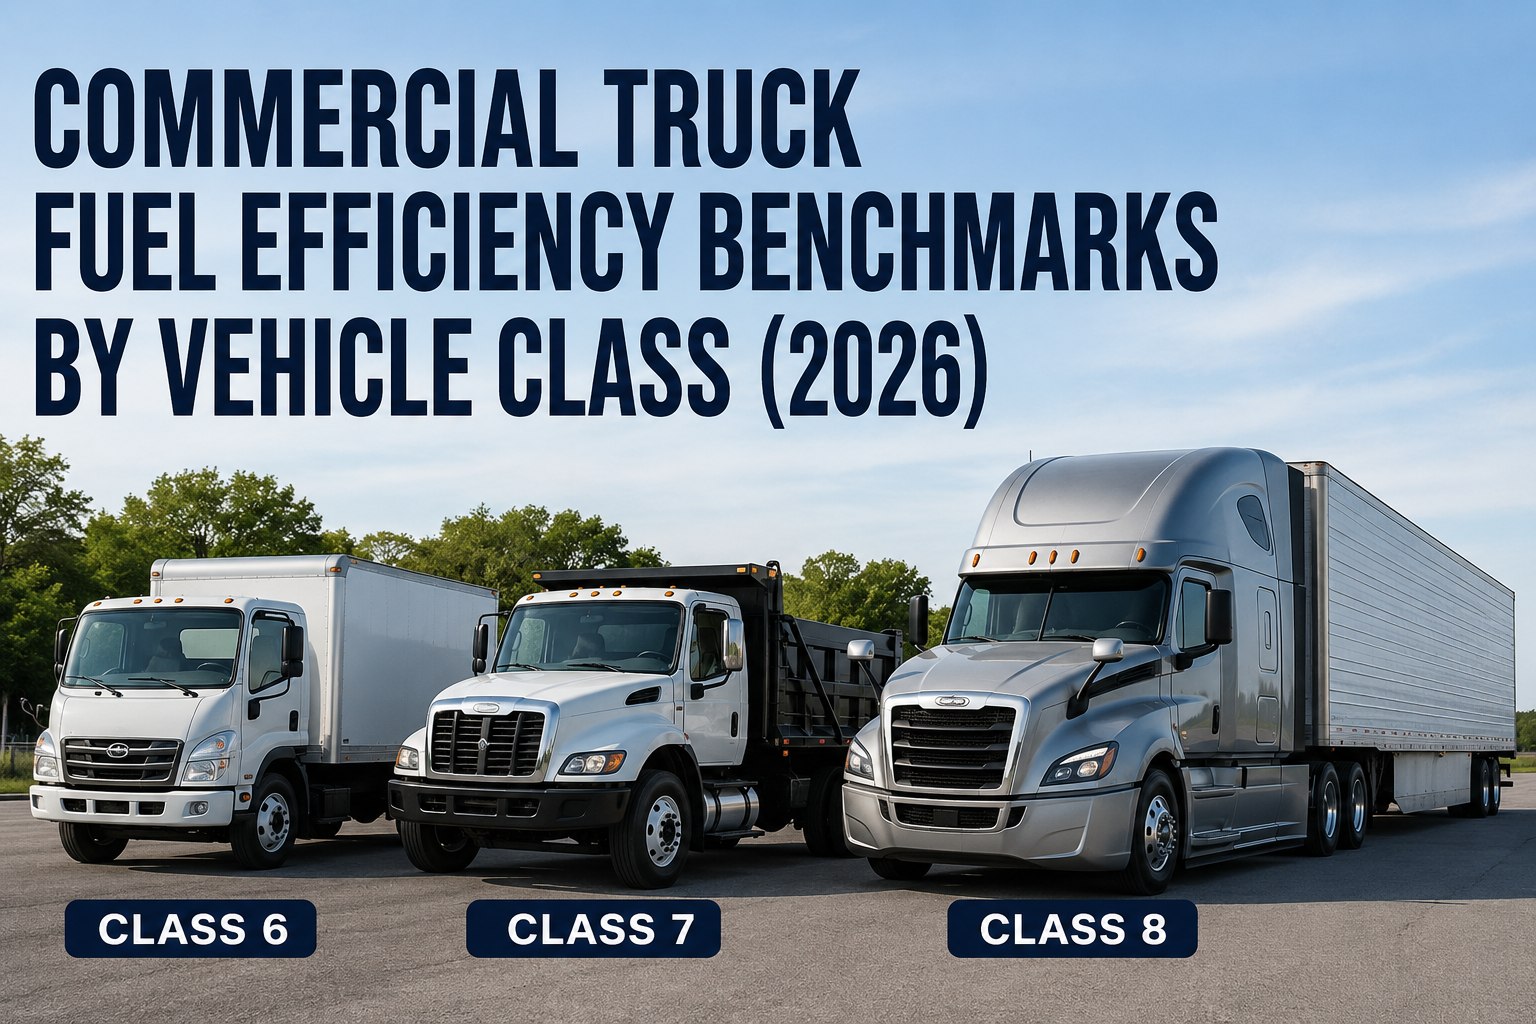
Commercial truck fuel efficiency benchmarks vary dramatically by vehicle class, duty cycle, and operational discipline — and knowing your class-specific number is the first step in reducing what fuel costs your fleet. A Class 8 sleeper tractor pulling a dry van on flat interstate at 62 mph should deliver 7.5–9 MPG in 2026; the same truck configured for regional day-cab work runs 5.5–7 MPG; a Class 8 vocational dump or mixer runs 3.5–5.5 MPG. Class 7 and Class 6 medium-duty trucks are entirely different benchmark curves. NACFE's 2024 Fleet Fuel Study documented a fleet-wide Class 8 average of 7.77 MPG — with best-in-class production trucks demonstrating 10+ MPG on real-world long-haul routes. This 2026 fuel efficiency benchmarks guide walks the class-by-class ranges, the five factors that create variance within any single class, and the four-tier improvement roadmap that moves your fleet from average to best-in-class. Book a demo after you see how per-vehicle MPG tracking closes the gap.
Commercial Truck MPG Benchmarks by Class
The chart below sets the reference point every fleet needs. Compare your average against your class + duty cycle to see whether you're best-in-class, industry average, or undermanaged.
The ranges above set the reference. Below is the class-by-class breakdown — what drives each range, what "best-in-class" looks like, and the four-tier roadmap that moves your fleet from wherever you are today toward the top of your class's benchmark curve.
Class 8 fuel efficiency benchmarks (33,001+ lbs)
Class 8 is the largest commercial category and has three distinct benchmark curves depending on duty cycle. NACFE's 2024 Fleet Fuel Study documented a fleet-wide Class 8 average of 7.77 MPG for its participating fleets in 2023 — up from 6.67 MPG a decade earlier. Best-in-class production trucks now demonstrate 10+ MPG on real-world long-haul routes.
OTR sleeper tractors on interstate routes at consistent highway speeds represent the highest-MPG Class 8 subclass. Aerodynamic package (chassis fairings, roof deflector, trailer skirts, boat tail) plus optimized drivetrain and driver discipline drive this number to 9+ MPG.
Day-cab regional tractors pulling dry vans or reefers on mixed interstate/state-route runs. More frequent stops, tighter delivery windows, and city segments erode MPG compared to long-haul sleeper operation. Regional PTO/reefer accessories add further parasitic load.
Vocational Class 8 units have the lowest MPG in the category. Stop-and-go duty cycles, heavy PTO load, off-road operation, and weight-focused vehicle spec all drive fuel consumption higher. Refuse operations sit at the low end (3.5–4.5 MPG); dump/mixer operations typically 4.5–5.5 MPG.
Fleet MPG in Class 8 is more about duty cycle assignment than truck spec alone. Long-haul units running short-haul city work will report degraded numbers that reflect the misassignment, not the truck. Book a demo to see per-truck MPG segmented by duty cycle
Class 7 fuel efficiency benchmarks (26,001–33,000 lbs)
Class 7 medium-heavy trucks cover box trucks, straight trucks, delivery trucks, and smaller vocational units. Typical MPG runs 6–9 depending on load, drive cycle, and body type. Class 7 has broader spread than Class 8 because the same weight rating covers everything from a straight-body van at 30,000 lb GVW to a construction dump at 32,000 lb GVW — two entirely different fuel curves.
Straight-body vans, box trucks, and beverage trucks on urban delivery routes. High stop density hurts MPG; short trip length reduces engine warm-up efficiency. Route optimization and idle policy drive the biggest gains here.
Utility bucket trucks, service trucks with hydraulic accessories, and light-vocational units. PTO usage and stationary work reduce MPG relative to pure delivery operation.
Class 7 fleets often overlook fuel efficiency tracking because the units aren't running enough miles to make it feel material — but at $3.75/gal and 40,000 miles/year, a 1 MPG improvement equals $2,500+ per truck annually. Start free and benchmark your Class 7 fleet
Class 6 fuel efficiency benchmarks (19,501–26,000 lbs)
Class 6 medium-duty trucks cover walk-in vans, medium box trucks, wreckers, and smaller service vehicles. Typical MPG runs 8–13, with the range driven primarily by body style, route type, and load.
Parcel delivery, courier, and mobile-service vans on high-stop-density urban routes. Modern walk-in vans with hybrid or high-efficiency diesel powertrains land at the top of this range.
Local freight, moving trucks, and general cargo Class 6 units. Higher body weight and more mixed drive cycle put these below walk-in van MPG despite similar GVW rating.
Class 6 vehicles benefit disproportionately from route optimization and idle policy — both of which cost nothing to implement and typically deliver 8–12% fuel savings in the first quarter. Book a demo to see Class 6 fuel workflow in HVI
5 factors that create MPG variance within the same class
Two identical Class 8 sleeper tractors running similar routes can deliver 1.5–2 MPG difference from each other — a $7,000–$10,000 annual per-truck gap. The variance almost always traces to five recurring factors, ranked by impact.
Aerodynamics + truck spec
Chassis fairings, roof deflector, trailer skirts, boat tail, and side extenders together can swing MPG 20–30% versus an un-aero'd tractor. This is a one-time spec decision that pays every mile the truck operates.
Highway speed above 65 mph
Every mph above 65 costs roughly 0.1 MPG. A truck running 70 mph averages ~0.5 MPG less than the same truck at 65 mph. Speed limiters at 65–68 mph are the single fastest zero-capex MPG intervention available.
Tire pressure + rolling resistance
Every 1% drop in tire pressure = 0.3% rise in fuel consumption (U.S. DOE data). A truck with tires at 90 PSI when spec calls for 105 PSI loses 4–5% MPG continuously until corrected. TPMS closes this gap the day it happens.
Idle time percentage
Every gallon burned at idle produces zero miles, pulling effective fleet MPG down. A truck rated at 6.5 MPG that idles 15% of engine-on time delivers an effective 5.5 MPG. Idle policy plus telematics visibility recovers most of this.
Driver behavior
On identical routes with identical trucks, best-performing drivers can deliver 25–30% better MPG than lowest-performing drivers. Progressive shifting, coasting into stops, minimizing hard accel, and avoiding excessive braking are all trainable habits.
Stack all five factors and the theoretical MPG improvement on a Class 8 sleeper is 1.5–2.5 MPG — a 20–30% real gain on the same physical truck. The gap between "average" and "best-in-class" isn't a hardware question. Book a demo to see all 5 factors tracked automatically
4-tier roadmap to improve fleet fuel efficiency
Moving a fleet from industry-average MPG toward best-in-class is a stacked sequence, not a single intervention. Each tier compounds on the ones before it — and the biggest MPG lever (driver behavior) comes last, after the data infrastructure that supports coaching is in place.
Baseline & benchmark
Establish per-vehicle MPG baseline over 30–60 days. Segment by class, duty cycle, driver, and route. Compare against class benchmark. Know your number before you try to change it.
Fix low-hanging fruit
Tire pressure discipline (weekly checks or TPMS), 5-minute idle policy, 65 mph speed limiter, aerodynamic spec review on next tractor order. Zero to low capex, immediate impact.
Add monitoring technology
TPMS retrofit or OEM install, ELD-integrated fuel tracking, per-vehicle MPG dashboards with variance alerts, fuel card GPS reconciliation. Provides the data infrastructure that Tier 4 requires.
Driver coaching + scorecards
Weekly per-driver MPG rankings, bottom-quartile coaching, positive reinforcement for top performers, and progressive shift/coast/braking training programs. Highest-impact tier, requires Tier 3 data to work.
Layered consistently, the four tiers move a fleet from industry-average MPG toward the top quartile of its class — a 15–25% total improvement on the same physical trucks. No new tractors required. Just the discipline stack, applied in order. Start free and put Tier 1 in place this week
From a fleet operations director on the two-year benchmark journey
When we first ran the numbers in Q1 2024, our Class 8 sleeper fleet averaged 6.4 MPG. Below the NACFE fleet average of 7.77 for that segment. We knew we were bleeding money on fuel but nobody could quantify by how much per truck.
Twenty-four months later — TPMS on every tractor, 65 mph speed limiter, hard idle policy, weekly driver scorecards, per-truck MPG on the operations dashboard — we're at 7.9 MPG fleet-wide. Best drivers are hitting 9+. That's roughly $6,200 per truck per year we're not spending on diesel anymore, at the current fuel price. On 82 tractors, it's real money.
Frequently asked questions
What's the average MPG for a Class 8 commercial truck in 2026?
The 2026 industry-wide Class 8 average sits around 6.5–7.0 MPG for the general population of 1.7 million US tractors, based on NACFE and DOE data. However, participating fleets in NACFE's 2024 Fleet Fuel Study averaged 7.77 MPG in 2023 — up from 6.67 MPG a decade earlier, a 16% improvement over 10 years. Latest model year Class 8 sleepers in NACFE's tracked fleets are now delivering 8.0–9.5 MPG, and best-in-class production trucks demonstrate 10+ MPG on real-world long-haul routes. The wide gap between average and best-in-class reflects driver behavior, aerodynamic spec, tire pressure discipline, idle policy, and route type — not the truck itself. A Class 8 sleeper on flat interstate at 62 mph with an aero package should deliver 7.5–9 MPG. The same tractor at 70 mph without an aero package, on hilly routes, with a poor idle rate might deliver 5.5–6 MPG. The variance is management, not machinery.
How does Class 6 vs Class 7 vs Class 8 fuel economy compare?
Fuel economy generally increases as vehicle class decreases — smaller and lighter trucks deliver more miles per gallon. Class 6 medium-duty trucks (19,501–26,000 lbs) average 8–13 MPG, with walk-in vans at the top of the range and heavier box trucks near the bottom. Class 7 trucks (26,001–33,000 lbs) run 6–9 MPG typically, with straight-body delivery trucks near the upper end and utility/vocational units near the lower. Class 8 combination tractors (33,001+ lbs) run 3.5–8 MPG depending heavily on duty cycle: long-haul sleeper 6.5–8 MPG, regional day cab 5.5–7 MPG, vocational (dump/mixer/refuse) 3.5–5.5 MPG. The MPG gap is driven primarily by weight, drive cycle, and body style rather than engine efficiency — modern Class 8 diesel engines are actually more thermally efficient than smaller diesels, but the load they're pulling offsets the efficiency advantage.
What's a good fleet fuel efficiency benchmark to target?
The right target depends on class and duty cycle. For Class 8 long-haul sleepers, target the top quartile of the NACFE fleet study range: 8+ MPG fleet-wide is achievable in 2026 with disciplined operations, and 9+ MPG is best-in-class. For Class 8 regional day cabs, target 6.5+ MPG fleet-wide with a stretch goal of 7+. For Class 8 vocational operations, target the upper end of the 3.5–5.5 range for the specific duty cycle (refuse toward 4.5, dump/mixer toward 5.5). For Class 7 delivery, target 8+ MPG. For Class 6 walk-in, target 11+ MPG. Every fleet should benchmark quarterly against these ranges and against its own historical baseline, and any per-truck deviation of 8% or more from fleet average should trigger investigation — the cause is usually mechanical (injectors, DPF, tires), operational (route, load, driver assignment), or behavioral (aggressive driving pattern).
How much money does 1 MPG improvement save a fleet?
The savings from a 1 MPG improvement depend on truck class, annual miles, and current fuel price. For a Class 8 long-haul tractor running 100,000 miles per year at $3.75/gal diesel, moving from 6.5 to 7.5 MPG saves approximately 2,050 gallons per year — roughly $7,700 per truck annually. On a 50-truck fleet, that's $385,000 per year in fuel cost avoided. For a Class 7 delivery truck running 40,000 miles/year at 7 MPG, moving to 8 MPG saves approximately 715 gallons — roughly $2,680 per truck annually. For Class 6 walk-in vans at 25,000 miles/year moving from 10 to 11 MPG, savings are around $850 per truck annually. The point is that MPG improvement compounds every mile the truck operates, and even a 0.5 MPG improvement across a large fleet is a five- or six-figure annual savings. This is why per-vehicle MPG tracking and coaching is one of the highest-ROI investments a fleet can make.
What's the fastest way to improve fleet fuel efficiency?
The fastest zero-capex intervention is a 5-minute idle policy plus a 65 mph speed limiter, which together typically deliver 5–8% MPG improvement within 30 days. The fastest low-capex intervention is retrofit TPMS ($500–800 per truck), which recovers 1–3% MPG within weeks by keeping tires at spec pressure. The fastest structural improvement is per-vehicle MPG tracking with weekly driver scorecards, which typically drives 3–5% improvement within one quarter through the coaching-plus-transparency effect alone. Combined, these three changes reliably deliver 10–15% MPG improvement in the first 90 days on any fleet that hasn't previously had them in place — without buying a single new truck or changing routes. The four-tier improvement roadmap in this guide walks the exact sequence to layer them in the right order, and per-vehicle MPG dashboards make each intervention measurable rather than aspirational.
Turn class benchmarks into a managed fleet KPI
HVI tracks per-vehicle MPG against class + duty-cycle benchmarks, flags variance beyond 8% for investigation, correlates efficiency with driver, route, load, and maintenance data, and generates driver scorecards for weekly coaching. Live in under two weeks — and typical fleets identify 1–2 MPG of recoverable performance in the first quarter.
No credit card · No hardware · MPG dashboard ready day one