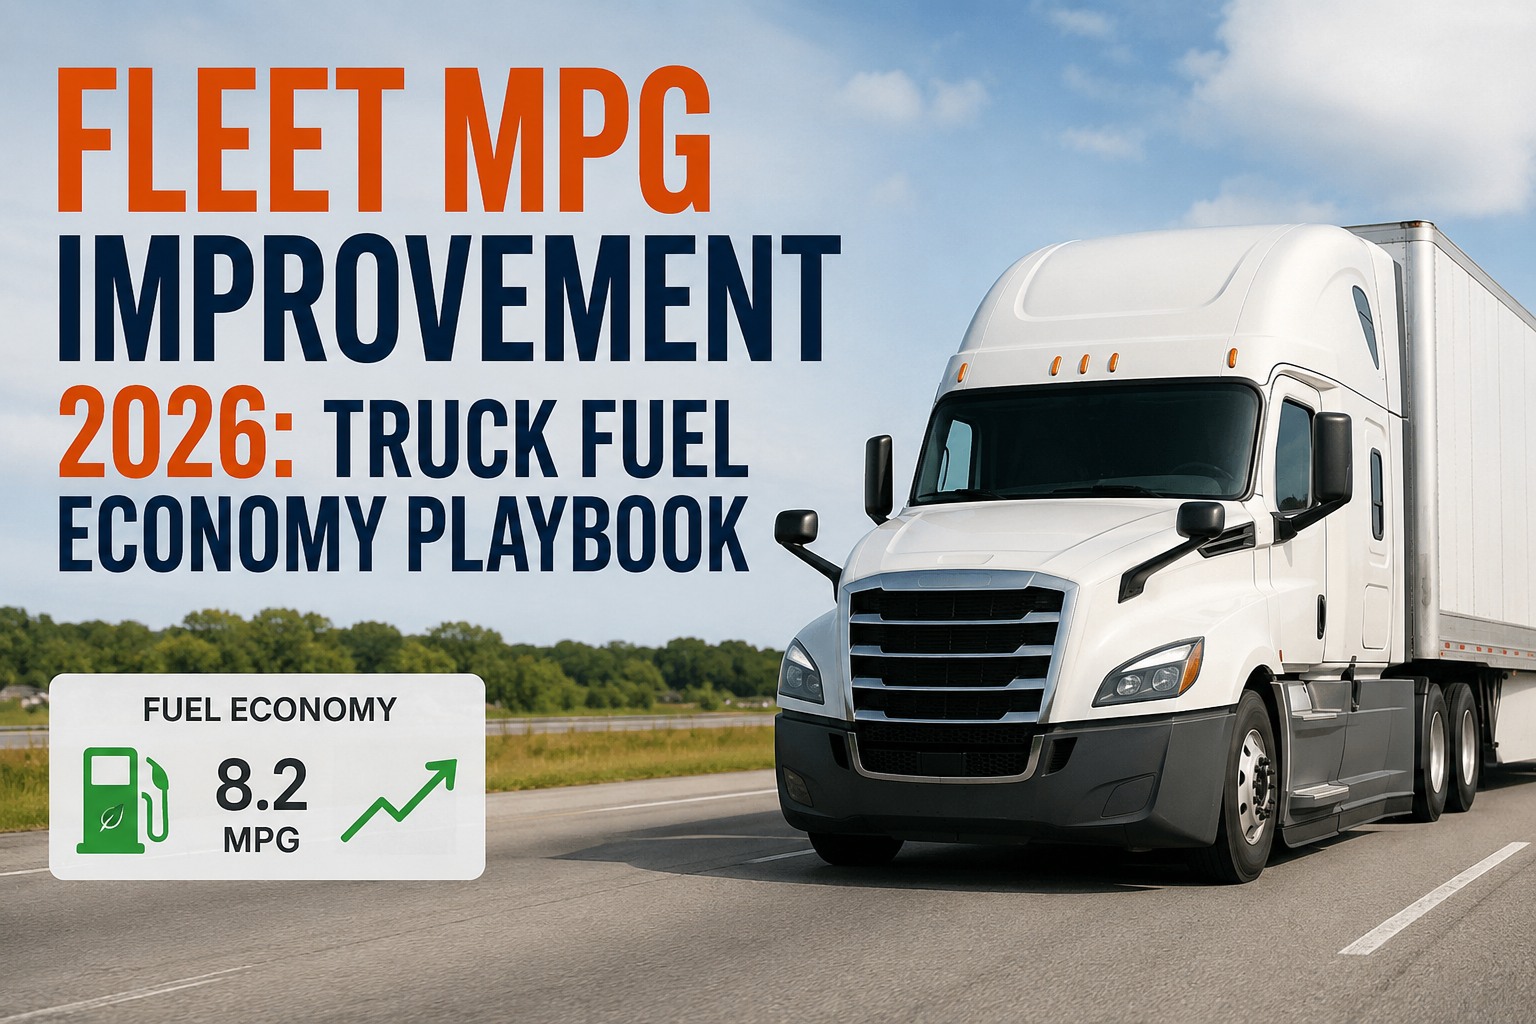
Fleet MPG improvement is a stacked program, not a single tactic. Driver coaching alone adds 3-8%. Tire pressure discipline alone adds 2-3%. Aerodynamic add-ons alone add 3-5%. Idle reduction alone adds 4-8%. Preventive maintenance discipline alone adds 2-4%. Applied together on a 6.2 MPG baseline fleet, the compounding math produces 7.4-8.0 MPG within 12 months and $50,000-$120,000 in annual fuel savings per 25-truck cohort. This playbook walks the 5-lever waterfall in the order that produces the fastest measurable gains — book a demo to measure fleet MPG improvement per unit in HVI.
Fleet MPG Improvement Waterfall — The 5 Levers That Stack to +1.5 MPG
No single tactic moves the needle enough. Five sequenced interventions do. Here is what each contributes, in what order, on what timeline.
Assumes 100,000 miles/truck/year @ $3.85/gal. Numbers stack multiplicatively, not additively. Baseline range varies by duty cycle; long-haul highway trucks start higher, vocational and stop-start trucks start lower.
The rest of this page walks how to establish a valid MPG baseline (the number 90% of fleets calculate incorrectly), the sequencing logic behind the 5-lever order (why idle reduction comes first and PM discipline comes last), what each lever actually costs to deploy, how to attribute MPG changes back to the specific intervention that produced them, and how to build a program the CFO will fund past month 3. Book a 30-minute demo to see per-truck MPG capture and lever attribution in HVI.
Establishing a valid MPG baseline — the number most fleets get wrong
Fleet MPG improvement programs live or die on the baseline. If the starting number is wrong, every gain claim is disputed and the CFO defunds the program at month 3. Most fleets calculate baseline MPG incorrectly by dividing total gallons purchased by total miles driven across the whole fleet, then reporting the single number. That approach hides three failure modes that show up later.
| Baseline mistake | What breaks later | Right approach |
|---|---|---|
| Fleet-wide average | Mixed duty cycles average out; refuse truck at 3 MPG cancels highway tractor at 8 MPG. Improvement invisible. | Segment baseline by duty cycle class (long-haul, regional, vocational, stop-start) |
| Single month baseline | Seasonal variation (winter fuel, cold-start burn, HVAC load) makes any single-month baseline unreliable. Program shows "gain" that's just seasonality. | Rolling 12-month baseline captures all seasonal variation |
| Purchased-gallons baseline | Fuel purchases include personal fills, container fills, and card fraud. Baseline inflated; improvement claims collapse under audit. | Tank-sensor consumption baseline (actual gallons delivered to tank) |
| Ignoring load factor | Empty return trips vs loaded outbound trips produce 15-25% MPG variance. Load-blind baseline hides the real intervention target. | Loaded-MPG and empty-MPG tracked separately per unit |
A defensible baseline is per-truck, per-duty-cycle, over a rolling 12-month window, using tank-sensor consumption rather than card purchases, with load state captured. That baseline can survive CFO scrutiny and support attribution for every lever pulled downstream. Without it, the program is running on assertions. Book a demo to see per-truck MPG baseline capture with load-state segmentation in HVI.
The 5-lever sequence — why order matters more than intensity
Fleets often try the biggest tactic first. Aerodynamic packages are expensive and take 6-9 months to install; driver coaching feels soft; idle reduction feels obvious. The right order isn't ranked by expected gain — it's ranked by cost, deployment speed, and measurement clarity. First interventions establish measurement discipline and quick wins that fund the harder work later.
Idle reduction — week 1-4
Zero-cost intervention: written 5-min idle policy, ECM idle-alert deployment, weekly reporting. Fastest measurable win (6.5% MPG typical), builds program credibility, funds later work. Skip driver-behavior interventions until idle is under control — too many overlapping variables.
Driver coaching — week 4-12
Weekly per-driver scorecards for hard acceleration, hard braking, over-speed. Bottom-quartile coached, top-quartile recognized. 4.5% MPG typical. Requires idle already under control (otherwise idle noise obscures behavior signal).
Tire discipline — month 3-6
Weekly PSI inspection, quarterly alignment, tread-depth tracking per position. Underinflated tires cost ~3% MPG; alignment issues add 1-2%. Sensor-based TPMS raises detection to near-real-time. 2-3% MPG typical, but eliminates a noise source in later measurements.
Aerodynamics — month 4-9
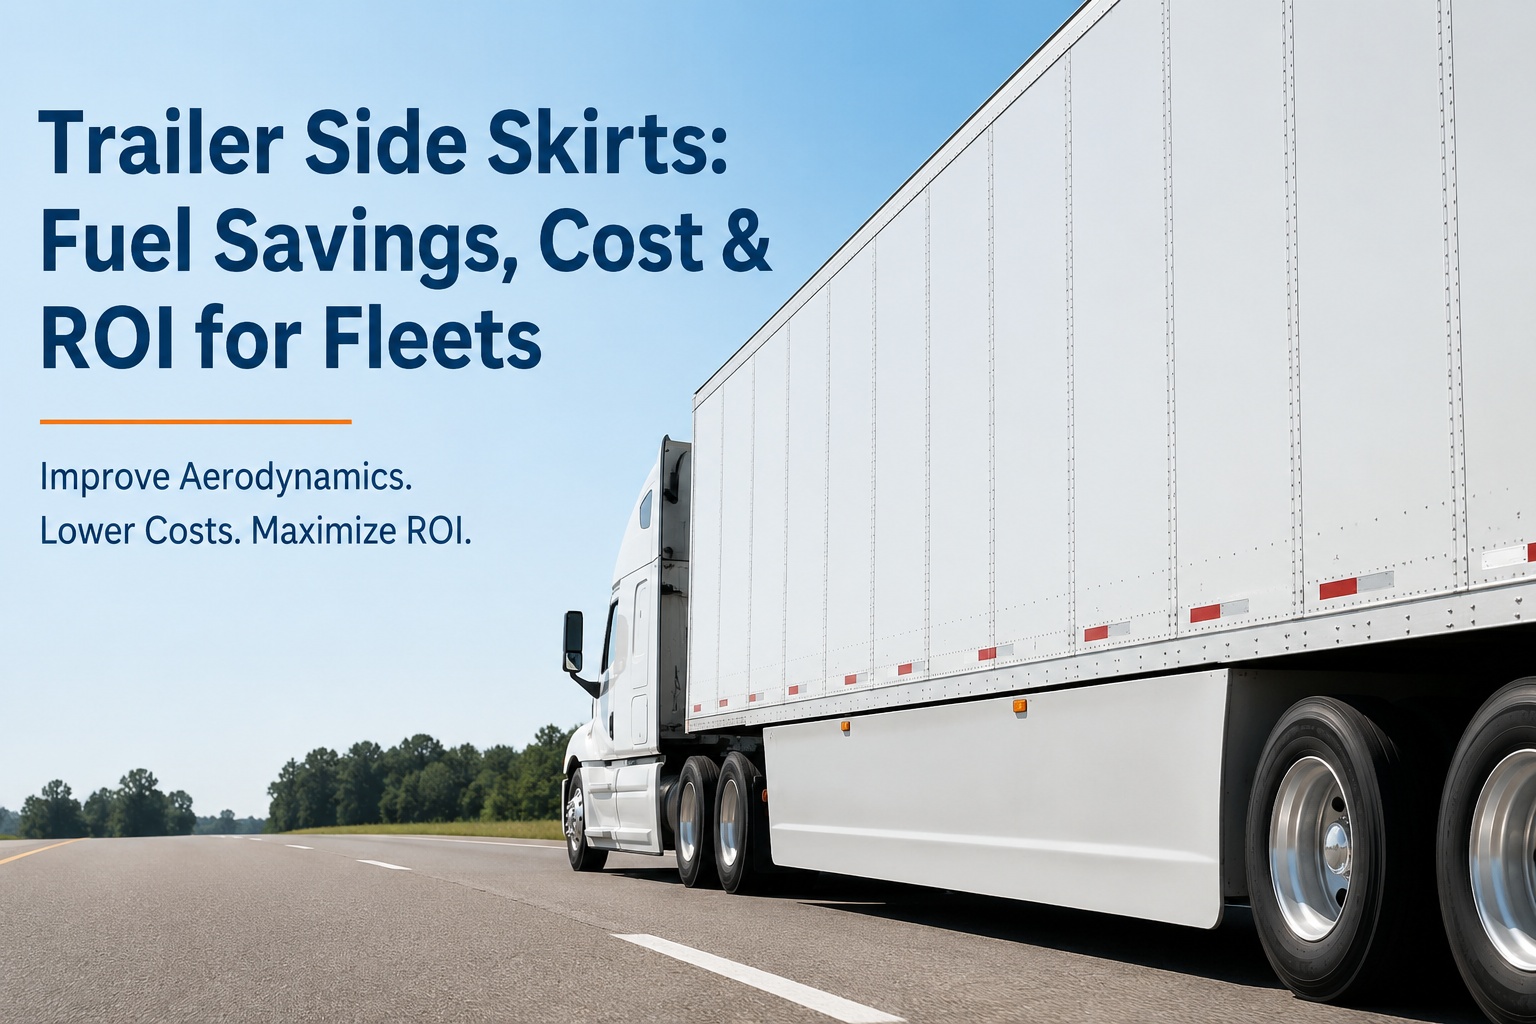
Trailer skirts, tail fairings, gap fairings, mirror aerodynamics. Higher capex ($800-$2,500 per trailer), longer deployment. Adds 3-5% MPG on highway duty; less on regional. Delay this lever until behavioral gains are locked in and measured — otherwise attribution is impossible.
The fifth lever, preventive maintenance discipline, runs continuously across all of the above and produces its own 2-4% gain by catching MPG-degrading mechanical issues before they compound. Injectors, EGR, DPF, and turbo issues all show up as MPG decline weeks before they become failure events. Sensor-triggered PM prevents the mechanical noise that would otherwise contaminate every other lever's measurement. Book a demo to see per-lever attribution in HVI as the program rolls forward.
Cost per lever and expected payback timing
Each of the 5 levers has a different cost profile, deployment complexity, and payback window. Some are pure discipline (idle policy costs nothing but produces the largest early gain). Others require capital (aerodynamic packages payback in 12-24 months depending on annual mileage). A CFO-defensible program shows all 5 with their cost, expected gain, and payback horizon on one page — not as ambition but as commitments the fleet manager will hit and the finance team can plan around.
Idle reduction
- Cost: $0 (policy) + $25-45/vehicle/month telematics
- Deployment: 30 days
- Gain: 4-8% MPG typical
- Payback: 30-60 days
Driver coaching
- Cost: Coaching time + scorecard software
- Deployment: 60-90 days
- Gain: 3-8% MPG typical
- Payback: 60-90 days
Tire & alignment
- Cost: TPMS $150-400/vehicle + alignment labor
- Deployment: 90 days rolling
- Gain: 2-3% MPG typical
- Payback: 90-180 days
Aerodynamics
- Cost: $800-$2,500 per trailer (skirts + tail)
- Deployment: 6-9 months rolling
- Gain: 3-5% MPG typical (highway)
- Payback: 12-24 months
Layered in this order across 12 months, the program produces roughly $4,900 per Class 8 tractor per year of net fuel savings after all lever costs are subtracted — on a 25-truck cohort that's $122,500 per year, on 100 trucks $490,000 per year, on 500 trucks $2.45M per year. These are conservative numbers based on published fleet case studies. The scale is what makes MPG improvement one of the highest single-point-of-return fleet programs available. Start a free HVI trial to run the baseline audit on your current fuel data.
A fleet director on the program that survived month-3 CFO review
We're a 143-tractor regional carrier, mixed dry van and reefer, US Southeast. Started our MPG improvement program in March 2024 at a 6.4 MPG baseline. Our CFO gave us 90 days to prove the program before continuing funding. Standard skeptical-CFO ask — and fair. Two prior consultant-led programs had burned $180K without producing anything measurable.
We ran the sequence exactly as it works: idle policy + telematics alerts in weeks 1-4 (moved fleet idle from 28% to 11%; MPG lifted from 6.4 to 6.8 by end of week 6, measured tank-sensor to tank-sensor, not statement to statement). Driver coaching weeks 4-12 (scorecard-driven; bottom-quartile drivers 20% below fleet average were coached weekly; MPG lifted to 7.1 by week 12). At the 90-day CFO review we presented tank-sensor baseline vs current, dollar savings run-rate of $71K annualized, and next-lever cost/gain projections. Program was extended to year 1 in the same meeting.
Year-1 close: fleet MPG at 7.6 (+1.2 from baseline), fuel spend down $312K vs prior year on same route mix, program investment $67K total. What made the CFO trust the numbers wasn't the gain claim — it was that we were measuring per-truck at tank-sensor level, segmenting by duty cycle, and attributing each lever independently. The credibility of the baseline is what funded the program. Without it we'd have been shut down in June like the last two attempts.
Frequently asked questions
What is a realistic fleet MPG improvement target?
A realistic 12-month target for a Class 8 highway fleet starting from a 6.0-6.5 MPG baseline is 7.4-8.0 MPG, representing a 15-25% fuel-cost reduction on the same route mix and load pattern. That target is achievable through a stacked 5-lever program (idle reduction, driver coaching, tire discipline, aerodynamics, PM discipline) rather than any single tactic. Individual lever contributions on a typical Class 8 highway fleet: idle reduction 4-8% MPG improvement, driver coaching 3-8%, tire and alignment 2-3%, aerodynamics 3-5% (highway routes only), PM discipline 2-4%. These stack multiplicatively rather than additively, so the combined gain is typically 15-25% rather than the arithmetic sum of individual gains. Different duty cycles produce different results: long-haul highway fleets see the largest aerodynamics gain, regional fleets see the largest driver-coaching gain, vocational and stop-start fleets see the largest idle-reduction gain. Baseline matters — a fleet starting at 5.5 MPG has more headroom than one starting at 7.0. Any target above 30% improvement without changing route mix or truck spec should be treated skeptically; the underlying math generally doesn't support gains that large without capex on new tractors or route restructuring.
Which fleet MPG improvement lever produces results fastest?
Idle reduction produces the fastest measurable MPG improvement of any lever, typically showing results within 30-45 days of policy deployment with telematics alerts. Idle reduction is a zero-cost intervention (a written 5-minute idle policy plus ECM-based idle alerts) that immediately eliminates the largest source of pure fuel waste on most fleets. Class 8 tractors burn 0.8-1.0 gallons per hour at idle, and undermanaged fleets routinely run 25-40% idle time. Cutting that to under 10% recovers roughly 4-8% of total fuel spend. Because idle reduction is measured directly (idle hours per truck per day) rather than inferred from MPG, the effect is visible in reporting within days rather than needing weeks of accumulated data to distinguish signal from noise. Driver coaching produces the second-fastest results (60-90 days), followed by tire discipline (90 days rolling as PSI checks and alignments cycle through). Aerodynamics is the slowest lever to deploy (6-9 months rolling install) but produces sustained gain thereafter. Preventive maintenance discipline is continuous rather than event-based, contributing 2-4% MPG that stabilises after 3-6 months of consistent sensor-triggered PM execution. Fleets that sequence properly (idle first) produce visible wins that fund the harder work; fleets that start with aerodynamics or new tractor spec typically stall at CFO review because early gains are invisible.
How do I calculate my fleet's current MPG baseline correctly?
Correctly calculating a defensible fleet MPG baseline requires four discipline steps that most fleets skip. First, segment by duty cycle: separate baselines for long-haul highway, regional, vocational, and stop-start operations. Averaging a refuse truck at 3 MPG with a highway tractor at 8 MPG produces a fleet number that hides where improvement actually happens. Second, use a rolling 12-month window rather than a single month. Seasonal variation (winter fuel formulation, cold-start burn, HVAC load, tire pressure changes with temperature) makes any single-month baseline unreliable and produces false "gains" that are just seasonality. Third, use tank-sensor delivered gallons rather than fuel-card purchased gallons. Card purchases include personal fills, container fills, and fraud, all of which inflate the denominator and produce a baseline that collapses under audit. Fourth, capture load state (loaded vs empty) per trip. Empty return trips vs loaded outbound trips produce 15-25% MPG variance that must be normalised before intervention effects become visible. A baseline computed per-truck, per-duty-cycle, over rolling 12 months, tank-sensor gallons, load-normalised is defensible to a CFO and supports lever attribution downstream. Anything less is an assertion, not a baseline, and MPG improvement programs built on weak baselines rarely survive month-3 review.
Does driver coaching actually improve fleet MPG?
Yes, consistently. Well-implemented driver coaching programs typically improve fleet MPG by 3-8% within 90 days, with sustained gain thereafter when the coaching cadence is maintained. The mechanism is behavioural: hard acceleration, over-revving, over-speed, and hard braking each waste measurable fuel per event. Telematics captures these events per driver per shift; weekly scorecards rank drivers by fuel-efficiency composite score; bottom-quartile drivers receive structured coaching (typically 15-20 minutes weekly with the operations manager); top-quartile drivers receive recognition, sometimes tied to fuel-bonus programs. Fleet case studies routinely show 8-12% MPG improvement from coaching the bottom 20% of drivers alone, without any spec or route changes. Two failure modes explain why some coaching programs produce no gain. First, coaching without measurement is aspirational: telling drivers to "drive more smoothly" without per-driver telematics scoring produces no measurable change because there is no accountability signal. Second, coaching without idle reduction first produces noisy data: idle burn dominates behaviour signal on undermanaged fleets, so coaching results are indistinguishable from random variation until idle is under control. Sequenced correctly (idle first, then coaching), driver-coaching gains are among the most reliable in the 5-lever program and among the lowest-cost to deploy.
How long before a fleet MPG improvement program pays back?
A well-sequenced program produces net-positive fuel savings within 60-120 days of launch and full 12-month program payback within 6-12 months on typical Class 8 fleet economics. The early payback comes from idle reduction and driver coaching, both of which cost little to deploy (policy plus telematics scoring) and produce measurable MPG gain within weeks. On a 25-truck fleet with $500,000 annual fuel spend, even a 4% MPG improvement in the first 90 days is $20,000 annualised savings against a $5,000-$15,000 telematics-plus-scorecard investment. Later levers (tire discipline, aerodynamics, PM discipline) carry higher deployment cost but longer payback horizon (12-24 months on aerodynamics) offset by sustained multi-year returns. Total program economics across the 5-lever stack on a typical 25-truck Class 8 cohort: $50,000-$120,000 first-year net fuel savings against $30,000-$60,000 total program investment (telematics, TPMS, aerodynamic packages, coaching time). Year-2 economics are stronger because most of the capex has been absorbed and the ongoing costs are lower. Programs that produce nothing at 90 days almost always fail at CFO review; programs that produce documented $20,000+ annualised savings at 90 days routinely get extended to full 12-month funding and become permanent operational disciplines. The baseline discipline and lever sequencing described in this playbook are what separate the two outcomes.
The baseline. The waterfall. The proof. In one system.
HVI captures per-truck MPG from ECM and tank sensor, segments by duty cycle, tracks load state per trip, and attributes each MPG delta to the specific lever that produced it. Program-month reports show CFO what was invested, what was returned, and what the next lever is worth. From 6.2 baseline to 7.7 target with data the finance team can defend. Live in under two weeks. No hardware. No credit card.
Trusted by fleet MPG programs across USA, Canada, UK, EU & Australia · Ready on day one