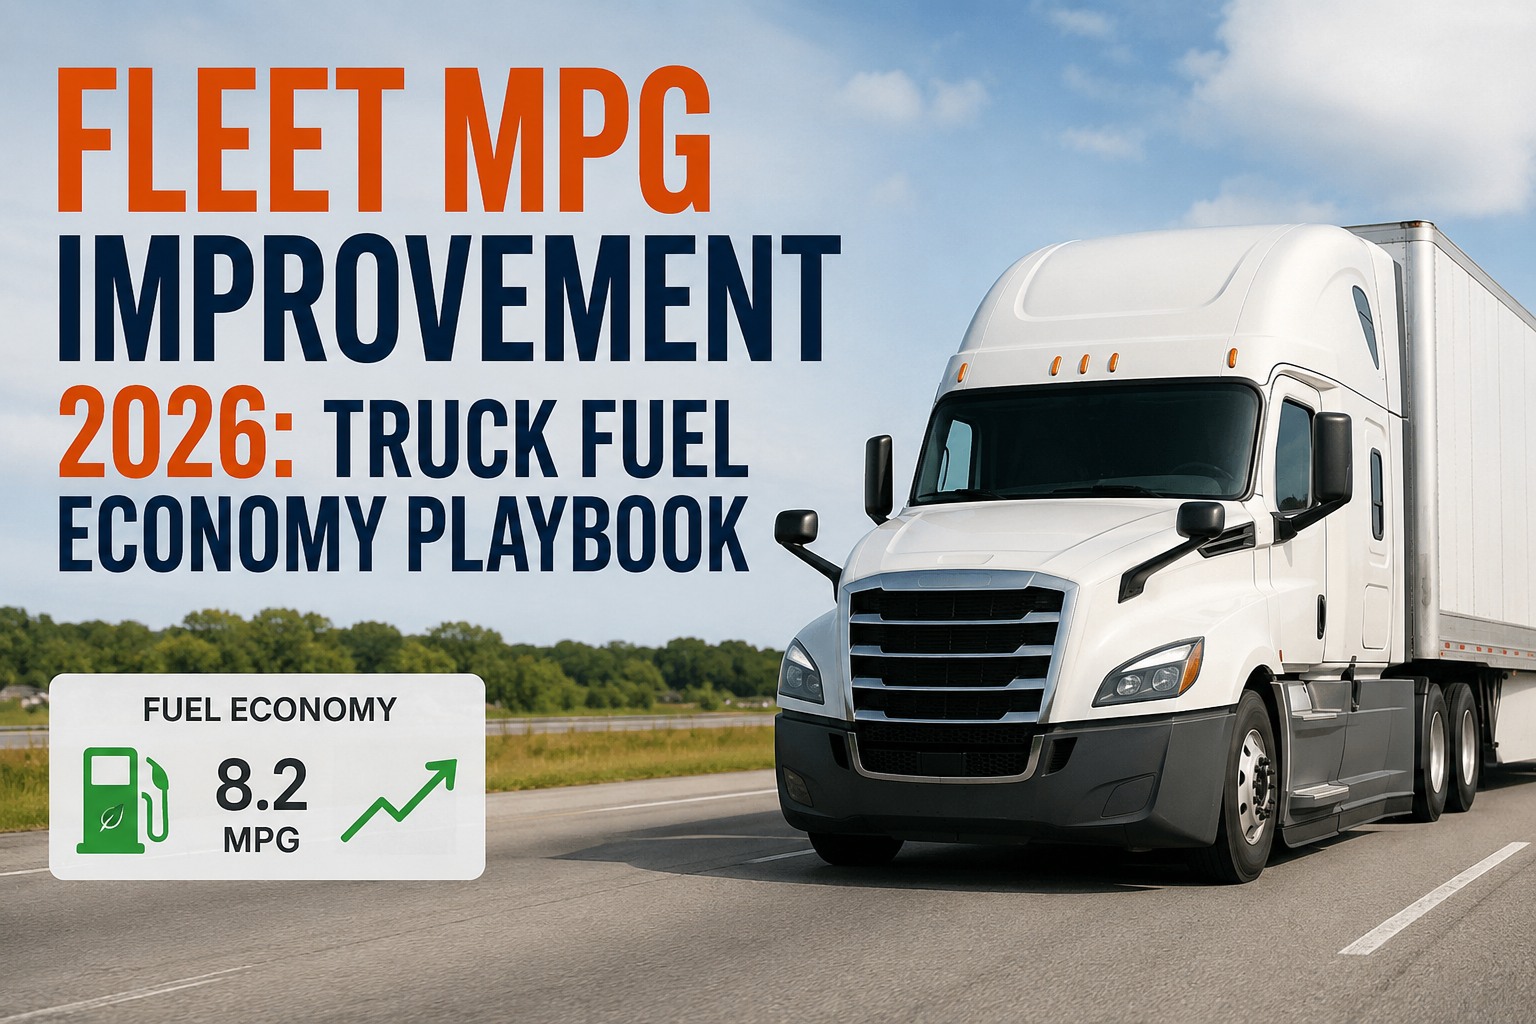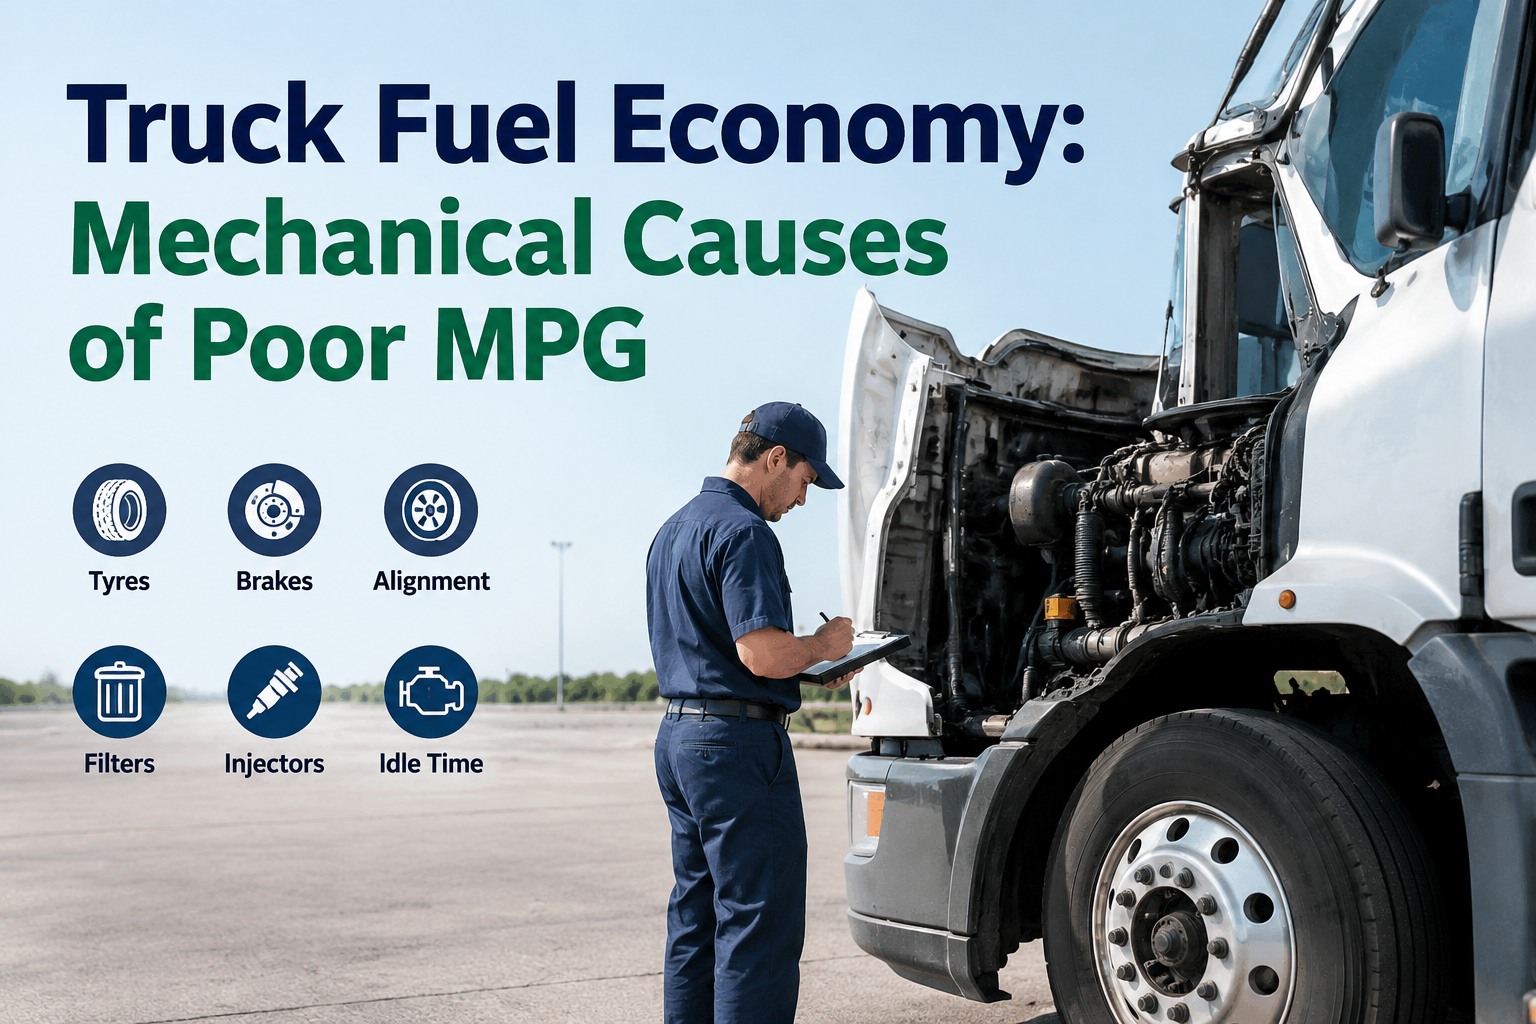
Truck fuel economy improvement is the topic every fleet director wants to solve with driver coaching, but the mechanical layer usually holds the largest recoverable MPG. A truck rated at 6.5 MPG delivering 4.8 has lost 1.7 MPG somewhere — and that "somewhere" is a stack of small mechanical losses (tire pressure, brake drag, alignment, filters, injectors, aero damage, idle), individually easy to dismiss, collectively worth $8-12K per truck per year — book a demo to find fuel economy losses by asset in HVI.
The Truck Fuel Economy Waterfall — Where Each MPG Goes
Nothing dramatic breaks. Seven small mechanical losses each subtract a fraction. Stacked, they eat 25% of the spec MPG before driver behaviour is even considered.
Each drop is fixable. Stacked, they cost roughly $8-12K per truck per year at moderate fuel prices — and they trace back to specific inspection findings, not to driver behaviour.
The rest of this page walks each of the seven mechanical causes with the specific inspection or diagnostic that catches them, the typical repair, and the fleet-level analytics that turn a slow MPG deterioration into a specific corrective work order. Book a 30-minute demo to see per-asset MPG trending against maintenance history in HVI.
The 7 mechanical causes ranked — and how to catch each
The seven mechanical causes below account for roughly 20-30% total MPG loss on undermanaged trucks. Rank order varies by fleet duty cycle (long-haul weights tire/aero more heavily; regional weights brake drag/idle more heavily), but the causes themselves are universal across Class 6-8 diesel operations.
Injector wear & combustion
- MPG penalty: 5-15% (largest single mechanical loss)
- Symptom: gradual MPG decline, black smoke, rough idle
- Detect: fuel trim data, cylinder balance, injector spray test
- Fix: clean or replace injector, address root cause (fuel quality)
- Cost: $200-400 clean-and-test / $600-1,200 replacement per injector
Excessive idle time
- MPG penalty: 3-8% depending on % idle time
- Symptom: 0.6-1.0 gal/hr with zero miles produced
- Detect: telematics, ECM data, driver scorecards
- Fix: 5-min idle policy, APU where applicable, driver coaching
- Reference: NACFE avg truck idles ~1,000 hours/year
Tire pressure
- MPG penalty: 1-3% typical, up to 10% at 30+ PSI under-inflation
- Symptom: uneven wear, sidewall heat, TPMS may not warn early
- Detect: cold-check with calibrated gauge against OEM spec (typically 100-120 PSI Class 8)
- Fix: daily driver check, TPMS with alert threshold, PM cadence
- Note: 30-40% of trucks run underinflated per industry estimates
Brake drag
- MPG penalty: 2-5% depending on severity
- Symptom: silent — no dashboard warning, no driver report
- Detect: wheel-end IR temp scan, >50°F delta between sides = suspect
- Fix: caliper service, slack adjuster, brake shoe replacement
- Bonus: catches early wheel bearing failure too
Wheel & axle alignment
- MPG penalty: 2-4% on misaligned truck-trailer
- Symptom: tractor "not tracking" with trailer, uneven tire wear
- Detect: annual thrust angle alignment check, after any impact
- Fix: laser alignment on tractor + trailer, correct axle geometry
- Note: also extends tire life by 15-30%
Aerodynamic damage
- MPG penalty: 2-5% depending on component
- Symptom: broken skirt, missing mud flap, damaged deflector
- Detect: pre-trip visual, driver damage reporting
- Fix: replace damaged aero components, tighten fasteners
- Note: aero drag is ~50% of total fuel burn at highway speed
Air & fuel filter restriction
- MPG penalty: 1-2% per filter, up to 3-4% combined
- Symptom: reduced power, ECM restriction sensor
- Detect: intake restriction sensor value, fuel pressure test, visual
- Fix: replace on restriction, not calendar (avoids waste and misses)
- Note: extended interval on premium filters if PM cadence supports it
Thermostat & cooling
- MPG penalty: 1-3% if engine runs cold or hot
- Symptom: operating temp below 82°C or above spec
- Detect: ECM temp data, thermostat function test
- Fix: thermostat replacement, cooling system service
- Note: often overlooked but affects every mile of every trip
Each finding has a specific inspection or diagnostic that catches it, and each catches earlier when the fleet runs regular structured inspections with photo evidence and defect flow. A driver who reports "truck feels down on power" translates to injector wear findings in the shop; a technician wheel-end IR scan translates to brake drag findings; a monthly ECM download translates to combustion, restriction, and idle data. The compounding matters: two of these causes at moderate severity often produces the same MPG penalty as one at severe. A truck with mild injector wear (~5%), mild brake drag (~2%), and mild under-inflation (~2%) delivers effectively the same MPG loss as a truck with severely worn injectors alone — but the diagnostic difficulty and repair cost profile are entirely different. That's why the systematic-through-all-seven approach beats the "find the biggest single problem" approach on almost every real fleet. Book a demo to see per-asset MPG correlated with maintenance and inspection findings in HVI.
The benchmarking method — why the fleet-wide MPG number lies
Fleet-wide MPG averages hide almost everything worth knowing. A fleet averaging 5.8 MPG can be composed of 40 trucks running 6.5 MPG and 40 trucks running 5.1 MPG, and treating them as one bucket produces a fleet-wide coaching intervention that helps neither group. The right method segments MPG by asset, then compares like-for-like across duty cycle, route, payload, season, and equipment spec.
| Segment MPG by | Why it matters | Data source |
|---|---|---|
| Asset (per truck) | Identifies outliers (top 20% and bottom 20% by MPG) for targeted investigation | Per-truck fuel and mileage records |
| Route / lane | Terrain, speed, and traffic differ per route; benchmark within route | Telematics route capture + fuel |
| Payload / weight | Every 1,000 lb added weight = ~0.05-0.10 MPG reduction | Bill of lading / scale ticket |
| Season | Winter fuel, cold-start losses, headwind, HVAC load | Fuel and mileage by month |
| Driver | Same truck can vary 8-12% MPG between best and worst driver | Telematics driver ID + fuel |
| Equipment spec | Aero package, tyres, transmission, axle ratio all affect baseline expectation | Asset record with spec sheet |
| Duty cycle | Long-haul highway vs regional stop-and-go have very different baselines | Route category classification |
Once MPG is segmented, the diagnostic question changes from "why is our fleet MPG low?" to "why is Truck 247 running 12% below its cohort of 8 comparable trucks on the same lane with matched payload?" — a specific question with a specific answer. The waterfall causes above (injectors, idle, tire pressure, brake drag, alignment, aero, filters) are exactly where that investigation lands. Start a free HVI trial to segment fleet MPG by asset, route, and driver.
From MPG outlier to closed corrective action — the workflow that recovers the number
A per-asset MPG outlier flag is the trigger, not the finding. Four steps convert an MPG anomaly into a closed corrective action and a recovered fuel economy trend line.
Detect outlier
Truck's MPG is 8-15% below cohort baseline for 30+ days after adjusting for route, payload, season. Flag automatically or on manual review of per-asset MPG trend.
Structured investigation
Work through the 7-cause waterfall in order of likelihood for the fleet's duty cycle. Long-haul first-check injectors and aero; regional first-check idle and brake drag. Photo evidence and ECM data on each check.
Confirmed defect → work order
Every confirmed defect becomes a work order with parts, labour estimate, responsible technician, and due date. Not a note on a clipboard — a tracked action with closure evidence required.
Post-repair verification
Track MPG for 30-60 days after work order closure. Recovered MPG confirms the fix; unchanged MPG triggers the next-most-likely cause in the waterfall. Closed loop.
The last step matters more than most fleets treat it. A closed work order without post-repair MPG verification is a work order that may or may not have solved the problem. Systematic verification is what separates a fleet that recovers fuel economy from one that just spends money on parts and hopes. Verification also protects the analytics: an unfixed root cause (e.g., contaminated fuel that will re-foul new injectors within 60 days) surfaces immediately on the post-repair trend, where a fleet without verification simply cycles through the same repair every few months. Every MPG anomaly ends in one of three states — closed with recovered trend, closed with degraded trend triggering deeper investigation, or closed without change indicating the root cause was elsewhere in the waterfall. All three outcomes are useful. The unlogged, unverified close is the one that isn't. Book a demo to see MPG-outlier detection with automatic work-order flow in HVI.
A maintenance manager on the 47-truck outlier investigation that recovered $180K/year
We're a regional fleet, 82 tractors, dry van. Q1 2024 our fleet MPG had slipped from 6.4 to 5.9 over two quarters and management wanted a driver-coaching push. Fleet engineering pushed back — we segmented MPG per asset and found 47 trucks running within normal range of their cohort baseline, 12 trucks running 8-15% below cohort.
Ran the 7-cause investigation on the bottom 12. Three had injector spray-pattern faults (not throwing codes, just underperforming). Four had wheel-end brake drag we caught with an IR scan — slack adjusters out of spec. Two had aero damage (broken skirts, torn deflectors). Two had extended idle from a specific yard where drivers waited for load assignments. One was a mismatched tire spec from a recent replacement.
Closed all the corrective actions in 8 weeks. Fleet MPG back to 6.35 by end of Q2, saved roughly $180K on annualised fuel spend across those 12 trucks, plus roughly $40K in avoided premature tire replacement from the alignment and drag findings. If we'd done fleet-wide driver coaching we'd have addressed maybe 2 of the 12.
Frequently asked questions
What are the main mechanical causes of poor truck fuel economy?
Seven mechanical causes account for most recoverable MPG loss on Class 6-8 diesel trucks. In typical order of penalty size: (1) injector wear and combustion issues (5-15% MPG loss on advanced wear), which is the largest single mechanical loss because it affects every combustion cycle; (2) excessive idle time (3-8% MPG loss depending on % idle), where a truck at idle burns 0.6-1.0 gallons per hour producing zero revenue miles; (3) tire pressure (1-3% typical, up to 10% at 30+ PSI under-inflation), where every 10 PSI below spec adds rolling resistance; (4) brake drag (2-5%), a silent loss with no dashboard warning that constant caliper or slack-adjuster resistance produces; (5) wheel and axle alignment (2-4% on misaligned truck-trailer), where a tractor not tracking with its trailer wastes energy on lateral drag; (6) aerodynamic damage (2-5% depending on component), where broken skirts, missing mud flaps, or damaged deflectors add drag at highway speed; (7) air and fuel filter restriction (1-2% per filter). Preventive maintenance addressing these can produce 5-10% fuel savings per Penske Truck Leasing data, worth $3,500+/year per long-haul truck per EPA estimates.
How much does tire pressure affect truck MPG?
The US Department of Energy reports fuel economy drops about 0.2% for every 1 PSI decrease in average tire pressure across the vehicle. On a Class 8 truck with 10 tires typically inflated to 100-120 PSI cold, this means a truck running 10 PSI below spec on all tires loses roughly 1-2% MPG; a truck running 30 PSI below spec (common on undermanaged fleets) can lose up to 10% MPG per Penske Truck Leasing operational data. Industry estimates place 30-40% of trucks on the road as running with at least some underinflation at any given time. Tire pressure monitoring systems help but often trigger only after significant PSI drop, missing the gradual leaks that most affect fuel economy. Cold-check with a calibrated gauge against OEM specification (typically 100-120 PSI for Class 8 steer and drive tires) at pre-trip inspection is the reliable detection method. TPMS with alert thresholds set at 5 PSI below spec catches gradual leaks earlier than default TPMS. Beyond MPG, underinflation dramatically accelerates tire wear, which is often a larger dollar impact than the fuel penalty.
How do I diagnose brake drag on a truck?
Brake drag is one of the "silent" fuel losses because it produces no dashboard warning and no obvious driver-reported symptom, yet costs 2-5% MPG on affected wheel ends. Three practical detection methods. First, wheel-end infrared temperature scan after a driving cycle: a healthy wheel end at operating temperature sits within a narrow band on both sides of an axle; a difference of more than 50°F between sides on the same axle strongly suggests drag on the hotter side. Do this at PM intervals and after any driver report of pull, vibration, or reduced acceleration. Second, rolling resistance test: with the truck on level ground and no brakes applied, individual wheels should turn freely; noticeable resistance beyond normal seal friction indicates caliper stick, slack adjuster issue, or wheel bearing binding. Third, ECM and fuel data: a truck showing MPG below cohort baseline with no other explanation warrants a brake investigation, because brake drag looks like every other cause of MPG loss on the fuel data alone. Corrective action typically involves caliper service, slack adjuster replacement, or brake shoe/lining renewal — and often catches early wheel bearing failure that would have surfaced expensively later.
How much fuel does idling waste?
A Class 8 diesel at idle burns 0.6 to 1.0 gallons per hour depending on engine size, accessory load, and outside temperature, producing zero revenue miles. NACFE estimates that the average truck idles about 1,000 hours per year; the EPA estimates that each year long-duration truck idling consumes about 1 billion gallons of fuel in the US. On a 1,000-hour idle profile at $3.85/gal diesel, that's roughly $2,900-$3,850 per truck per year in pure idle fuel cost — before accounting for accelerated engine wear (idle prevents DPF regeneration cycles from completing, adds cylinder wear, degrades DEF injectors), the effective MPG penalty (every idle hour drops fleet-average MPG for the reporting window), and the maintenance tail (roughly 25 miles of engine wear per idle hour per ATA data). The single largest lever on idle reduction is a 5-minute idle policy with telematics enforcement, driver scorecards, and where duty cycle supports it, APU installation for legitimate driver-comfort or PTO needs. Fleets moving from 30% idle to under 10% idle typically recover $100K-$500K per year on 100-truck fleets.
Should I diagnose fuel economy by driver or by asset?
Both, but asset-first is the more productive investigation on most fleets. A fleet-wide MPG number that has slipped 5-10% over 6-12 months typically has 15-25% of trucks running significantly below their cohort baseline (matched for route, payload, season, and equipment) with specific mechanical causes, and 75-85% of trucks running within normal cohort range. Fleet-wide driver coaching addresses only the driver-behaviour portion (usually 8-12% variance between best and worst driver on the same truck) and does not fix the mechanical portion at all. The right sequence: segment MPG per asset first, identify the bottom 20% by cohort baseline, run the mechanical waterfall investigation (injectors, idle, tire pressure, brake drag, alignment, aero damage, filters) on those specific trucks, close the confirmed defects, then verify MPG recovery. Driver coaching still matters but as a parallel workstream on the driver-behaviour portion of the variance, not as a substitute for the mechanical investigation. Fleets that reverse the sequence (coach drivers first, then investigate mechanics if the number does not improve) typically waste 3-6 months chasing an incomplete answer.
Recover your fleet's lost MPG on data — truck by truck, finding by finding
HVI captures per-asset MPG from telematics or manual fuel logs, flags outliers below cohort baseline, correlates the trend against maintenance history and inspection findings, converts confirmed defects (injector fault, brake drag, alignment, aero damage, filter restriction) into corrective work orders with responsible person and due date, and verifies MPG recovery post-repair. Fleet-wide MPG stops being a mystery number and becomes a per-truck maintenance signal. Live in under two weeks. No hardware. No credit card.
Trusted by fleets recovering fuel economy across USA, Canada, UK & Australia · Ready on day one