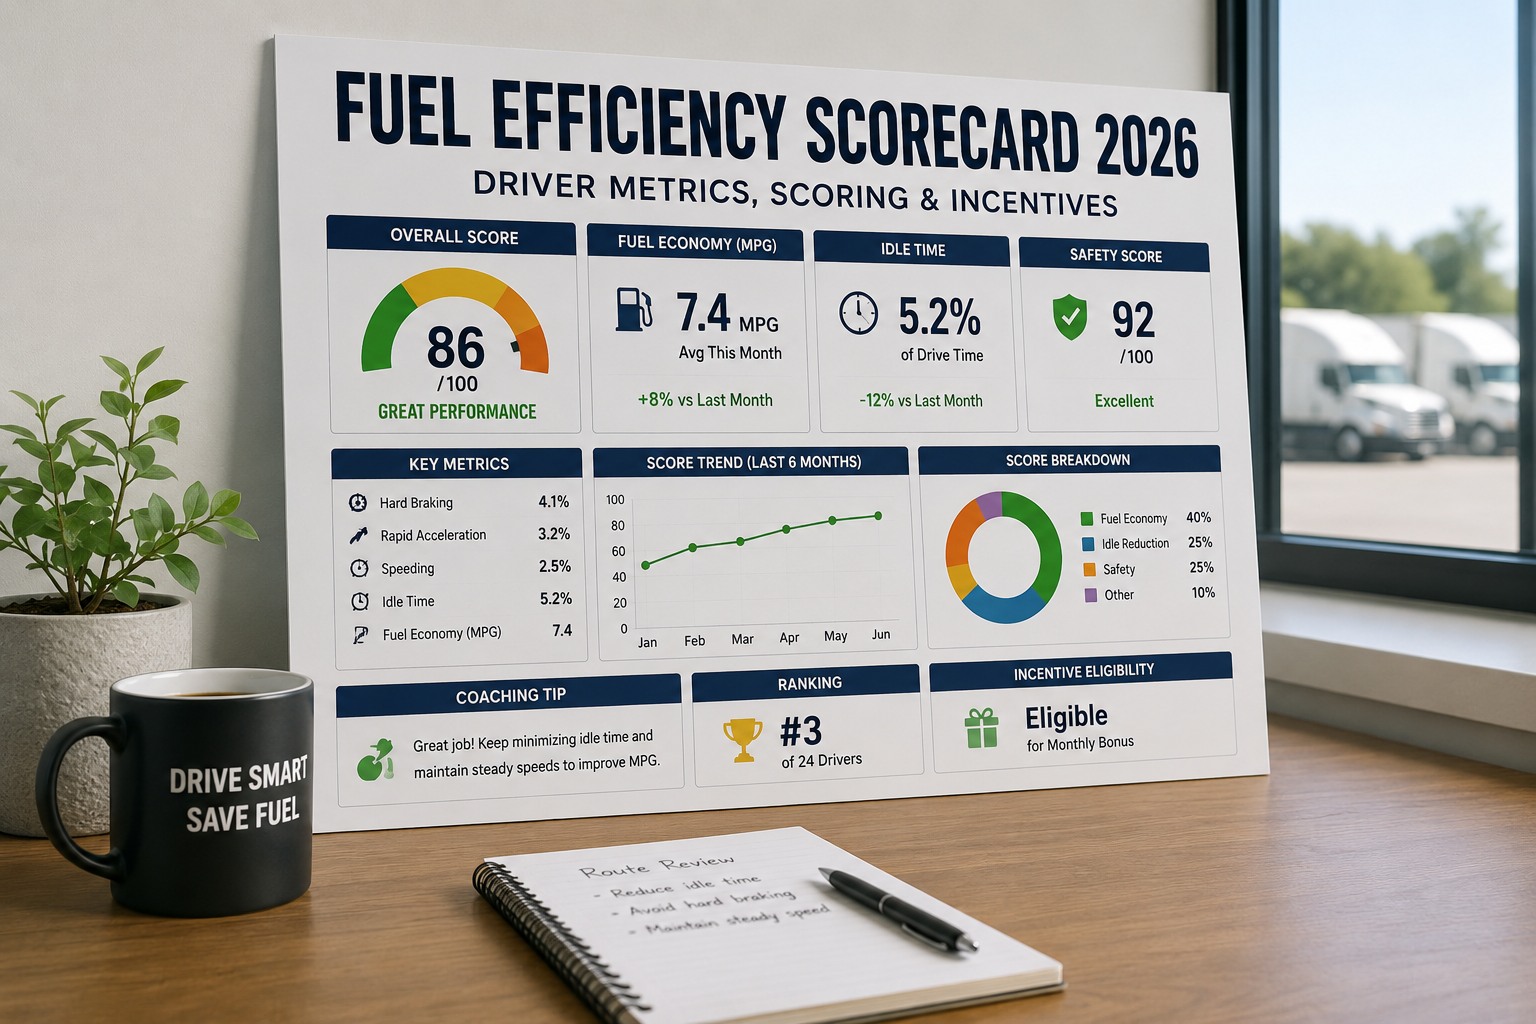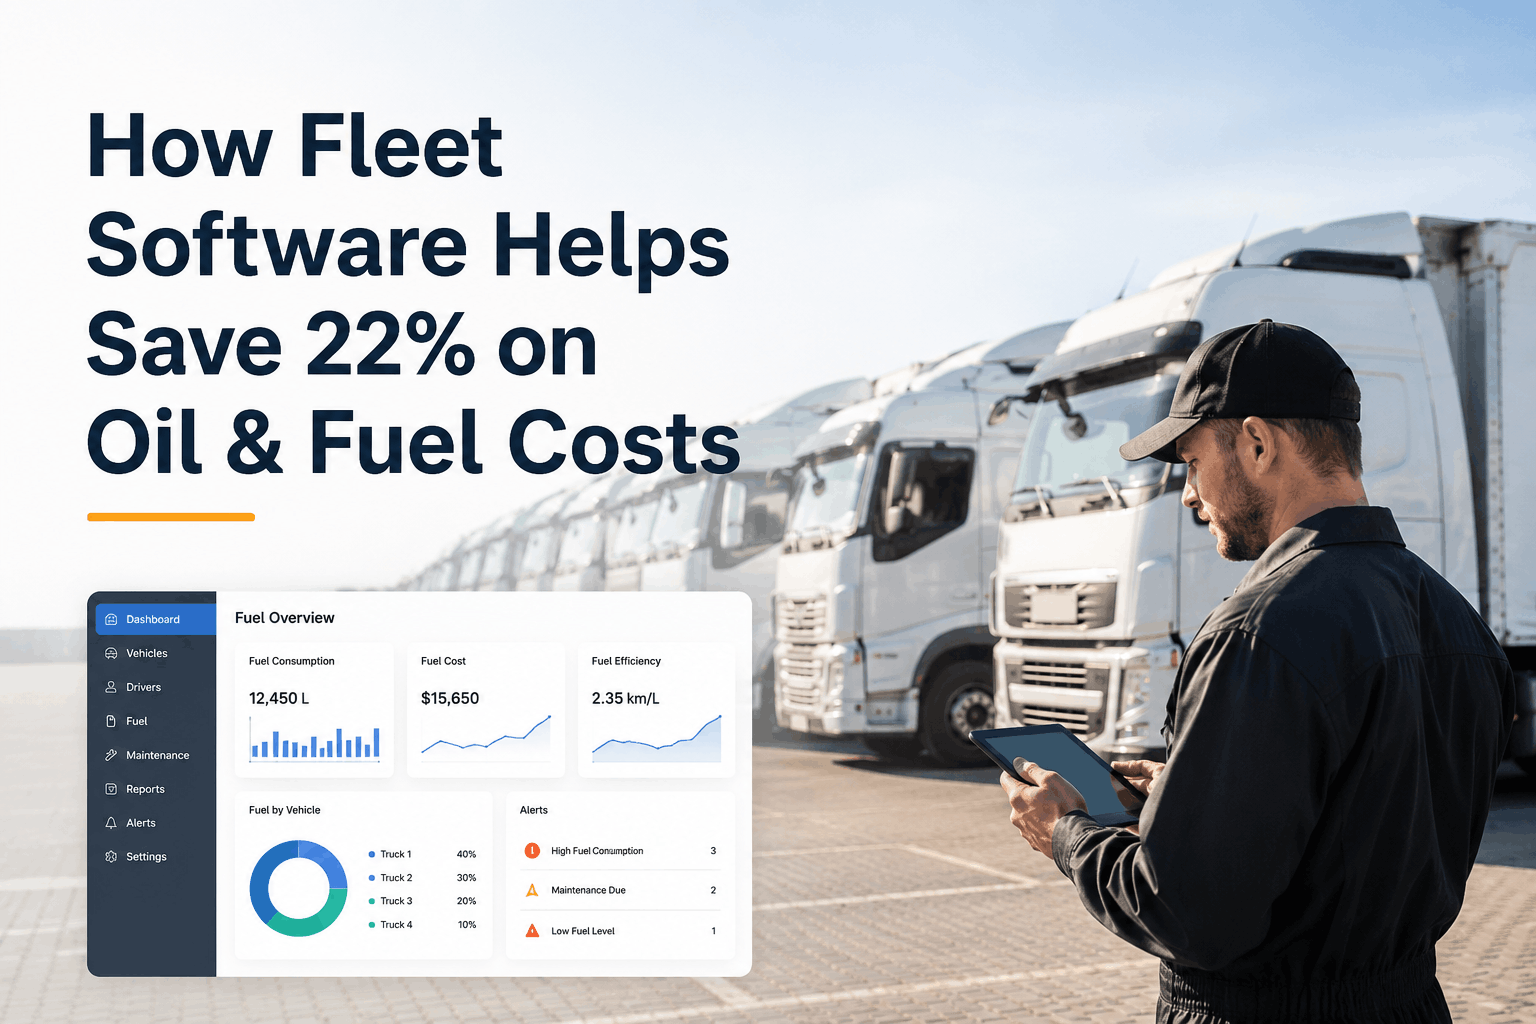
Driver fuel efficiency scorecards take the widest, most expensive uncontrolled variable in your fleet — how each driver treats the pedal, the brake, and the idle switch — and turn it into a weekly ranking the whole fleet can see. On identical trucks, identical routes, identical loads, a top-quartile driver runs 20% to 30% better MPG than a bottom-quartile one. That's the same $85,000 tractor consuming $8,000 to $12,000 more diesel a year in the wrong hands, and until scorecards exist, you can't tell the two apart on the fuel invoice. This page walks the five metrics that make up a scorecard, how the letter grade is actually calculated, the weekly coaching loop that turns data into 8% to 15% fleet-wide MPG lift inside 90 days, and the dollar impact by fleet size. Book a demo after you see the leaderboard.
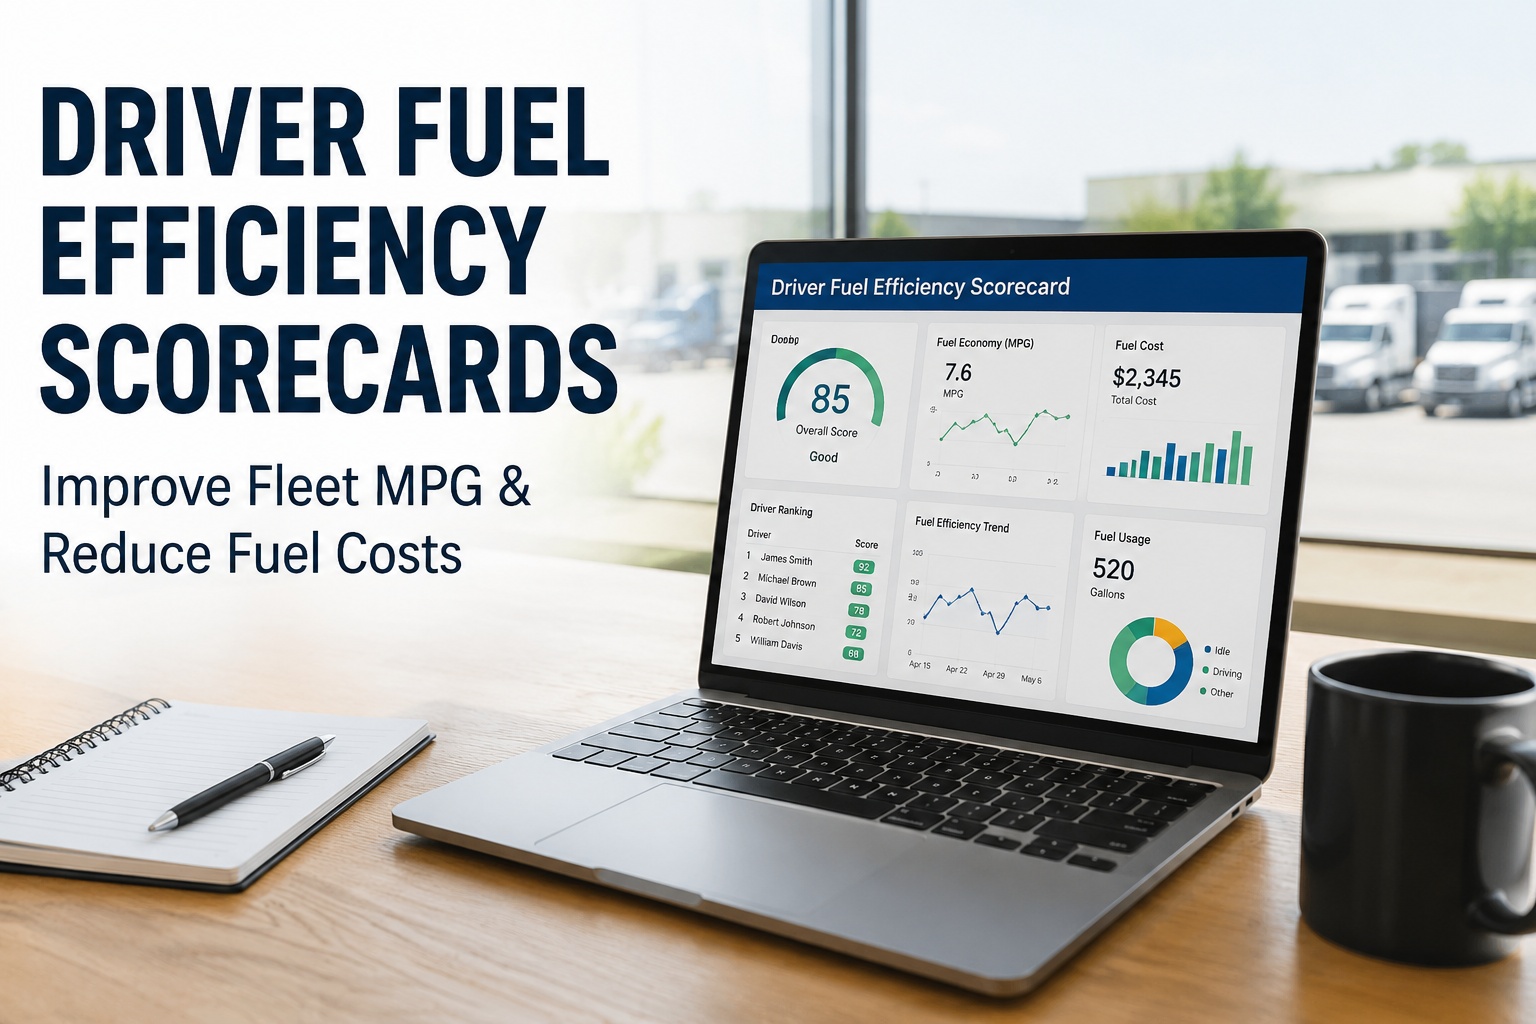
Every driver ranked. Every week. This is a scorecard.
What a live driver fuel efficiency scorecard actually looks like — and why it's the highest-ROI fuel-savings tool most fleets don't have yet.
That 2.2 MPG gap between Jose and Kevin is not a truck problem. It's not a route problem. It's a behavior problem, and it's invisible until a scorecard shows it. Below is what a fuel efficiency scorecard actually measures, how the grade is calculated, and the 90-day lift a coaching program built on it typically delivers.
What actually goes into a driver fuel efficiency scorecard
Every credible scorecard weighs the same five behaviors, though the exact weights shift by duty cycle. The stack below is what most modern telematics-based programs use for long-haul and regional fleets — five behaviors, adding to 100% of the composite score.
MPG vs route benchmark
The outcome the other four predict. Actual MPG for the trip vs the route-adjusted expected MPG. Highest weight because it's the number that pays the bill.
Idle time percentage
Idle hours as a share of engine-on hours. A stationary truck at 0.8 gph burns $3+/hr with zero productive output. Single largest controllable fuel waste on almost every fleet.
Over-speed time
Minutes driven above a set threshold, typically 65 mph for Class 8. Aerodynamic drag compounds fuel burn 1% to 2% per mph over the sweet spot.
Hard acceleration events
Sudden throttle inputs above a G-force threshold. Fuel dumps — injecting unburned fuel without matching engine efficiency. Counted per 100 miles driven.
Harsh braking events
Every hard brake means energy paid for but not used. Also a leading indicator of following distance and anticipation, which correlate with the other four.
Some fleets add cornering severity and coasting/anticipation scores, and off-road heavy-equipment operators swap MPG for fuel-per-productive-hour. But the five above are the non-negotiable core — the behaviors that account for roughly 80% of driver-controllable fuel-economy variance. Book a demo to see the five metrics tracked live per driver
How the scorecard grade gets calculated
Each of the five metrics produces a sub-score from 0 to 100, weighted by the percentages above, then rolled up into a composite score and mapped to a letter grade. The band structure below is where most well-run programs settle after their first quarter of tuning — and the dollar-per-truck-per-year deltas are why fleet CFOs sign the check.
The full spread from A to D on the same truck is roughly $11,000 a year in fuel — not counting the maintenance tail, insurance premium impact, and DPF regeneration costs that harsh driving compounds. On a 50-truck fleet where the D drivers cluster at the bottom, the recoverable spend from grade migration alone typically lands in the $150,000 to $250,000 range annually. Start free and see grade-by-driver breakdowns on day one
The weekly scorecard coaching loop
Scorecards don't move MPG. Scorecards plus a coaching loop move MPG. Below is the five-step weekly cadence that separates programs that lift 10%+ from programs that produce a nice-looking dashboard and no change in the fuel bill.
Capture
Telematics streams speed, RPM, brake events, throttle position, idle time. Fuel card syncs gallons and locations. All automatic, no driver logging.
Score
Weighted algorithm produces a composite 0–100 score plus letter grade per driver, normalized to route difficulty and duty cycle.
Rank
Weekly leaderboard published to the whole team. Drivers see their own trend and where they sit against peers. Transparency is the mechanism.
Coach
Bottom 20% get a 15-minute 1:1 focused on one specific behavior. Not punitive, not lengthy. One metric at a time. Positive framing.
Improve
Next week's number moves. Improvement compounds. Bottom-quartile drivers typically close 50% of their gap to fleet average inside 6 weeks.
The most common failure mode is running steps 1 through 3 and skipping steps 4 and 5. A dashboard nobody coaches from is a dashboard nobody looks at after week 3. The coaching cadence is where the fuel savings actually live. Book a demo to see the coaching workflow in production
The 90-day MPG lift a driver scorecard delivers
Below is what typical fleets see in the first 90 days of a scorecard-plus-coaching program. The number that matters isn't the technology — it's the compounding of small, weekly behavior changes across every driver on the roster.
The 8.9% MPG lift on this 50-truck example is $255,000 in annual fuel savings, roughly matching published SmartWay program benchmarks for well-run coaching programs. On a 100-truck fleet with the same duty cycle, the same lift produces $510,000/year. On a 500-truck fleet, $2.5M. Book a demo to model the lift on your own fleet size and baseline MPG . The scorecard's ROI is the leverage: one weekly workflow across every driver, every week, forever — start free and start the 90-day clock this week .
From a fleet operations manager who ran the program
We rolled scorecards out in Q2 not expecting much — I figured the drivers who cared already cared and the ones who didn't wouldn't change. That's not what happened. Our #4 through #8 drivers moved the most. They didn't know they were mid-pack. Once they saw the ranking, they closed the gap with our top guys inside 6 weeks.
Our fleet MPG went from 6.1 to 6.7 by end of Q3 — about $340,000 in fuel on our 78 tractors. What surprised me most: the coaching sessions took less time than I planned. 15 minutes, one metric, once a week. That's it. The scorecard did most of the work by just existing.
Frequently asked questions
What is a driver fuel efficiency scorecard?
A driver fuel efficiency scorecard is a weekly or monthly rating system that assigns each driver a numeric score and letter grade based on how their driving behavior affects fuel consumption. It combines automatic data from telematics — GPS speed, engine load, RPM, brake events, throttle position, idle time — with fuel card and ECM data to measure the four to five behaviors that account for most fuel-economy variance across a fleet. A typical scorecard produces both a composite score from 0 to 100 and a letter grade (A/B/C/D), then ranks every driver against fleet peers and against their own history. The point isn't to punish; it's to make invisible variance visible. Two drivers on identical trucks running identical routes can produce a 20% to 30% MPG gap that never shows up on a fuel invoice — the scorecard is the first document that ties the gap to specific behaviors specific drivers control, and turns it into something a fleet manager can actually coach against.
What metrics should a fuel efficiency scorecard measure?
Every credible scorecard weights five behaviors, though the exact weights vary by duty cycle. Fuel economy vs a route-adjusted benchmark carries the most weight (around 30%) because it's the outcome the other metrics predict. Idle time as a percentage of engine-on hours comes next (around 25%) because it's the single largest controllable fuel waste — a stationary truck at 0.8 gallons per hour burns $3+/hr with zero productive output. Over-speed time (around 20%) covers minutes driven above a set threshold (typically 65 mph for Class 8) where aerodynamic drag compounds fuel burn 1% to 2% per mph over the sweet spot. Hard acceleration events (around 15%) capture fuel dumps — sudden throttle inputs that inject unburned fuel without matching engine efficiency. Harsh braking events (around 10%) close the loop because every hard brake indicates energy paid for but not used. Some fleets add cornering severity and coasting/anticipation scores; off-road operators swap MPG for fuel-per-productive-hour. The five above are the non-negotiable core.
How much MPG improvement can driver scorecards realistically deliver?
Well-designed scorecard programs typically lift fleet-wide MPG by 8% to 15% within 90 to 180 days, with the biggest gains coming from the middle 60% of drivers rather than the very bottom. On a fleet running 6.2 MPG baseline, that's a lift to 6.7 to 7.1 MPG — worth $2,000 to $3,500 per truck per year at current diesel prices, or $200,000+ annually on a 100-truck fleet. Some fleets see larger gains up to 20% when scorecards are paired with driver-visible weekly rankings, targeted one-on-one coaching for the bottom quartile, and non-punitive incentive structures. Gains typically plateau after 6 to 9 months as the fleet approaches its physical MPG ceiling for the equipment and duty cycle, at which point the program shifts from lift to sustain. The lift is durable when the scorecard is a permanent feedback mechanism, not a one-time campaign — the moment weekly ranking stops, the number drifts back toward baseline within a quarter.
How do you roll out scorecards without pushback from senior drivers?
The pushback risk is real and mostly about tone, not the data. Three practices head off most of it. First, make the initial rollout non-punitive — the first 30 days are awareness-only, with drivers seeing their own scores and knowing no discipline attaches. Second, involve senior drivers in defining what "good" looks like — a driver-led metric committee produces better buy-in than a management-imposed grading rubric. Third, structure incentives around positive reinforcement (fuel-bonus payouts, top-performer recognition, quarterly awards) rather than penalties for the bottom quartile. Coaching for low performers should feel like professional development, not correction — 15-minute weekly sessions focused on one behavior at a time. Senior drivers in particular respond well when scorecards validate what they've been doing right for years, since most fleet-wide programs quietly reveal the veteran drivers have been carrying the MPG average all along. Punitive programs generate turnover; recognition programs generate culture change.
Do driver scorecards work across mixed fleet types?
Yes, but the scoring model has to be normalized to duty cycle, or the comparisons are meaningless. A Class 8 long-haul driver and a local pickup-and-delivery driver on identical trucks will produce very different absolute MPG numbers because their duty cycles are different — highway cruise vs stop-and-go. Good scorecards benchmark drivers against route-adjusted expectations rather than raw MPG, so a delivery driver hitting their route-adjusted target scores as well as a highway driver hitting theirs. The same normalization handles mixed vehicle classes (medium-duty vs heavy-duty), regional differences (mountain grades vs flat interstate), and load variation. Off-road heavy equipment operators use a modified scorecard that trades MPG for fuel-per-productive-hour and adds machine-specific behaviors (bucket load control, RPM management, cycle time efficiency). Any fleet with 20 or more vehicles benefits from a scorecard program — the scoring model just has to fit the duty cycle. Trying to compare a dump truck driver to a linehaul driver on raw MPG produces the wrong ranking and the wrong coaching conversations.
Turn driver variance into 8–15% fleet MPG lift inside 90 days
HVI captures the five scorecard metrics automatically, produces a weekly composite score and letter grade for every driver, publishes a leaderboard the whole team can see, and surfaces the specific behaviors coaching should address first. The 90-day clock starts the day you turn it on — and the first month's savings typically covers the program cost for the year.
No credit card · No hardware install · Scorecards live on day one