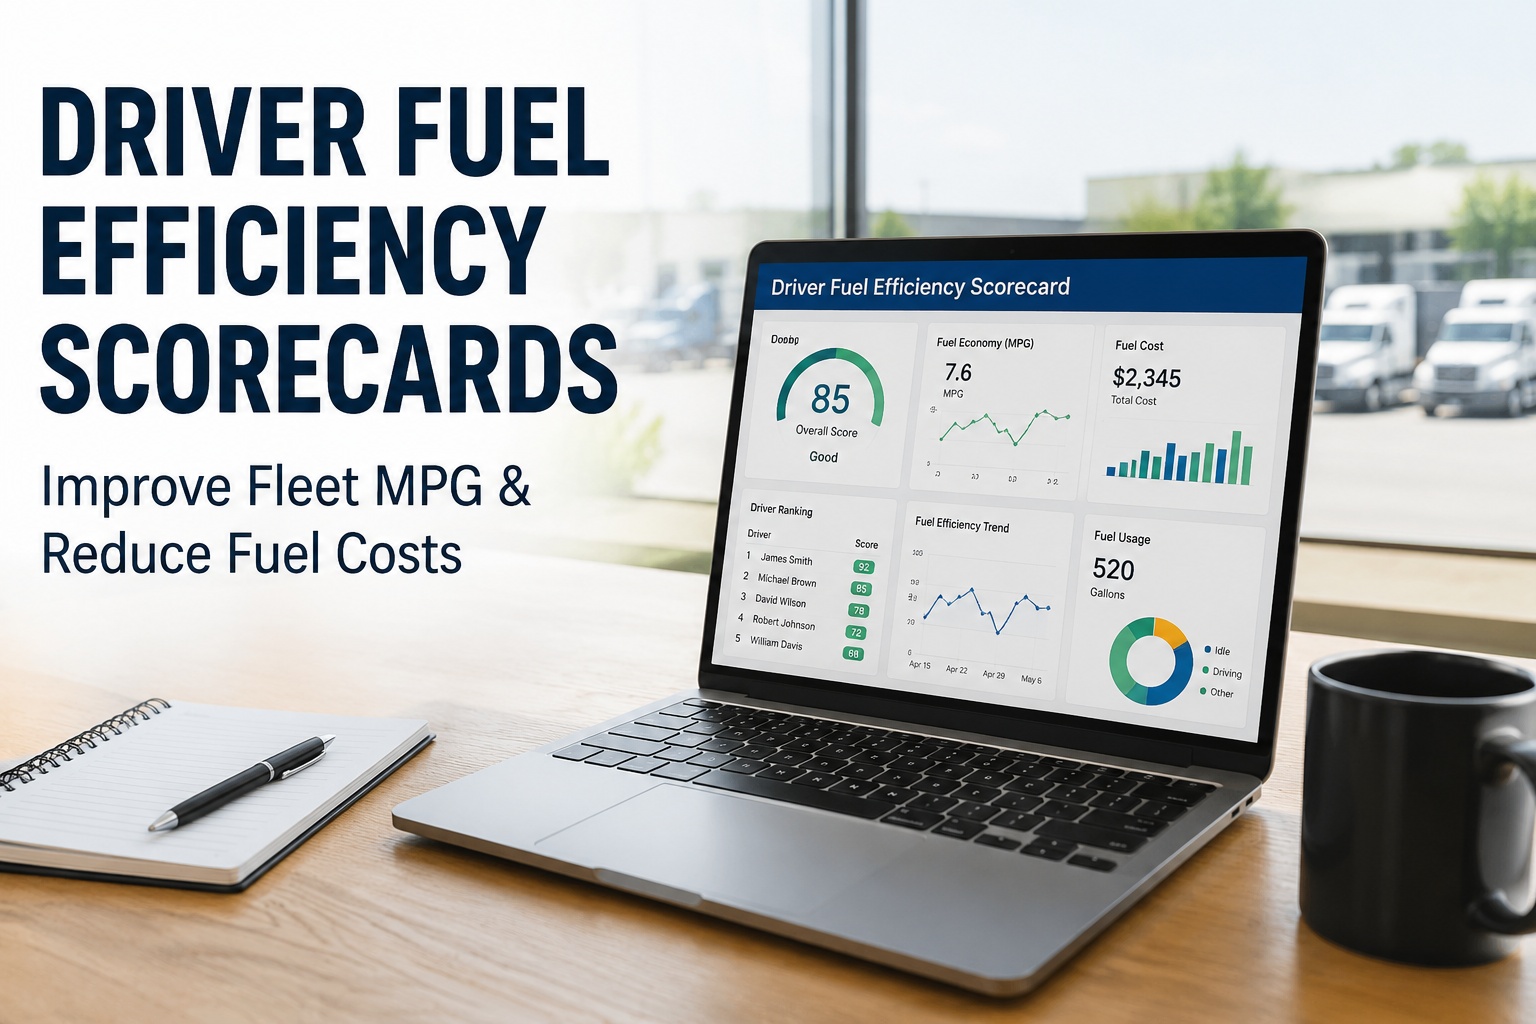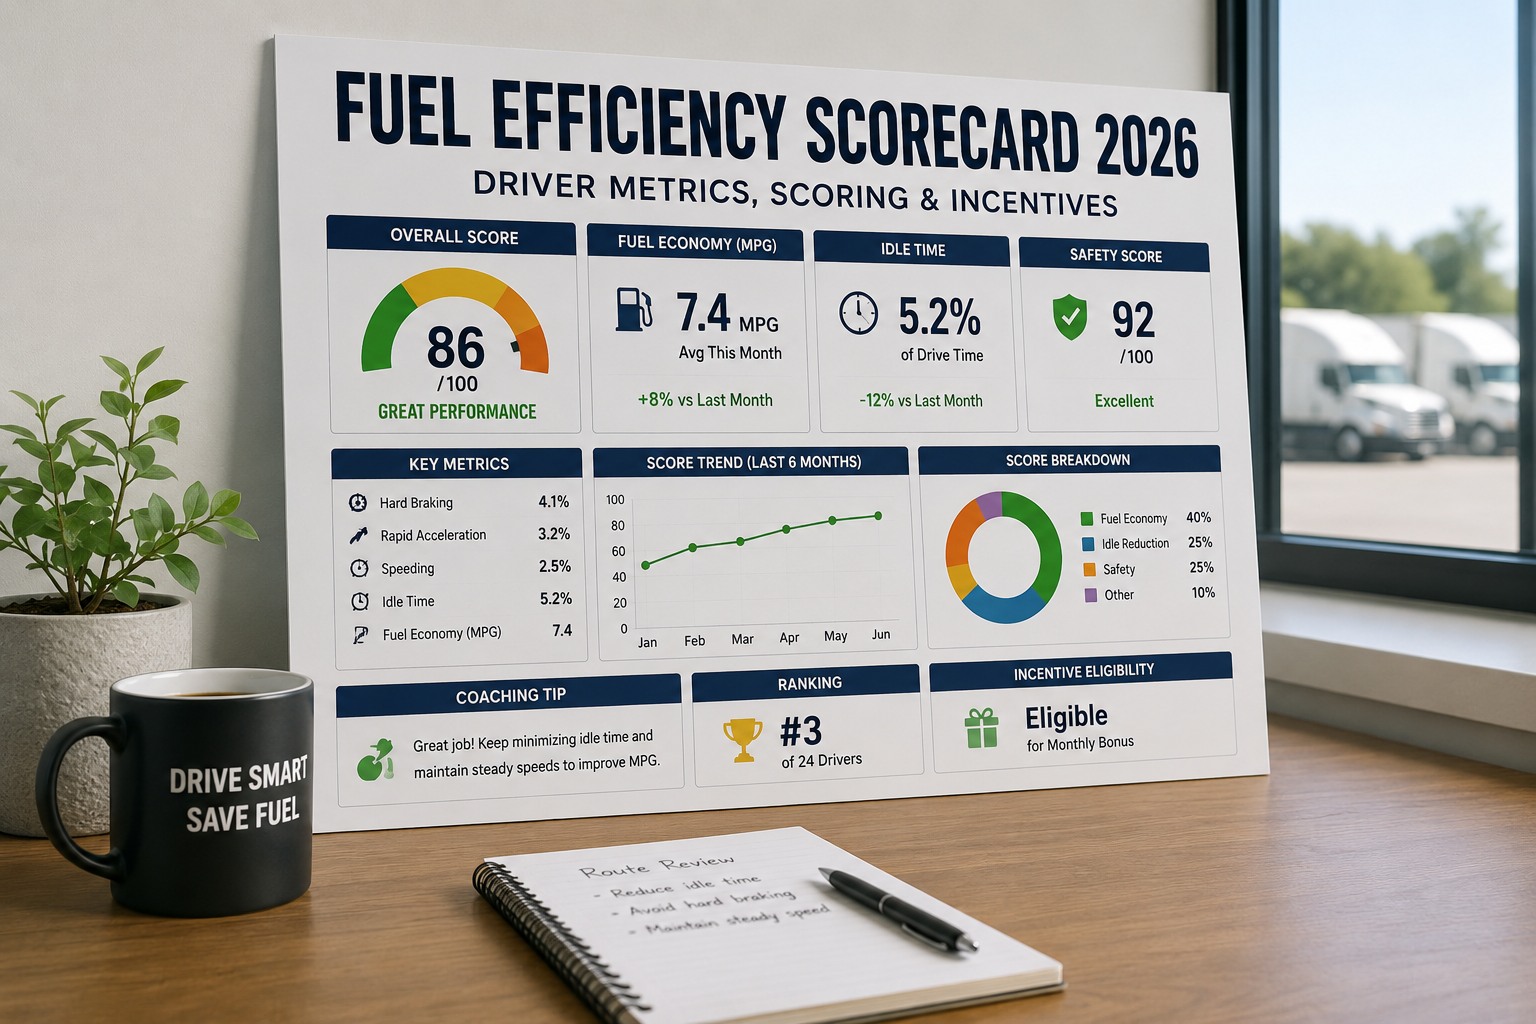
A fuel efficiency scorecard that ranks drivers on raw MPG penalizes the driver stuck on hilly urban routes and rewards the driver assigned smooth interstate lanes — without either changing their behavior. That single design flaw is why most first-attempt scorecard programs get abandoned within a year. A working fuel efficiency scorecard has four things: route-normalized peer benchmarking, weighted metrics that reflect actual priorities, coaching cadence tied to threshold triggers and incentives that reward improvement rather than baseline advantage. This playbook walks the design decisions. Book a demo
Four metric groups. Weighted by fleet priority. Normalized by route.
A scorecard that produces behavior change is engineered around what management prioritizes — not what telematics happens to report.
Fuel makes up roughly 24% of trucking fleet operational costs, second only to labor. Every percentage point of fuel efficiency improvement compounds across every truck, every mile, every day. A working driver scorecard is one of the most cost-effective ways to move that number — and one of the most reliable ways to inadvertently damage safety culture, driver retention, and dispatcher fairness if designed badly. The playbook below covers the decisions that separate the two outcomes.
The weighting model — why 40/25/20/15 and how to adjust it
The choice of what to weight and by how much is the most consequential decision in scorecard design. Weight the wrong thing and drivers optimize for the wrong outcome. Weight safety too low relative to fuel and the scorecard incentivizes rolling stops. Weight fuel too high relative to safety and hazmat becomes a compliance risk. The industry-common 40/25/20/15 starting point balances these tensions for a general-purpose fleet.
Balanced starting point
Best for mixed operations, moderate risk profile, general trucking. Safety leads but fuel is a real business driver.
Hazmat / passenger / heavy urban
Best for hazmat, passenger transport, high-consequence operations. Safety dominates; fuel is secondary.
Long-haul / refrigerated / high-mileage
Best for long-haul, reefer, high-mileage operations. Fuel is the dominant OpEx line; idle compounds it.
Two rules govern all three scenarios. First: safety weight never drops below 30% unless the fleet has actively decided it's willing to accept the risk shift. Second: weights must be published to drivers, not kept internal. A scorecard drivers don't understand the math on is a scorecard they don't trust. Drivers who see the weights and the trade-offs they represent become active participants in the fuel program instead of subjects of it. Book a demo to see configurable weighting per fleet segment in HVI
Route normalization — the "different routes" problem
The most common scorecard design flaw: comparing drivers on raw metrics across different routes. The driver assigned mountain interstate hauls will never match the flat-plains driver's MPG. The urban delivery driver will never match the highway driver's idle time. Raw ranking penalizes challenging assignments and rewards easy ones — without either driver changing their behavior.
Problem
Fix
Peer normalization requires categorizing routes and drivers into comparable groups: highway long-haul, mixed regional, urban delivery, off-highway, hazmat lanes. Within each group, drivers get ranked against similar operating conditions. The peer group has to have enough drivers in it (5+ minimum) for the comparison to be statistically meaningful. Fleets that skip this step and jump straight to raw rankings almost universally see program abandonment within 6-12 months as driver trust erodes. Book a demo to see peer-normalized scorecards configured per route category
Threshold system — green, yellow, red with actual meanings
Color coding on driver scorecards is nearly universal at this point — green/yellow/red is the standard. What distinguishes a working color system from a decorative one is that each color triggers a specific action, not just a visual signal. Below is a threshold model that ties color to consequence.
Exceeding target
Meeting target
Below target
The 2-week / 4-week / 6-week progression on red isn't punitive by design — it's structured to give drivers real opportunity to correct before consequences escalate. Fleets that jump from "red score" to "written warning" in the same week create adversarial scorecards. Fleets that let drivers sit in red for months without intervention create meaningless scorecards. The tiered cadence is what turns a color-coded dashboard into a functional performance-management tool.
Coaching cadence — matching frequency to performance tier
The frequency of scorecard review has to match performance tier, or the coaching workload becomes unmanageable and low-performers don't get enough intervention. A model that works across fleet sizes:
Frequent, targeted intervention
Bottom 15-20% of scorecard population reviewed weekly. One-on-one coaching sessions with supervisor. Specific events pulled from telematics for discussion — not general criticism. Written improvement plan if 4 weeks of consistent below-target.
Regular check-in cadence
Middle 60-70% of scorecard population reviewed monthly. Trend discussion (improving vs. slipping). Recognition of specific improvements. Career-development conversation opportunity. Voluntary coaching offered but not mandated.
Recognition and retention
Top 15-20% of scorecard population reviewed quarterly. Recognition-focused rather than coaching-focused. Peer-trainer or mentor opportunity offered. Bonus or route-assignment reward discussion. Career-path conversation.
Two rules for coaching sessions across all tiers. First: use specific telematics events, not general criticism. "Your harsh-braking events in the last 30 days — here are three specific ones with location and time" is coaching. "You need to drive better" is not. Second: coaching is separate from disciplinary action. Mixing them in one conversation destroys the coaching function. A supervisor who coaches on Monday and issues discipline on Tuesday for the same behavior creates a driver who stops engaging with either conversation. Start free and get coaching workflows built into driver scorecards
Incentive design — what works, what backfires
Financial incentives tied to fuel efficiency scorecards can produce measurable behavior change — or produce serious unintended consequences depending on design. Below is a framework based on documented industry programs (Mesilla Valley Transportation's driver fuel conservation incentive program is one commonly-cited example) and common failure modes to avoid.
Reward sustained improvement, not baseline
Single-metric bonuses distort behavior
The single most common failure pattern: a fleet designs a pure MPG bonus, drivers realize the fastest path to bonus is coasting through stop signs and running downhill at excessive speed, safety events spike, and the fleet ends up with worse safety outcomes and a legal-liability problem while thinking they succeeded on fuel. Multi-metric composites with safety weight ≥30% prevent this outcome by design. The scorecard has to reward the composite, not any single line item. Book a demo to see incentive-eligible composite scores built into driver dashboards
From a Safety Manager who rebuilt her fleet's fuel scorecard program
Our first scorecard program in 2023 was a disaster. Pure MPG ranking, single bonus for top three drivers, calculated fleet-wide with no route adjustment. Within four months our two best drivers on mountain routes were furious, our two "top performers" on flat interstate had 3x the harsh-braking events of the fleet average, and our driver forum had turned into a scorecard-hate thread. We shut it down.
The rebuild took us six months. Peer groups by route category. Weighted composite — we run 40% safety, 25% fuel, 20% idle, 15% ops. Threshold-triggered coaching cadence with the 2/4/6 week structure. Improvement bonuses instead of baseline bonuses. Two years in, our fleet MPG is up 8% and our safety events per million miles is down 22%. What changed wasn't the metrics or the technology. It was designing the program so drivers experience it as fair. Fair means they trust it. Trust means they engage with it. Engagement is where the actual behavior change happens.
Frequently asked questions
What metrics should a fuel efficiency scorecard include?
An effective fuel efficiency scorecard combines four metric groups rather than tracking fuel efficiency in isolation. Fuel efficiency metrics: MPG (route-normalized, not raw), fuel cost per mile, coasting and cruise control usage, optimal shift point discipline. Idle discipline metrics: idle time as percentage of engine-on time, excessive idle events (idle sessions over defined threshold), idle by location type (yard vs. delivery vs. highway rest), legitimate PTO exclusions properly categorized. Safety behavior metrics: harsh braking events per mile, rapid acceleration events per mile, harsh cornering events per mile, speeding events above posted plus threshold. Operational discipline metrics: on-time performance, route adherence, DVIR completion currency, trip data completeness for accurate reporting. The reason for the four-group structure is that fuel efficiency in isolation creates perverse incentives. A driver optimizing only for MPG can achieve high scores by coasting through stops, running downhill at excessive speed, or skipping legitimate PM stops — all of which produce worse total-cost-of-operation outcomes even when the fuel line looks better. The four-group composite with safety weighted at 30%+ prevents this failure mode by design. Weights on the four groups should reflect fleet priorities: a common starting point is 40% safety / 25% fuel / 20% idle / 15% ops for general fleets, adjusted higher on safety for hazmat or passenger operations and higher on fuel for long-haul or refrigerated operations. Weights should always be published to drivers so they understand what the scorecard rewards.
How should fuel efficiency scorecards be weighted?
Scorecard weighting is the most consequential decision in program design because weights signal what management actually prioritizes. Three common weighting profiles cover most fleet scenarios. General fleet balanced starting point: safety 40%, fuel efficiency 25%, idle discipline 20%, operational discipline 15%. This works for mixed operations with moderate risk profile and general trucking. Safety leads but fuel is a real business driver. Safety-critical profile: safety 60%, fuel 15%, idle 15%, ops 10%. Appropriate for hazmat, passenger transport, high-consequence operations where safety dominates and fuel is secondary. High-fuel-cost profile: safety 30%, fuel 35%, idle 25%, ops 10%. Appropriate for long-haul, refrigerated, high-mileage operations where fuel is the dominant OpEx line item and idle compounds the fuel exposure. Two rules govern all three scenarios and any adjustments to them. First: safety weight should never drop below 30% unless the fleet has actively decided it's willing to accept the risk shift. Weighting safety below 30% in a scorecard tied to bonuses effectively tells drivers that safety events cost less than fuel inefficiency, which produces measurable safety event increases over time. Second: weights must be published to drivers, not kept internal. Drivers who see the weights understand the trade-offs and become active participants in the program. Drivers who don't understand the math treat the scorecard as arbitrary and stop engaging with it. Configurable weighting per fleet segment matters when a single organization runs multiple operational profiles — hazmat lanes may need different weights than dry-van general freight even within the same company.
Why do fuel efficiency driver scorecard programs fail?
Six failure patterns account for most abandoned scorecard programs. Raw ranking across different routes: comparing MPG for a driver on mountain interstates to a driver on flat plains penalizes challenging assignments and rewards easy ones. Drivers lose regardless of behavior, credibility collapses, program gets abandoned in 6-12 months. Fix: peer-normalized ranking within route category. Single-metric bonuses: pure MPG bonus incentivizes coasting through stops and dangerous downhill speeds. Idle-only bonus incentivizes running the truck with the driver outside. Fix: multi-metric composite with safety weight at least 30%. Opaque calculation: drivers who don't understand how the score is computed don't trust it and don't act on it. Fix: publish the weights, publish the peer groups, publish the threshold triggers. Punitive-only structure: no recognition path for top performers, no improvement path for bottom performers, just consequences. Drives under-reporting and mistrust. Fix: recognition tier with incentives, improvement bonuses, threshold-triggered coaching that gives drivers a path forward. Inconsistent enforcement across depots: one depot follows up on speeding alerts, another ignores them. Program credibility evaporates as drivers compare notes. Fix: standardized workflow with same thresholds and same coaching cadence across locations. Dashboard fatigue: 40 KPIs presented with equal visual weight forces managers to do the cognitive prioritization work themselves. Result: dashboards get ignored. Fix: 3-4 "north star" metrics for daily visibility, remaining KPIs as drill-down. Every one of these failure patterns is a design problem, not a technology problem, and each has a specific design solution. The technology enables the program; the design decides whether it works.
How much can a good fuel efficiency scorecard save?
Documented industry data supports meaningful savings from well-designed driver scorecard programs, though specific results vary by fleet size, operating profile, and program maturity. Baseline context: fuel represents approximately 24% of trucking fleet operational costs, second only to labor. MIT-published data (referenced by the U.S. Department of Energy Alternative Fuels Data Center) shows aggressive driving behavior lowers fuel economy by 15-30% at highway speeds and 10-40% in stop-and-go traffic. This is the recoverable range that scorecard programs address. Real-world program outcomes in the range of 5-10% fleet MPG improvement over 12-24 months are common for fleets implementing well-designed scorecard programs with route-normalized peer benchmarking, weighted composite scoring, threshold-triggered coaching, and improvement-focused incentives. Fleets running less mature programs (raw ranking, single-metric bonuses, no coaching) frequently see initial improvement followed by regression as driver trust erodes. Beyond the direct fuel savings, well-designed programs typically produce measurable safety improvements. Rachel H.'s regional carrier saw 8% fleet MPG improvement combined with 22% reduction in safety events per million miles over two years post-rebuild — the safety improvement isn't incidental, it's driven by the same composite scoring that treats safety events as scorecard-critical. Insurance underwriters increasingly ask about scorecard program specifics during renewal, and demonstrable safety behavior data can influence premium negotiations. The compounding value of a scorecard program comes from fuel savings, safety improvement, insurance impact, and driver retention improvement combined — not from fuel savings alone. Fleets that build the program right typically see payback within one to two quarters even accounting for platform cost and coaching time investment.
How does HVI support fuel efficiency scorecard programs?
HVI runs driver scorecard programs on the design principles this playbook describes, because scorecards designed wrong cost more than they save. Configurable weighting per fleet segment: a single organization running hazmat lanes and dry van general freight can configure different weight profiles for each rather than forcing a one-size fits all model. Route-normalized peer benchmarking: drivers grouped by comparable operating conditions (highway long-haul, mixed regional, urban delivery, off-highway, hazmat lanes) with statistically meaningful peer groups (5+ drivers minimum) so rankings reflect behavior, not assignment. Threshold-triggered coaching workflow: composite score below defined threshold triggers verbal coaching at 2 weeks consecutive below-target, written improvement plan at 4 weeks, progressive discipline at 6 weeks. Managers see coaching-due queues rather than having to monitor scorecards manually. Driver-app visibility: drivers see their own scorecards in the mobile app, understand the weights, understand the peer group, understand what earns bonuses. Transparency is what turns scorecards from adversarial into collaborative. Joined data model: fuel efficiency data joins to inspection completion, PM currency, safety events, and DVIR history for holistic driver performance rather than fuel in isolation. Coaching conversations reference specific inspection or telematics events rather than general criticism. Incentive-eligible composite: bonuses tied to the composite score with configurable improvement-focused eligibility (most-improved driver, sustained-green performance, peer-group top quartile) rather than single-metric ranking that distorts behavior. Published customer data shows fleets on HVI report approximately 25% lower annual maintenance cost with typical payback around 3 months; when combined with a well-designed driver scorecard program, fuel savings alone typically justify the software within the first quarter and safety improvements compound the value over subsequent quarters.
The scorecard is the easy part. Designing it so drivers experience it as fair is what makes it work.
HVI runs driver scorecards on the design principles this playbook describes: peer-normalized, configurable weights, threshold-triggered coaching, driver-visible dashboards. Live in under two weeks; fuel MPG improvement typically visible within one quarter.
No credit card · Scorecard templates configurable per fleet segment