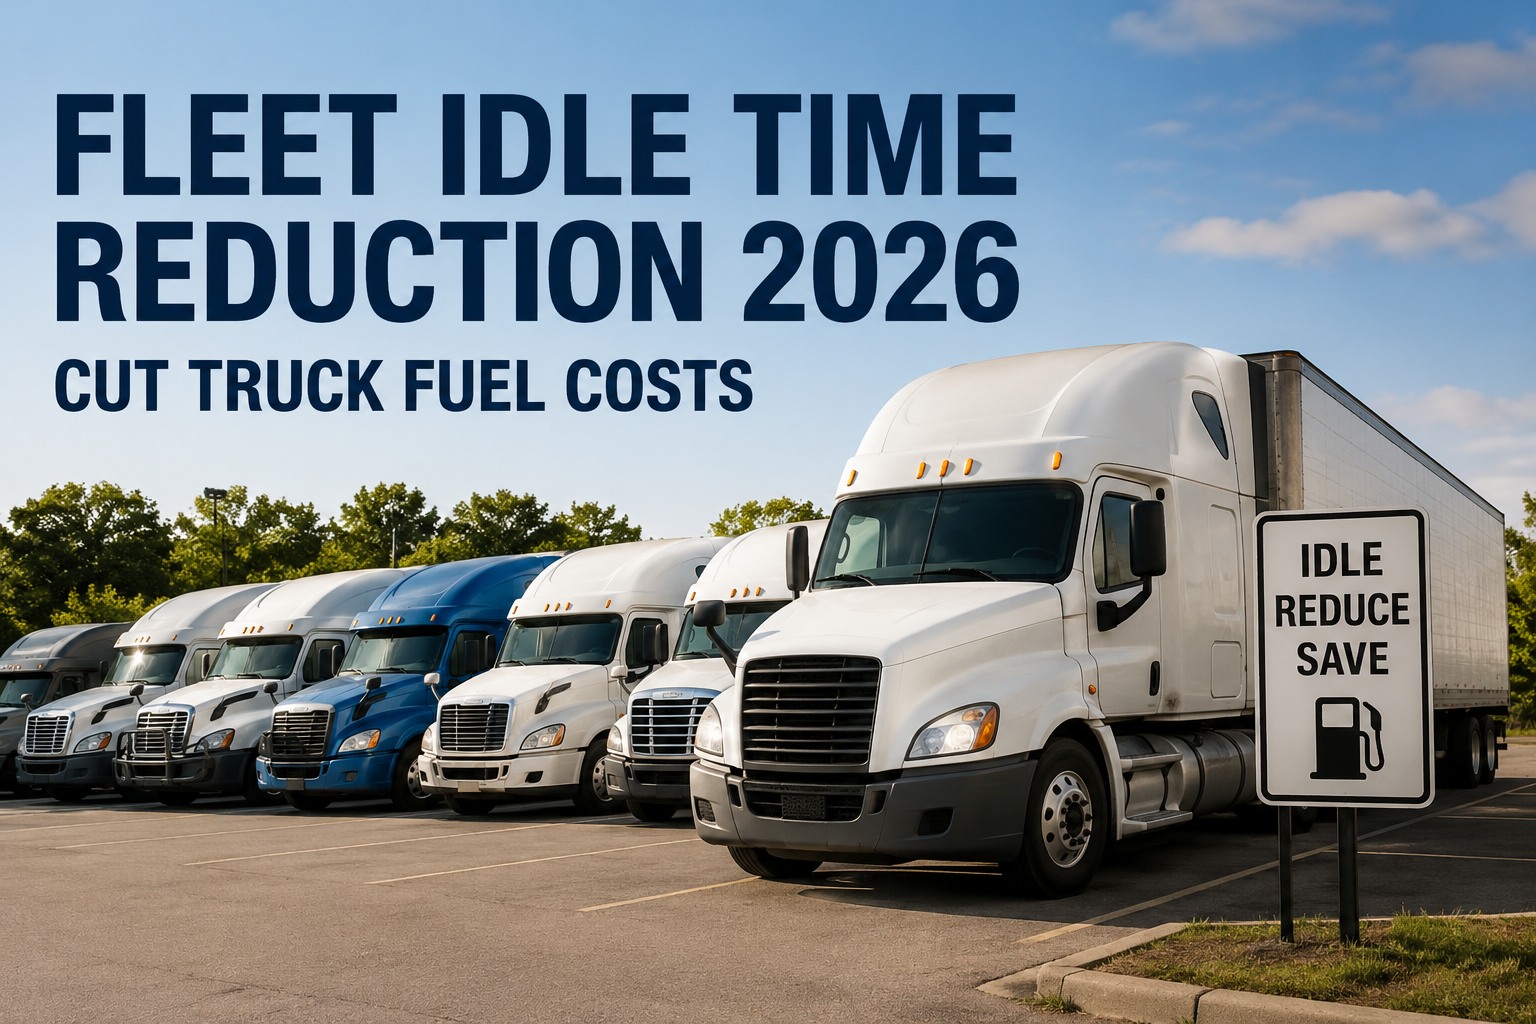
Idle time reduction is the fleet cost lever every operations director already knows about. The tractor at 0.8 gph, the drive-thru wait, the sleeper HVAC session — fuel drains silently and shows up as "diesel." What separates fleets at 8% idle from fleets at 28% isn't a policy document. It's the daily operational rhythm that turns telematics data into an alert on Tuesday, a coaching conversation on Wednesday, and a scorecard change by end of month. This idle time reduction fleet playbook walks through that rhythm. Book a demo
You already know idle costs money. The question is whether anyone catches it before the fuel is gone.
The gap between best-in-class and average fleet idle rates isn't equipment or policy — it's the operational rhythm. Real-time alerts. Daily driver scorecards. Weekly coaching. Monthly KPI reviews. When that rhythm runs, 28% idle becomes 8% inside two quarters.
The ops rhythm — from telematics event to fleet KPI change
Reducing fleet idle isn't a single intervention. It's a four-cadence loop that runs every day of the year. Skip any cadence and the number drifts back up within a quarter. Run all four and the number stays down permanently.
Threshold alert fires
Unit exceeds 5-minute stationary idle threshold. Alert routes to driver's phone / in-cab display, dispatcher's dashboard, and (if configured) supervisor's exception queue.
Scorecard published
Overnight batch process rolls yesterday's telematics data into per-driver idle percentage. Scorecard emails / dashboard tiles refresh at 6am. Drivers see their own number vs fleet average.
Coaching conversation
Supervisor pulls the flagged-driver list, has a specific conversation citing the exact events (timestamps, locations, duration). Positive reinforcement for top performers. Documented in the driver file.
KPI review & ROI
Fleet-wide idle % trended against last month, last quarter, YoY. Fuel dollars saved calculated. Coaching effectiveness measured per supervisor. Program adjustments made.
The four cadences work as one system. Real-time alerts without daily scorecards produce alert fatigue. Daily scorecards without weekly coaching produce data nobody acts on. Weekly coaching without monthly KPI review has no way to prove it worked. The rhythm is the program. Book a demo to see the full four-cadence idle-reduction workflow running live
Alert design — the thresholds that catch idle without crying wolf
Every fleet manager who has ever set up idle alerts has run into the same failure mode: too many alerts, drivers tune them out, dispatchers stop reading them, and within two weeks the whole system is white noise. Good alert design separates the necessary from the avoidable so the alerts only fire when action is possible.
| Trigger | Threshold | Exception | Notify | Priority |
|---|---|---|---|---|
| Stationary idleEngine on, PTO off, 0 mph | 5 min | Ambient < 20°F or > 95°F | Driver + dispatch | Standard |
| Extended idleContinuous idle over 30 min | 30 min | PTO active, DPF regen | Driver + supervisor | Elevated |
| Overnight idleIdle between 10pm - 5am | 60 min | Sleeper berth exemption, APU flag | Supervisor + fleet mgr | Elevated |
| Idle location clusterSame coordinates, repeat idle | 3 events / week | Known truck stop, terminal, DC | Fleet manager | Analysis |
| Idle % driftDriver 7-day rolling avg | > 20% or +5pt vs prior week | New route, first 2 weeks | Supervisor | Coaching |
The right alerts are silent 90% of the time. When one fires, it means something. Fleets that get this right typically see 30-40% of their idle problem self-correct within 60 days just from real-time driver self-awareness — no coaching conversations needed. Start free and get idle alerts with weather-aware exception logic built in
Driver coaching — the conversation that actually changes the number
Alerts and scorecards produce data. Coaching produces behavior change. The two are not interchangeable. Fleets that stop at "we set up the dashboard" get a temporary bump in idle discipline that fades within 90 days. Fleets that build the coaching conversation into weekly supervisor rhythm sustain the improvement permanently. Here's what works.
"Your idle % was 24% last week" produces nothing. "You idled 47 minutes at the Love's on I-40 Thursday at 2pm during a 90°F afternoon — that was $3 in fuel, and shore power was available" produces behavior change. Cite the specific events, not the aggregate number.
Recognizing the drivers running under 8% idle is more effective than punishing the ones running over 30%. Positive reinforcement drives peer pressure. A monthly "top 5 idle discipline" callout in the driver room or Slack channel changes behavior faster than any threat.
Coaching sessions logged in the driver file (date, events cited, driver response, follow-up commitments) create the paper trail that (a) protects the fleet in disputes and (b) surfaces patterns across drivers or routes. Verbal-only coaching disappears.
Track per-supervisor coaching effectiveness. If Supervisor A's coached drivers drop 8 points in 60 days and Supervisor B's coached drivers drop 2 points, the intervention needs to move to Supervisor A's approach. The people doing the coaching need feedback loops too.
The monthly KPI dashboard — proving the program to the CFO
Everything runs into the monthly review. This is where the idle program either defends its own budget or gets defunded when the CFO looks for savings. The dashboard needs to answer four questions cleanly.
The four KPIs answer four different questions: how are we doing overall (01), what's the dollar impact (02), is coaching working (03), and what are the systemic fixes (04). A dashboard that shows all four turns idle reduction from a driver-discipline problem into a data-driven program that survives budget season year after year. Book a demo to see the full 4-KPI idle dashboard configured for your fleet
From an operations director who moved a 180-truck fleet from 26% to 9%
We'd tried the idle policy approach twice before I got there — both times it worked for about a quarter and then drifted back. The problem wasn't the policy. The problem was we were reading last month's report in a meeting three weeks after the events happened. By then the drivers who idled 40 minutes at the drive-thru couldn't remember it and neither could their supervisor.
What worked: we built the four cadences. Real-time in-cab alerts (with weather exceptions, that mattered a lot for driver trust). Overnight driver scorecards emailed every morning at 6am. Weekly supervisor coaching using specific timestamped events, not aggregates. Monthly review with dollar-value savings. Twelve months in, fleet idle went from 26% to 9%. That's $189K in fuel savings for the year on 180 trucks — and the DPF regen issues that had been costing us on the maintenance side dropped roughly 40% too, which we hadn't expected. The idle number was actually two numbers.
Frequently asked questions
How do you calculate the fuel cost of fleet idle time?
The calculation is straightforward: idle hours per truck per day × idle burn rate in gallons per hour × diesel price per gallon × number of trucks × operating days per year. A Class 8 tractor at idle burns 0.8 to 1.5 gallons per hour depending on engine size and accessory load; use 0.8 GPH as a conservative fleet-wide average unless engine data shows otherwise. At diesel around $3.85 per gallon, that's approximately $3.08 in fuel per idle hour. A 100-truck fleet averaging 2 hours of idle per truck per day over 250 operating days per year produces 50,000 idle hours annually — roughly $154,000 in fuel cost. A 100-truck fleet at 4 hours per truck per day doubles to $308,000. Add the maintenance tail (the ATA estimates every idle hour equals roughly 25 miles of engine wear, plus DPF regen and DEF consumption impacts) and total system cost per idle hour lands closer to $6. The calculation should be re-run monthly against actual telematics data rather than estimates — most fleets that estimate come in 30-50% low compared to what the ECM data actually shows.
What's a "good" idle time percentage for a commercial fleet?
Best-in-class fleets consistently run under 10% idle time, calculated as idle hours divided by engine-on hours. Industry average for well-managed fleets sits at 10-15%. Above 20% indicates undermanaged idle policy or missing telematics visibility. Above 30% is common on fleets that have never systematically tracked idle — and represents the largest short-term cost-recovery opportunity available. Some legitimate exceptions push the number higher: reefer operations that keep the tractor engine running for HVAC while the reefer runs from its own tank, PTO-intensive work (concrete pumps, hydraulic operations, aerial equipment), extreme-weather cabin comfort in regions where sleeper berth temperature control is a real safety concern, and emergency response operations. Those exceptions should be defined explicitly in the fleet's idle policy, tracked separately in the exception queue, and never used as a blanket excuse for undisciplined idle across the general fleet. The target for a mixed commercial fleet: general operations under 10%, with clearly documented and quantified exception categories for the specific duty cycles that require higher idle.
How often should idle time be reviewed with drivers?
The most effective cadence is a four-tier rhythm: real-time, daily, weekly, monthly. Real-time alerts fire the moment a truck exceeds the fleet-defined idle threshold (typically 5 minutes stationary, with weather exceptions) — delivered to the driver's in-cab display or phone so self-correction happens on-scene, not weeks later. Daily scorecards publish each driver's yesterday-idle percentage vs fleet average, emailed at 6am so drivers see their number before they start the day. Weekly coaching conversations are held by supervisors with drivers flagged in the bottom quintile of the scorecard, citing specific timestamped events (not aggregate numbers) with documented outcomes logged in the driver file. Monthly KPI reviews aggregate the whole program into fleet-wide idle percentage, dollar savings versus baseline, bottom-quintile driver churn, and location-cluster hotspots — presented to operations leadership for program adjustments and budget defense. The reason for four cadences: real-time alerts alone produce fatigue, daily scorecards alone produce data without action, weekly coaching alone can't prove ROI, monthly review alone is too late to change behavior. Together, they form the rhythm that actually moves the number and sustains the reduction.
What's the difference between necessary and avoidable idle?
Necessary idle is fuel consumption the driver has no reasonable alternative to producing. Extreme-weather cabin comfort (below 20°F or above 95°F ambient in the sleeper berth without an APU or shore power), diesel particulate filter regeneration cycles that require sustained temperature, PTO operations for hydraulic work or concrete pumping, mandatory warm-up periods on some engine families in extreme cold, and emergency response idle all fall into this category. The correct policy response is not to flag necessary idle as a violation — it's to bake weather and PTO exceptions into the alert logic so those events don't generate noise. Avoidable idle is fuel consumption produced by driver habit or convenience rather than operational necessity. Extended drive-thru waits with the engine running, "just for a minute" stops that turn into 15 minutes, sleeper berth HVAC in mild weather when battery-powered alternatives are available, warm-up periods far exceeding manufacturer specifications, and any stationary idle beyond the 5-minute threshold in mild ambient conditions. Roughly 70-80% of fleet-wide idle on typical operations is avoidable. That's the recoverable pool. The other 20-30% is necessary and belongs in the exception queue, tracked separately, and left alone.
How does HVI help fleets run an idle reduction program?
HVI's fuel management module integrates with major telematics providers (Geotab, Samsara, Verizon Connect, Fleet Complete, and others) to capture idle events in real time with ECM-level accuracy — not GPS-only approximation. Real-time alerts fire against configurable thresholds with weather-aware exception logic (no false alerts during legitimate extreme-temperature HVAC or DPF regen). Daily driver scorecards publish overnight and email at fleet-defined times, showing per-driver idle percentage against fleet average. Weekly coaching-target reports surface flagged drivers with timestamped event details supervisors can cite directly in conversations. Monthly KPI dashboards show fleet idle percentage trended over 12 months, dollar savings calculated automatically against baseline, bottom-quintile driver churn tracked for coaching effectiveness, and location cluster hotspots surfaced for systemic-cause investigation. The whole four-cadence rhythm runs automatically once configured. For operations directors like Jerome W. running 180-tractor regional fleets, the typical result is 10-15 percentage-point idle reduction within the first two quarters — worth $100,000-$200,000 in annual fuel savings before accounting for the compounded maintenance and DPF benefits. Book a demo to see the four-cadence idle program running live.
The idle number is one of the easiest fleet costs to fix. The program is what makes the fix stick.
HVI runs the four-cadence idle reduction rhythm automatically — real-time telematics alerts with weather exceptions, overnight driver scorecards, weekly coaching-target reports, monthly CFO-ready KPI dashboard. Fleets typically cut idle 10-15 percentage points in the first quarter of running the rhythm.