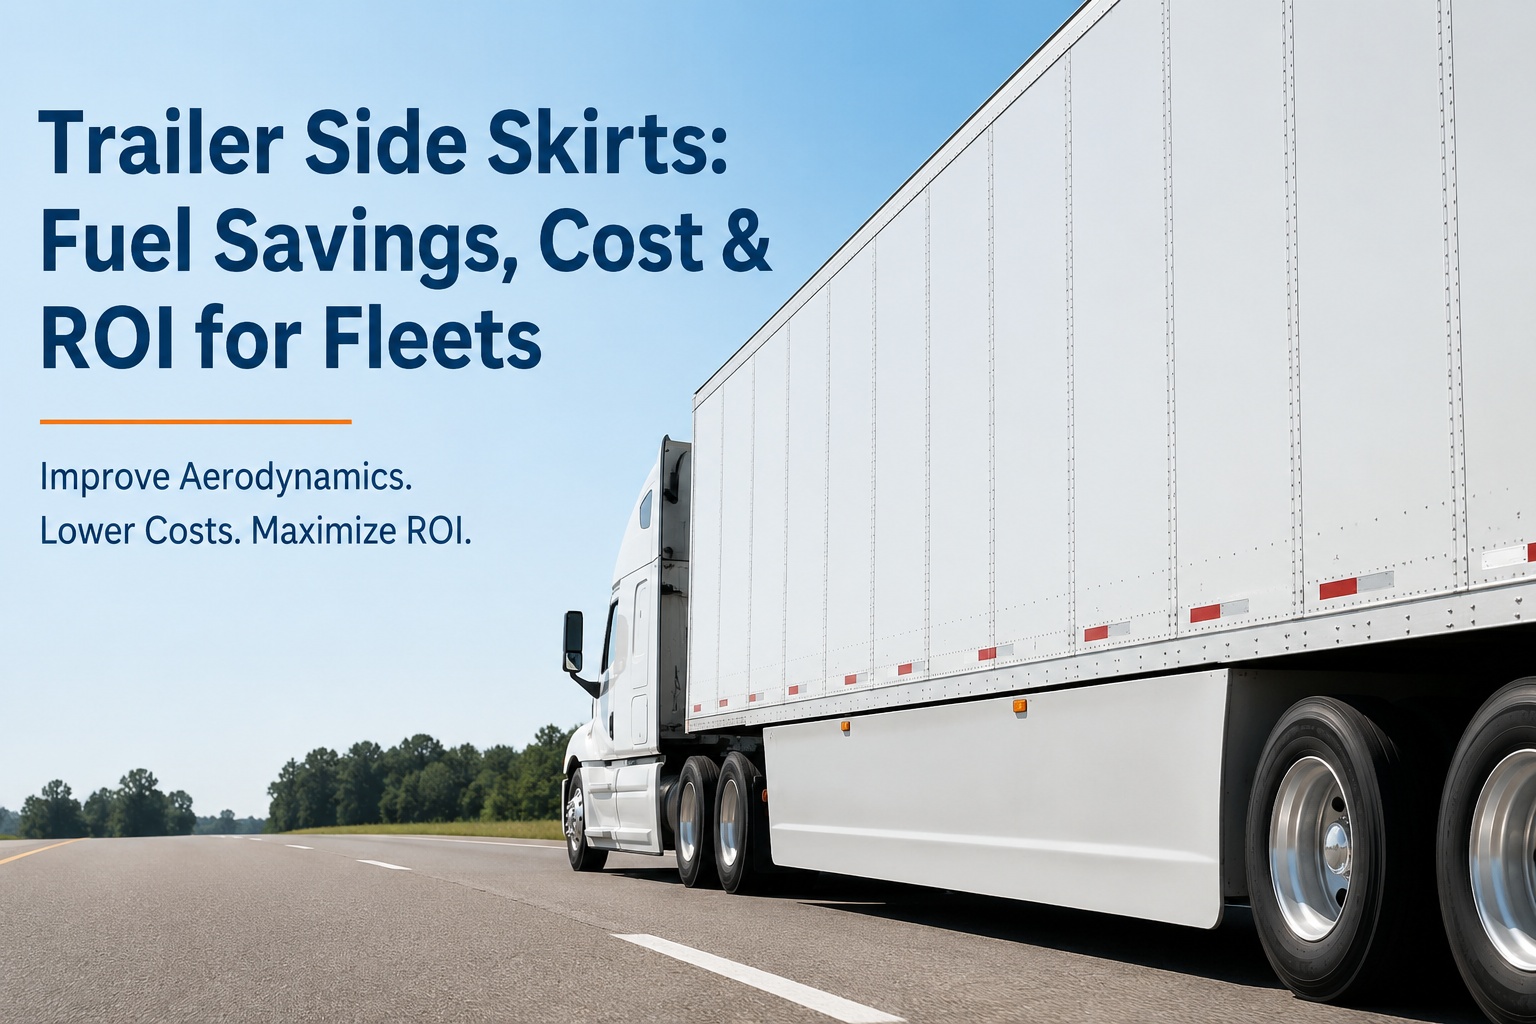
Trailer side skirt fuel savings numbers on manufacturer websites are almost never wrong — they're just quoted at their peak operating profile and applied by fleets running very different duty cycles. EPA SmartWay verifies 4-5% at highway speeds; NACFE reports 5-7%; SmartWay Elite hits 9%+. Your fleet's actual number depends on average speed, highway share, baseline MPG, fuel price, damage exposure, and install cost. This guide shows the real calculation across four fleet profiles — book a demo to measure fleet fuel and trailer ROI in HVI.
Trailer Side Skirt ROI Across Four Fleet Profiles
Same $900 install cost per trailer, same 4-6% peak savings potential — four very different payback numbers because the operating profile is what turns saving potential into saving reality.
Same equipment. Same install cost. Payback ranges from 2.5 months (long-haul OTR) to 34+ months (short-haul urban). The operating profile is the entire ROI story.
The 4 fleet profiles above each represent common commercial operating types.
The rest of this page walks the drag-vs-speed physics that makes side skirts effective on some routes and useless on others, the real annual cost including damage exposure, and the fleet-level analytics that convert a "we think it saves fuel" hunch into a per-asset ROI number. Book a 30-minute demo to see fuel savings by asset in HVI.
Why speed decides everything — the drag curve most brochures skip
Aerodynamic drag increases with the square of speed. That single physics fact is what separates a trailer skirt investment that pays back in 3 months from one that never pays back at all. At 55 mph, drag is roughly 40% of total fuel burn on a Class 8 truck. At 75 mph, drag climbs to nearly 65%. Below 45 mph, drag is a minor factor and rolling resistance dominates — which is why skirts return almost nothing on urban delivery routes and everything on interstate OTR.
The practical takeaway: skirt savings are not a single percentage. They're a function of what proportion of the fleet's operating hours fall inside the peak-benefit zone (55-70 mph, steady-state cruise). A fleet with 85% of its miles above 55 mph will see close to the 5-7% NACFE range. A fleet with 25% of its miles above 55 mph will see closer to 1-2%. Before spec'ing skirts across an entire fleet, the operating-profile question is the first question — not the last. Route-level analysis matters more than fleet-average speed alone: a fleet averaging 58 mph across all routes might have a subset of urban delivery runs averaging 32 mph where skirts return nothing and a subset of interstate line-haul averaging 68 mph where skirts return everything. Spec by route profile, not by fleet mean, and the ROI picture sharpens considerably. Book a demo to see per-asset speed profile and drag exposure in HVI.
The real annual cost — what brochures leave out
Install price is the visible cost. Three other line items enter the real total-cost-of-ownership equation, and any ROI calculation that ignores them will overstate payback by 30-50%. The three often-omitted lines: damage repair over the equipment's life, weight-penalty fuel cost (skirts add 100-150 lb per trailer), and PM cost for skirt mounts and fasteners over time.
| Cost line | Typical range | When it matters most |
|---|---|---|
| Install cost per trailer | $700 – $1,100 (EPA SmartWay range) | One-time capex, universal |
| Higher-end / advanced skirts | $1,100 – $1,800 | Full aero packages with tapered profiles |
| Damage repair over 5 yrs | $200 – $800 per trailer average | Urban / yard operations, snowy climates, tight docks |
| Weight-penalty fuel cost | ~0.05% MPG loss per 100 lb added weight | Weight-constrained loads (bulk, heavy freight) |
| Skirt PM (mounts, fasteners) | $50 – $150 per trailer annually | Every fleet — often overlooked in first-year math |
| Removal for tyre / brake work | $25 – $75 labour per event | Frequent maintenance sites, mobile service |
For a long-haul OTR fleet running 85% highway, these additional costs typically knock 15-20% off the raw fuel-savings ROI — still leaving a payback under 6 months at moderate fuel prices, so the math clearly still works. For a short-haul urban fleet, these same costs can flip a marginally-positive-ROI decision into a negative-ROI decision within the first 24 months. Every fleet needs its own math, and the answer depends on the operating profile of the specific fleet. Two additional variables are worth flagging: fuel-price volatility (a swing from $3.85 to $4.50 per gallon compresses payback significantly, making borderline profiles suddenly attractive), and skirt life expectancy (typical service life is 8-10 years, which spreads the amortised install cost across a longer earning window than most first-year ROI calculations assume). Book a demo to see actual damage costs tracked per trailer in HVI.
The 4-step pilot — how to prove the number for your fleet before scaling
The fastest way to answer "will skirts pay back for our fleet?" is not a spreadsheet exercise against industry averages. It's a controlled 60- to 90-day pilot on a representative slice of the fleet, with the fuel and route data captured against a proper baseline. Four steps produce a defensible per-fleet ROI number.
Baseline measurement
60 days of pre-skirt fuel and MPG data on 5-10 representative trailers, matched to the routes, drivers, and season you'll compare against. Baseline quality determines every downstream number.
Skirt installation
Install skirts on the pilot fleet, capture install cost per unit, note any spec differences by manufacturer. Photograph each trailer at install for baseline damage record.
Post-install measurement
60-90 days of post-skirt fuel data on the same trailers, same routes, same drivers where possible. Capture any skirt damage events and repair cost during the window. Compare like-for-like.
Fleet-level projection
Compute actual per-trailer annual savings for the pilot fleet, project across the full fleet with adjustments for any operating-profile differences between pilot and general fleet, and produce a defensible payback number for the CFO.
The pilot approach beats the spreadsheet approach because it captures the fleet's actual duty cycle, actual damage exposure, actual driver mix, and actual maintenance overhead — not industry averages. A pilot that produces a 4.1% real saving on a fleet where the brochure predicted 6% is a valuable answer, because it lets the CFO make an informed capital decision. A spec'd fleet with a "we expected 6% and got 2%" outcome 18 months in is a much more expensive lesson. Start a free HVI trial to run your baseline and pilot measurement with real per-asset data.
A refrigerated carrier fleet director on the pilot that saved their spec decision
We run 190 refrigerated trailers — regional mixed, 65% highway, average 78k miles per trailer per year. In 2024 we were about to spec skirts fleet-wide on the strength of our leasing partner's projection of 5-6% savings. Before signing, our fleet engineering pushed for a 12-trailer pilot. 90 days baseline, install, 90 days post — same lanes, same drivers where we could.
Real number came back at 3.4%, not 5-6%. That's still a positive ROI — payback around 7 months at our fuel spend — but very different from the projection. What we couldn't have known without measuring: our fleet spends more time below 55 mph than we thought, mostly in dense-urban distribution around the Northeast. We still spec'd fleet-wide, but with realistic ROI expectations, and we pushed for higher-damage-resistance skirts because our real damage rate came in above industry average too. Pilot cost us maybe 3 weeks of work and saved us from a projection that would have missed by nearly half.
Frequently asked questions
How much fuel do trailer side skirts actually save?
EPA SmartWay verifies trailer side skirts at 4-5% fuel savings at highway speeds. NACFE (North American Council for Freight Efficiency) confirms 5-7% under favourable conditions. SmartWay Elite trailers combining skirts with other aerodynamic devices (boat tails, gap reducers) hit 9% or more. The right answer for your fleet depends on the proportion of miles run in the peak-benefit zone (55-70 mph steady-state cruise), your baseline MPG, and your operating profile. Aerodynamic drag increases with the square of speed — at 55 mph drag is roughly 40% of total fuel burn on a Class 8 truck, at 75 mph it climbs to nearly 65%, below 45 mph rolling resistance dominates and skirts return almost nothing. A long-haul OTR fleet with 85% highway miles typically sees close to the 5-7% NACFE range; a short-haul urban fleet with 25% highway miles typically sees 1-2%. Same equipment, same install cost, very different real savings. Verify against your specific operating profile before extrapolating from published numbers.
What is the payback period on trailer side skirts?
Payback ranges from about 2-3 months for a long-haul OTR fleet to over 30 months for a short-haul urban fleet, at moderate fuel prices around $3.85 per gallon. The calculation: annual fuel savings = annual mileage / baseline MPG x fuel price x skirt savings %; payback = install cost / annual savings. Worked example for long-haul OTR at 130,000 miles/year, 6.5 MPG baseline, $3.85/gal, 5.5% savings: fuel spend $77,000/year, skirt savings $4,235/year, install cost $900, payback 2.5 months. Same math for short-haul urban at 40,000 miles/year, 5.8 MPG baseline, 1.2% savings: fuel spend $26,550/year, skirt savings $319/year, install cost $900, payback 34+ months. Damage exposure and maintenance costs typically knock 15-20% off the raw fuel-savings ROI in real operations, so add a buffer to the calculated payback number. EPA SmartWay's rule of thumb of a 12-month payback assumes a highway-heavy operating profile at moderate fuel prices, and holds for that profile.
What does it cost to install trailer side skirts?
EPA SmartWay quotes trailer side skirt cost in the $700-$1,100 per trailer range for standard installations. Higher-end skirts with tapered profiles, wide-base tyre compatibility, or full aero packages can reach $1,100-$1,800 per trailer. Historically the cost has declined significantly — $2,000 per trailer was typical in 2008, dropping to about $750 by 2011 as materials and manufacturing improved. Today more than 50% of new 53-foot dry van trailers are estimated to be built with skirts installed at the factory, which is significantly cheaper than retrofit. Beyond the install cost, three often-omitted line items enter the real TCO: damage repair over the equipment's life ($200-$800 per trailer over 5 years, varies dramatically by operating environment), weight-penalty fuel cost (~0.05% MPG loss per 100 lb added weight, and skirts add 100-150 lb), and skirt PM including mounts and fasteners ($50-$150 per trailer annually). Every fleet's real cost is different, and the calculation should be done against your specific operating environment before scaling.
Do trailer skirts get damaged easily?
Damage exposure is real and varies enormously by operating environment. Skirts hang low along the trailer sides and are exposed to curbs, snow banks, uneven driveways, dock plates, off-road pull-ins, and tight yard turns. A long-haul OTR fleet running interstate lanes with well-designed rest stops typically experiences low damage over 5 years. A regional or short-haul fleet running frequent urban delivery, tight dock backing, and snowy climates typically experiences significantly higher damage. Materials have improved considerably over the last 20 years — modern skirts are lighter, made from flexible thermoplastic or composite materials, and designed to flex on impact rather than shatter. Higher-damage-resistance skirt lines with reinforced leading edges and impact-forgiving materials are available at a modest cost premium, and typically pay for themselves quickly on fleets with elevated exposure. Damage tracking per trailer over the first 12-24 months of skirt operation reveals whether the fleet's operating profile justifies the standard skirt or the reinforced version, and lets the CFO make an informed spec decision on future orders.
Can I combine skirts with other aerodynamic devices?
Yes, and stacking is where the largest fleet-fuel savings are realised. EPA SmartWay Elite recognition applies to 53-foot dry van and refrigerated trailers equipped with two or more verified aerodynamic devices delivering 9% or more combined fuel savings. Common stacks: side skirts (4-7% typical) combined with a boat tail or rear fairing (3-5% additional, cost $1,000-$1,600) commonly produce 7-10% combined savings. Adding a gap reducer between tractor and trailer or an under-carriage air dam can add another 1-2%. Cab-side extensions and tractor roof fairings work on the tractor side rather than the trailer, but stack with trailer devices for total aero optimisation. The important operational rule: stacking savings do not simply add. Two devices each verified at 5% do not produce 10% combined — typical stacked benefit is 7-8% because the aerodynamic effects overlap. NACFE publishes a Confidence Report on trailer aerodynamics that walks through the interaction effects and helps fleets model realistic combined ROI. Verify against your specific operating profile before spec'ing a full aero package fleet-wide.
Stacking aerodynamic devices — where the biggest fleet savings live
Trailer side skirts are the most common aero device, but they are one part of a complete aerodynamic package. Fleets targeting the highest fuel-savings tier stack multiple devices — and this is where the EPA SmartWay Elite classification recognises 9-10%+ combined savings on 53-foot dry van and refrigerated trailers with two or more verified aerodynamic devices. Understanding how devices stack (and where their effects overlap) prevents the common mistake of adding the individual savings percentages and expecting them to sum.
Side skirts
Baseline aero device. 4-7% typical highway savings. $700-$1,100 install. Attaches under the trailer sides between axles. Most damage-exposed device.
Boat tail / rear fairing
Cuts low-pressure wake behind trailer. 3-5% additional highway savings. $1,000-$1,600 install. Adds trailer length considerations. Stacks well with skirts.
Gap reducer
Fills space between tractor and trailer (ideal 36-48 in gap). 1-2% additional highway savings. Effective on fleets with variable tractor-trailer combinations.
Cab & roof fairings
Tractor-side devices — roof fairing, side extenders, chassis fairings. 3-5% additional. OEM-fitted on modern aero tractors; retrofit possible on older units.
The operational rule that fleet engineers should internalise: stacked savings do not linearly add. Two devices each verified at 5% do not produce 10% combined — typical stacked benefit is 7-8% because the aerodynamic effects overlap and reducing drag in one zone changes the flow available for the next device to reduce. NACFE publishes a Confidence Report on trailer aerodynamics that walks through the interaction effects and helps fleets model realistic combined ROI before spec'ing a full aero package. For most highway-heavy fleets, the sweet spot is side skirts plus boat tail (SmartWay Elite qualifying) — the incremental gain from adding a third or fourth device typically doesn't pay back within a reasonable window unless the fleet is running very high mileage at very high speeds. Book a demo to model stacked aero device ROI per asset in HVI.
Measure your actual skirt ROI before spec'ing your next 100 trailers
HVI tracks fuel consumption per trailer and per route, captures damage events with cost, holds trailer PM history, and produces per-asset TCO you can compare pre- and post-skirt. Run a controlled 60-90 day pilot on 5-10 trailers, measure real savings against real baseline, calculate real payback for your operating profile — then scale the spec decision on data, not brochures. Live in under two weeks. No hardware. No credit card.
Trusted by long-haul, regional, LTL & distribution fleets across USA, Canada, UK & Australia · Ready on day one