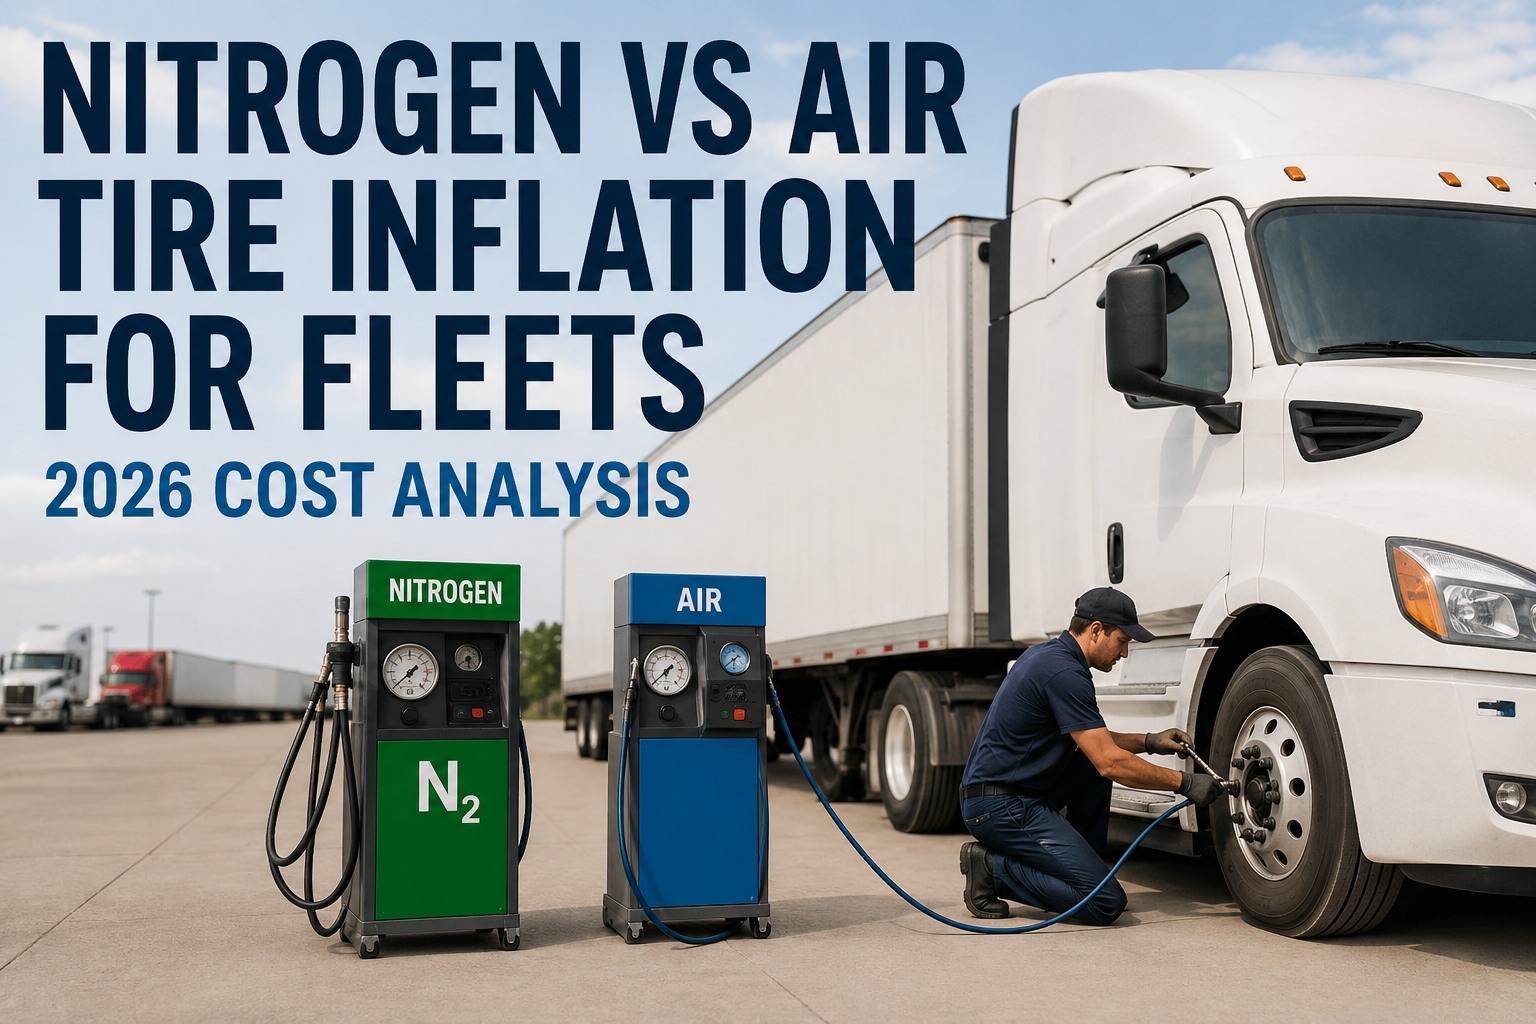
Every tire shop in North America has offered you the green-cap upgrade. Every tire manager has heard the pitch: better pressure retention, longer tire life, better fuel economy, less blowout risk. And every fleet has run the math a different way. The honest answer isn't "yes" or "no" — it's "it depends on your operation, and the number is smaller than the salesperson claims but larger than the skeptics admit." This is the real 2026 nitrogen vs air tire inflation cost analysis for commercial fleets, with the break-even math laid out per truck. Book a demo
Nitrogen inflation pays back on some fleets. Not all. Here's how to tell which side of the line you're on.
Round 1 — Pressure retention: the only physical difference that matters
Everything else about nitrogen (fuel savings, tire life, blowout reduction) is a downstream effect of one physical property: nitrogen molecules are larger than oxygen molecules and diffuse through rubber more slowly. Here's what that actually looks like in numbers on a commercial tire.
- ×Contains oxygen — oxidizes rubber and steel belts over time
- ×Contains water vapor — expands/contracts with temperature
- ×Smaller molecules leak through tire walls faster
- ✓Free at every truck stop, tire shop, and yard compressor
- ✓Zero equipment cost, zero training required
- ✓Inert — no oxidation of rubber, belts, or wheel
- ✓Dry — no moisture, more stable pressure across temperature
- ✓Larger molecule permeates 3-4× slower through rubber
- ×Requires nitrogen generator or bulk supply at the yard
- ×Top-off availability limited on the road
The real cost of underinflation — what's hiding in your fuel bill right now
Before comparing nitrogen vs air, understand the baseline problem both are trying to solve. Underinflation isn't a rare condition on commercial fleets — it's the default state. FMCSA data shows 55% of commercial vehicles have at least one tire running 10+ PSI below optimal, and one in five tractors has a tire underinflated by 20 PSI or more. The economic damage compounds silently.
Nitrogen or air is not the real question. Pressure discipline is the real question. Nitrogen buys you a longer window between checks. It does not eliminate the need to check. Start free and get tire pressure trending per wheel position
The break-even math — per truck, per year, in dollars
Independent studies (Clemson, Bridgestone, published fleet case data) put nitrogen's practical fuel benefit for a well-maintained commercial fleet at roughly 0.5-1.5% MPG improvement and tire-life extension at 10-30% depending on operation. Race-car claims of 57% tire life extension apply mostly to specialized applications (aircraft, mining, motorsports). Here's the honest per-Class 8 tractor math at fleet-realistic numbers.
The number that matters isn't the total — it's the breakdown. Fleets with weekly pressure discipline capture the fuel and tire-life gains regardless of gas. Fleets that only touch the tire when it's flat get most of the "nitrogen benefit" from simply starting to check. Solve the discipline problem first; the gas question comes second. Book a demo to see per-tire pressure trending built into every walkaround
The decision framework — when nitrogen pays, when it doesn't
Not every fleet gets the same return. The answer depends on duty cycle, current tire-management discipline, and asset type. Use this framework to decide honestly for your specific operation, or book a demo to walk through the analysis with your fleet's numbers.
Nitrogen isn't a fleet miracle and it isn't a scam. It's a modest, measurable, real advantage that pays back on the fleets where mileage, tire cost, and pressure-check discipline all align. For everyone else, disciplined pressure management with regular air captures 80-90% of the benefit at zero equipment cost. Start free and get the per-wheel pressure discipline that makes either gas work
From a tire manager running 220 tractors and 340 trailers
We piloted nitrogen on 40 trailers in 2023 while keeping the rest of the fleet on air. Twelve months of side-by-side data. The nitrogen trailers averaged about 4-5 more PSI at any given check than the air trailers, tire life stretched by about 12%, and roadside events on that subset dropped roughly a third. Real numbers, not marketing.
But here's what the pilot really taught us: the biggest gain came from the fact that we were now measuring. The air side of the fleet also got better because our drivers started paying attention. When we rolled pressure into the daily walkaround with photo evidence on any tire under threshold, that alone got us maybe 60% of the nitrogen benefit. Nitrogen closed the last 40%. If I had to pick one, I'd pick the measurement discipline every time — and add nitrogen only to the trailer pool that sits idle the longest.
Frequently asked questions
How much better does nitrogen actually hold pressure than compressed air?
Laboratory data consistently shows nitrogen-filled tires losing pressure at approximately 1.39% per month versus 2.13% per month for standard compressed air — roughly 35% slower diffusion. On a Class 8 truck tire inflated to 105 PSI, that means air will drift to 95 PSI (10 PSI low) in roughly 5 months of no maintenance, while nitrogen takes 7-8 months to reach the same underinflation. The physics is straightforward: nitrogen molecules are larger than oxygen molecules and permeate more slowly through the porous rubber of a tire wall. However, this advantage disappears entirely if either gas is mixed. Adding regular air to a nitrogen-filled tire drops the concentration below the 93-95% threshold and the diffusion rate moves back toward the air baseline. It also doesn't affect leaks through valves, bead seats, or punctures — those go flat at the same rate regardless of gas. The bottom line: nitrogen buys you a longer window between pressure checks, not a set-and-forget tire.
Is the fuel economy benefit of nitrogen inflation real?
Yes, but smaller than commonly claimed and entirely dependent on whether the alternative fleet is checking pressure. The physics: any properly inflated tire produces the same rolling resistance regardless of what gas is inside. Nitrogen only wins on fuel economy because the pressure stays closer to spec for longer periods between checks. DOE and NACFE benchmarks put fuel loss at approximately 1% for every 10 PSI of underinflation across tires. If your fleet checks pressure weekly and adjusts as needed, air-filled tires stay at spec and nitrogen's fuel advantage is essentially zero. If your fleet checks pressure monthly or less — which describes most fleets per FMCSA's underinflation data — nitrogen delivers a real 0.5-1.5% MPG improvement because the tires simply spend less time underinflated between checks. Independent published fleet data supports the lower end of that range for typical trucking operations, with the higher end applying mostly to specialty applications (mining, aviation, motorsports) where the operating environment magnifies the retention advantage.
What does nitrogen inflation actually cost per tire for a fleet?
Costs break into three buckets. Initial fill: $5-$30 per tire at commercial rates, typically $10-$15 for Class 8 truck tires when done as a fleet contract. Top-offs: $3-$10 per tire per top-off event, with 3-6 top-offs per year typical depending on climate and duty cycle. In-house nitrogen generator: fleets running 100+ vehicles often justify buying a nitrogen generator ($8,000-$25,000 depending on capacity) to eliminate per-fill costs and always have nitrogen available at the yard. Amortized over 5 years and spread across the fleet, an in-house generator adds roughly $30-$60 per truck per year, cheaper than paying per-fill on a large fleet. The total annual cost per Class 8 tractor typically lands between $130-$250 including all top-offs. That number needs to be weighed against fuel savings (~$300-$900 per truck at 0.5-1.5% MPG gain on a 100K-mile Class 8), tire life extension (10-30% depending on duty cycle), and reduced roadside blowout events.
Can you mix nitrogen and regular air in the same tire?
Yes, it's mechanically safe and no damage results from mixing — but doing so partially defeats the reason for using nitrogen. Pure nitrogen at 95%+ concentration is what produces the 3-4x slower diffusion rate versus oxygen. Once you top off a nitrogen-filled tire with regular air (78% nitrogen already, so adding air dilutes to somewhere between 78% and the original 95%+), the retention advantage shrinks toward the air baseline. The practical guidance: if a nitrogen-inflated tire is losing pressure on the road and no nitrogen is available, top off with air rather than driving on an underinflated tire — an underinflated pure-nitrogen tire is more dangerous and more damaging than a properly-inflated mixed-gas tire. Then re-purge and refill with nitrogen at the next opportunity if the fleet is committed to the nitrogen program. Some fleets consciously accept the mixing trade-off and treat nitrogen as a "starting condition" that gradually becomes standard air over the tire's life — that captures maybe 50-60% of the retention benefit at essentially the same operational simplicity as air-only.
Does HVI help fleets manage tire pressure regardless of what gas is inside?
Yes. HVI's tire management module captures pressure readings per wheel position on every driver walkaround (DVIR) and every PM inspection, tracks pressure trends over time per tire, and auto-generates a work order when any reading drops below the fleet-defined threshold. Tread depth is captured on the same interface and trended against pressure to identify wear patterns that suggest chronic underinflation before they become blowouts. For fleets on nitrogen, the same workflow tracks nitrogen top-off dates and pressure retention per tire — producing the actual before/after data needed to validate whether nitrogen is paying back on your specific operation, rather than relying on general industry claims. For fleets on air, the discipline of measuring pressure every walkaround captures roughly 60-70% of the nitrogen benefit at zero gas cost. The comparison isn't nitrogen vs air — it's measured-and-managed vs unmeasured. HVI runs the measurement. Book a demo to see per-wheel tire pressure and tread tracking built into every inspection.
Nitrogen or air, the tire management still has to happen. Make it happen automatically.
HVI captures pressure and tread depth on every DVIR and PM, trends drift per wheel position, and triggers a work order the moment any tire crosses threshold. Whether your fleet runs nitrogen, air, or a mix — the measurement discipline is what turns tire cost into a managed line item.