Every ton moved out of a pit either makes you money or costs you money — and the line between the two is set by numbers most sites don't track tightly enough. This page breaks the number down, shows exactly where the biggest leaks are on a 240-ton haul truck, and walks through 12 practical levers that mining operations use to pull the off-highway truck cost per ton down without cutting production. Book a demo
Cost per ton is the KPI that decides whether a pit is profitable this quarter
The math is simple. Total truck cost divided by tons hauled. What's hard is finding out where the number is really coming from — and where a mid-tier fleet can realistically pull it down.
If your site is producing at 200,000 tons a month and your cost per ton is off by even 30 cents, that's $60,000 leaving the mine every month for a reason nobody at the morning meeting is naming. Most cost-per-ton problems aren't production problems — they're maintenance, tire, and information problems that show up on the wrong line of the P&L. Here's the anatomy of the number, and where to actually push.
The anatomy of cost per ton — where every dollar actually goes
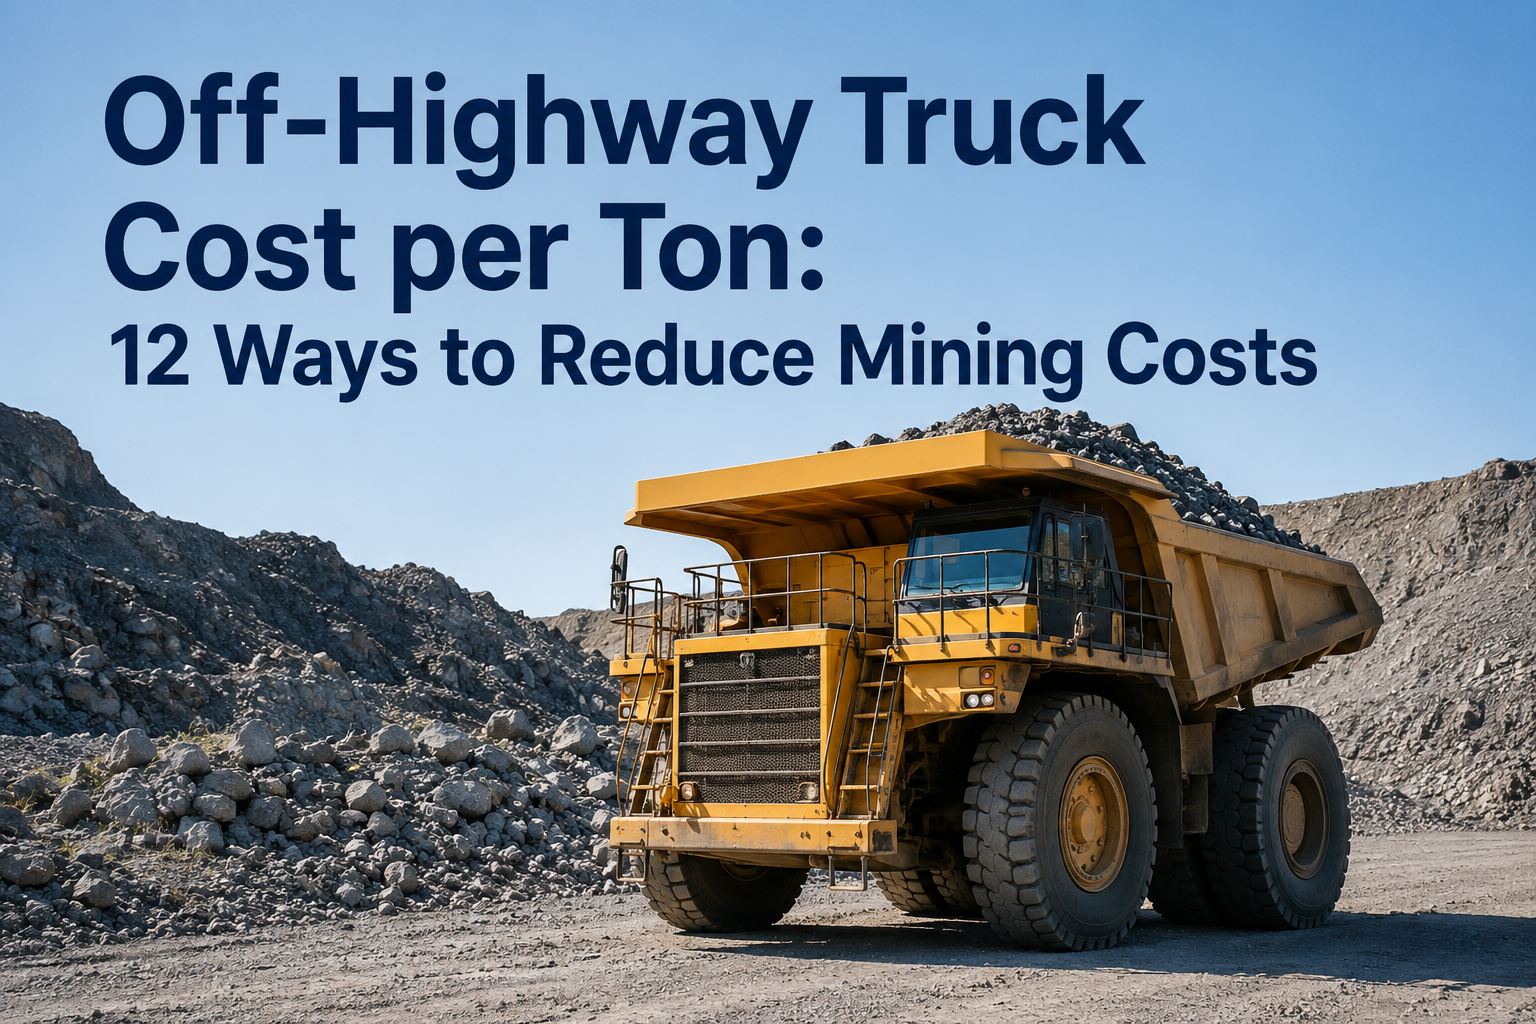
Take a rigid-frame haul truck in the 150-to-240-ton class, running two shifts, hauling ore. The hourly owning-and-operating cost typically lands north of $250. When you break that down by category and divide by tons per hour, the picture looks like this.
Up to 30 gph on big trucks. Rolls up with idle time, payload variance, road grade and tire pressure.
$20K–$45K per tire; a full set on an ultra-class can run to $600K. TKPH violations and pressure drift kill life faster than terrain.
Filters, fluids, ground engaging tools, hoses, brake components. Consumption tied directly to inspection quality and PM discipline.
Operator, technician and support labor per hour. The ratio of planned to unplanned work drives whether this line is efficient or bloated.
Depreciation, insurance, financing, admin allocated per operating hour. Fixed line — but availability changes how it's amortized.
Two things stand out. First: fuel and tires together are more than half the number, and both are highly sensitive to maintenance discipline. Second: the biggest lever isn't cutting any single line — it's raising availability so the fixed costs (capital, labor, allocated overhead) spread over more tons. Every point of availability recovered is a direct cost-per-ton reduction. Book a demo to see per-truck cost-per-ton broken down by category
5 quiet cost drivers most mines don't measure — and each one is fixable
Before jumping to the playbook, know where you're already leaking. These five drivers rarely show up on a monthly P&L in a way that identifies them, but every one of them lands in cost per ton.
Payload carryback debris
Dried material stuck in the truck body reduces effective payload by up to 4%. On a 400-ton truck that's a $240K–$320K annual capacity loss — per unit.
Idle time & queue burn
Trucks queued at the shovel or dump burn 4–8 gph doing zero work. Idle is one of the largest recoverable line items on any mine site.
TKPH & pressure drift
Improper tire pressure is linked to 85% of mining tire accidents (Goodyear/Continental) and cuts tire life 30–50%. Correct pressure = 40% fewer failures.
Emergency vs planned work
An emergency repair costs ~4.8x the same job done planned. Every failure caught by PM instead of a broken component is a direct cost-per-ton win.
Availability variance
A fleet running 82% vs 88% availability moves 7% fewer tons on the same fixed cost base. That gap alone can be the difference between profit and loss.
The pattern in all five: they're process problems, not equipment problems. Better trucks don't fix them — better information, better inspections and tighter PM cadence do. Start free and get idle, tire pressure and availability tracked on one dashboard
12 practical levers to reduce off-highway truck cost per ton
None of these are exotic. Every one is being run right now at mid-tier mines that have moved into the top-quartile cost band. Grouped by lever type — pick the ones with the biggest gap between where you are and where the number could go.
Switch PM triggers from calendar to meter reading
Engine hours are the truth. A truck running 22-hour days needs oil sooner than the calendar suggests; a truck idle for a week doesn't. Meter-based PM cuts wasted service and catches real wear.
Auto-open work orders on failed inspection items
The window between "operator flagged it" and "shop fixed it" is where cost hides. Every defect flagged on a digital DVIR should generate a work order the same shift.
Track planned-to-unplanned repair ratio weekly
Top-quartile sites run 80/20 planned-to-unplanned. Every point moved from unplanned to planned saves ~4.8x on the same repair. This is the single most powerful reliability KPI.
Monitor tire pressure daily, not weekly
Pressure drift shortens life 30–50% and drives 85% of mining tire failures. Daily pressure checks on a digital DVIR flip that curve — and pay back the process in weeks.
Manage TKPH by truck & haul route
Tonne-kilometre-per-hour rating is the tire's real limit. Match tire spec to route TKPH, then track it — overheating is what actually kills OTR tires, not distance.
Rotate on hours, not visual wear
Waiting for tread wear before rotating means the rotation is already late. Meter-based rotation extends life materially and reduces per-tire cost per ton.
Cut idle to under 15% of engine-on time
Queue burn and end-of-shift idle can push idle above 30% on undermanaged fleets. Every 10 points recovered is 3–4% of total fuel spend gone.
Reconcile fuel logs to engine hours weekly
Fuel-per-engine-hour trending catches operator-behavior drift, injector wear, and fuel-slip issues before they turn into a monthly variance nobody can explain.
Eliminate carryback from truck bodies
Every 4% of body volume lost to hardened carryback is 4% more trips to move the same tonnage. Body cleaning discipline is a fuel savings program in disguise.
Roll cost per ton by truck, not by fleet average
A fleet-average number hides the worst and best performers. Per-truck cost per ton exposes which units need overhaul, which drivers need coaching, which routes need work.
Track availability, utilization & MTBF together
Availability without utilization looks great on paper. All three read as one story tell you whether the fleet is genuinely productive or just parked in a shape that flatters KPIs.
Make the cost-per-ton dashboard visible to shift leads
The KPI moves when the people making minute-by-minute decisions can see it. Executive-only dashboards produce reports; shared dashboards change behavior.
None of these levers require a fleet-wide rebuild or a new procurement cycle. They're operating discipline plays — and every one runs better on connected data than on paper. Book a demo to see all 12 levers instrumented on one platform
What the math looks like — a mid-tier mine, one year later
Round numbers only, but grounded in what published mining cost studies and HVI customer data actually show. A 20-truck fleet, 240-ton class, hauling ore two shifts a day, roughly 200,000 tons per truck per year.
The math scales linearly. Push it across 40 trucks, or a network of three sites, and the recovered spend outpaces what most mines will ever spend on the tools that produced it. That's the fundamental economics of the number — it's the highest-leverage KPI in the operation, and it responds to discipline, not capital.
From a mining maintenance manager who moved the number
For years we quoted cost per ton at monthly meetings like it was the weather — you talked about it, you didn't change it. What actually moved the needle for us wasn't a new fleet. It was making the number visible per truck, per shift, and putting it in front of the shift leads and shovel operators, not just the general manager.
Within eight months we pulled 21 cents per ton out. Half of that came from tires — we finally had daily pressure records instead of "someone checked it last week." Another chunk came from cutting the ratio of unplanned work down. The rest was fuel and idle. It took a CMMS to make any of it possible; before that we were guessing.
Frequently asked questions
What is off-highway truck cost per ton and how is it calculated?
Off-highway truck cost per ton is the total cost of operating a haul truck divided by the total tonnage the truck moves over the same period. The formula is straightforward: (fuel + tires + parts & consumables + labor + capital recovery + overhead) ÷ total tons hauled. What makes the number difficult in practice is not the formula — it's building the data pipeline to get all six cost categories captured accurately per truck, matched against payload weigh-in data, and reported consistently. Most mid-tier sites can produce a fleet-average number without much trouble, but per-truck cost per ton — which is where the real optimization signal lives — requires digital inspections, work order data, fuel logs and payload records living in one connected system. A typical ultra-class haul truck in the 200–400 ton range costs over $1 million per year to operate; multiplied across a 20–40 truck fleet, small movements in cost per ton produce very large dollar swings. That's why the KPI matters even at operations where the tonnage side of the ratio is essentially fixed by ore body and processing capacity.
What is a good cost per ton benchmark for a haul truck fleet?
Benchmarks vary enormously by ore type, haul distance, road grade, elevation, truck class and local fuel and labor costs, so any single "good" number is misleading without context. What matters more than an absolute benchmark is trending: the same fleet, same conditions, should be able to reduce cost per ton by 15–25% over 12 to 18 months through a disciplined program that raises availability, cuts idle time, extends tire life and shifts the planned-to-unplanned repair ratio. Top-quartile operations in the same commodity segment typically run cost per ton 20–30% below industry average, driven mostly by four factors: fleet availability above 88%, idle time under 15%, planned-to-unplanned work ratio at 80/20 or better, and tire life within 10% of manufacturer TKPH targets. If your fleet is missing any of those four, the improvement potential is likely significant.
Which cost category has the biggest impact on mining cost per ton?
On a standard hourly-cost breakdown, fuel typically leads at around 35% of the number, tires at roughly 20%, parts and consumables at 18%, labor at 15%, and capital recovery/allocated overhead at 12%. So fuel is the biggest single line — but the biggest lever isn't cutting any one line, it's raising equipment availability. Every percentage point of availability recovered spreads the fixed costs (labor, capital, overhead) over more tons, which pulls the entire cost-per-ton number down without touching the individual expense categories. That's why unplanned downtime is such a punishing cost driver: a single haul truck down unplanned burns $5,000 to $20,000 per hour in direct and opportunity cost, and the same repair done as emergency work costs about 4.8 times the planned version. Reducing unplanned events is the highest-leverage single intervention available — and it comes almost entirely from preventive maintenance discipline and inspection quality, not from equipment capex.
How much can preventive maintenance actually reduce mining cost per ton?
The math is compelling. Moving a fleet from a 55/45 planned-to-unplanned repair ratio to 80/20 typically saves 15–20% on total maintenance spend, because emergency repairs run roughly 4.8 times the cost of the same job done planned (accounting for expedited parts, overtime labor, secondary damage and lost production). On availability, disciplined meter-based PM commonly raises fleet availability by 4 to 7 percentage points — and every point of availability directly reduces cost per ton by spreading fixed costs over more tons. On tires, proper pressure and TKPH management can extend life by 25–40%, cutting per-ton tire cost by a similar amount. Combined across the three categories, a well-run 12-month program at a mid-tier mine can pull cost per ton down by 15–25%. On a 20-truck fleet moving 4 million tons per year, even a 20-cent reduction is over $800,000 in annual savings; a 50-cent reduction is over $2 million.
Does mining CMMS software actually pay for itself?
For any mining operation running more than a handful of haul trucks, the answer is essentially always yes — and the payback is typically fast because the savings come from three separate directions at once. First, preventive maintenance moves work from unplanned (~4.8x cost) to planned, which lands directly on the maintenance line. Second, digital inspections catch the small defects that become expensive failures, which lands on the parts, labor and downtime lines. Third, connected data on tire pressure, idle time, fuel-per-hour and availability surfaces the operational drift that a monthly variance report never explains, which lands on fuel, tires and cost per ton. Published customer data across HVI's mining and heavy-equipment fleets shows roughly ~25% lower annual maintenance cost after full deployment and a payback period around 3 months. On a fleet where a single haul truck's annual operating cost exceeds $1 million, the ROI math works even in the pessimistic case. What actually matters more than the software cost is how quickly the operation adopts the discipline — the fleets that move fast see the number shift in the first quarter; those that half-implement see partial returns.
See your fleet's cost per ton on one dashboard — per truck, per shift, per site
HVI captures every input that lands in cost per ton — digital DVIRs, work orders, PM schedules, tire records, fuel logs, availability — and rolls them into a single view your maintenance manager and general manager both use. Fleets on HVI report ~25% lower annual maintenance cost and a ~3-month payback. Configured for your mine in under two weeks.
No credit card · No hardware · Cost-per-ton dashboard ready on day one