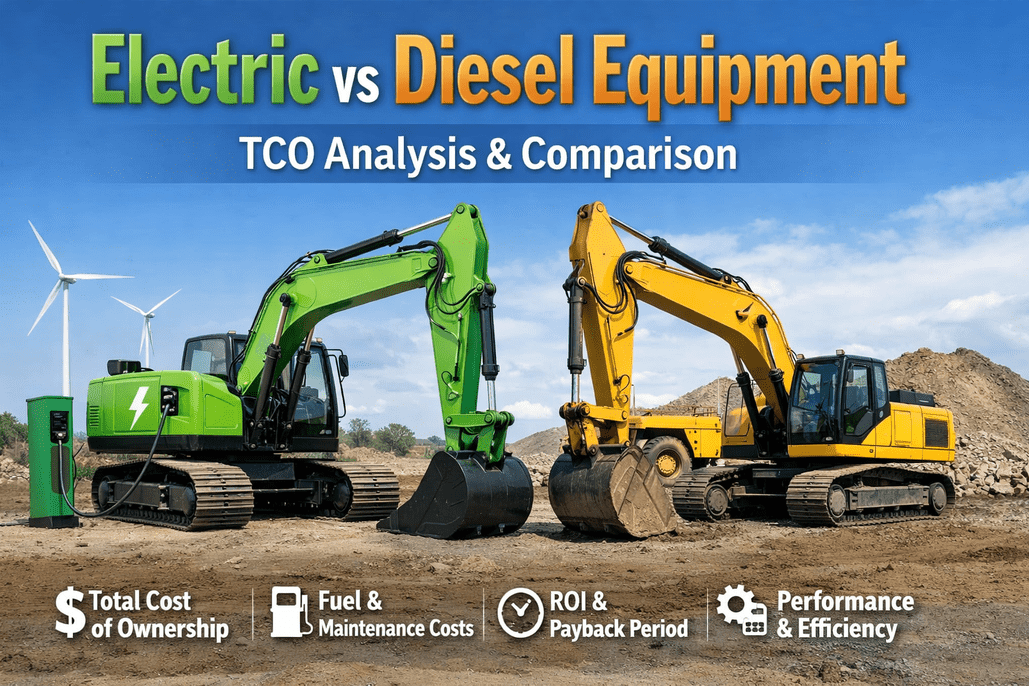
Fuel and energy are one of the largest line items in any plant that runs mobile equipment — and across a typical fleet, 6 to 15% of that spend disappears to idling, waste, and theft before it moves a single load. A forklift left idling 30 minutes a day burns over $1,000 a year in pure waste. A diesel unit costs $20–$40 a shift to run while an equivalent electric runs $2–$5. Yet most plants still track fuel on a clipboard or a fuel-card statement that arrives a month late, by which point the money is already gone. The plants that get this right don't just log gallons — they measure consumption per asset, per hour, per power source, and turn that data into utilization decisions, replacement timing, and sustainability reporting. This guide breaks down how to track fuel and energy across diesel, propane, and electric equipment, where the money actually leaks, which data points matter, and how to turn raw consumption into measurable cost reduction. book a 30-minute walkthrough to see it mapped onto your own equipment.
Your plant's fuel bill is bleeding money you can't see. Tracking exposes every drop.
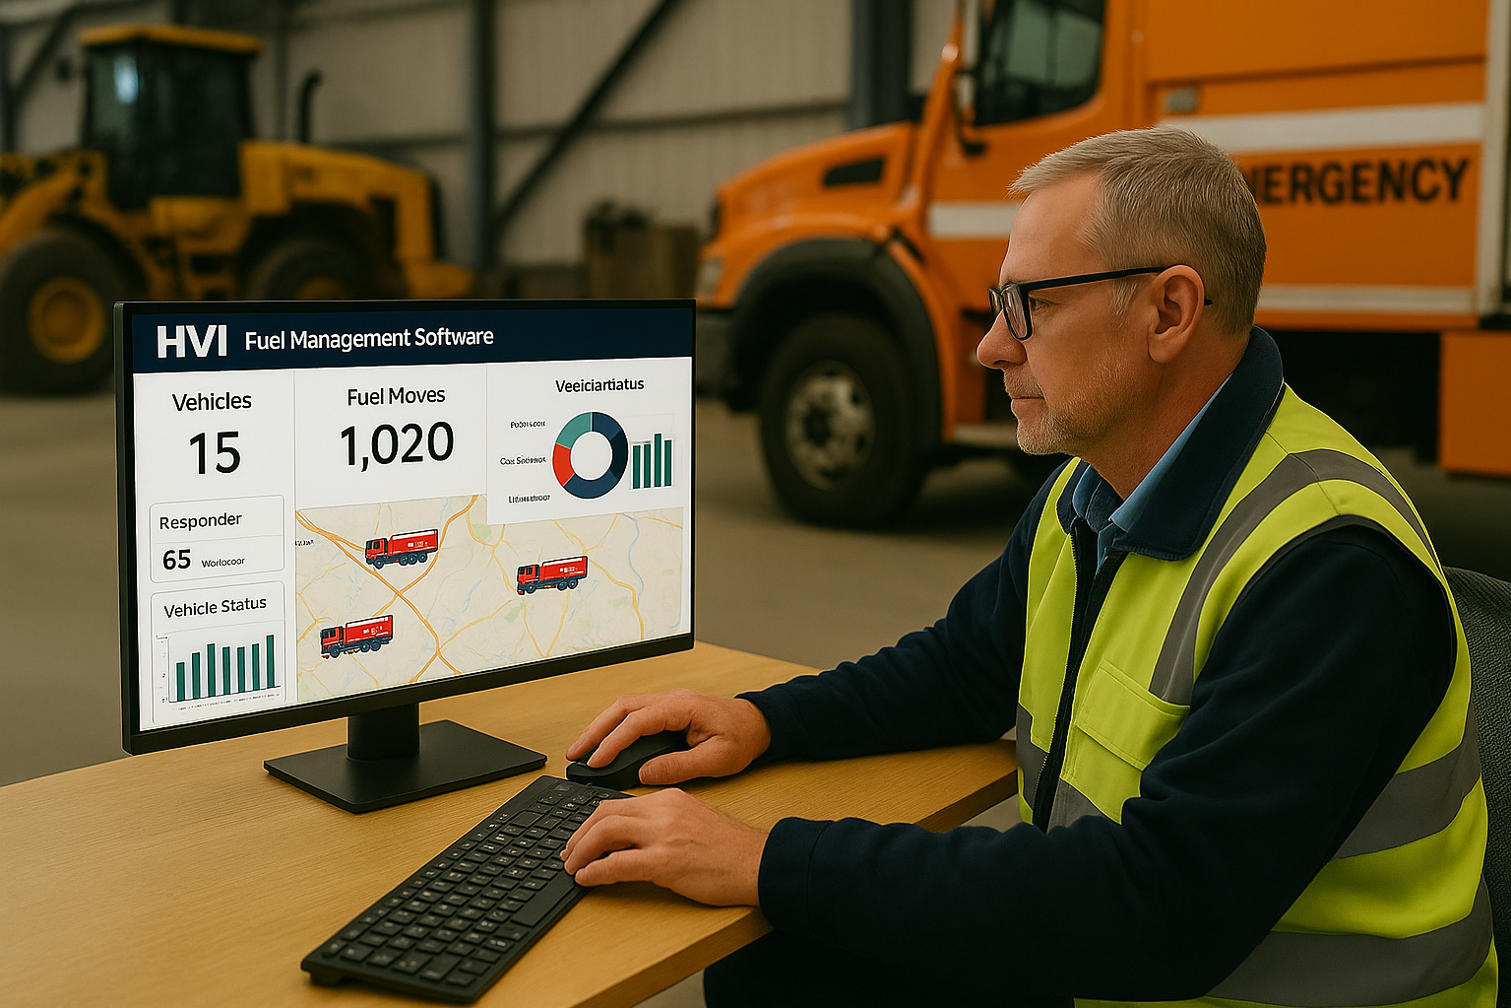
HVI tracks fuel and energy per asset across diesel, propane, and electric equipment — flagging idling, surfacing your worst-performing units, calculating cost per hour, and feeding sustainability KPIs from one dashboard. Stop guessing where the fuel goes.
The scale of the problem
Before the dashboards and the data points, look at why this matters. Fuel is rarely the line item plants scrutinize — and that's exactly why so much of it leaks unnoticed.
The core issue isn't price — it's visibility. A monthly fuel-card statement tells you what you spent, never where it went. Without per-asset, per-hour tracking, a thirsty unit, a leaking line, or an operator idling through every break looks identical to a healthy machine on the books.
Three power sources, three tracking realities
A mixed plant fleet rarely runs one fuel type. Diesel, propane, and electric each consume, cost, and report differently — and a tracking system has to speak all three languages to give you a true cost-per-hour comparison.
Diesel
~$20–$40 / shift
The workhorse for heavy outdoor lifting and off-grid use. Burns roughly 2.5–3 gallons per hour under load. Track by gallons dispensed, cost per hour, and idle time — diesel idling wastes the most.
Track: gallons · $/hr · idle %Propane (LPG)
~$20–$40 / shift
The indoor standard — clean enough to run inside, swappable in minutes. Burns ~6 lbs per hour, a tank lasting 4–8 hours. Track by cylinders consumed, tank-swap frequency, and cost per operating hour.
Track: cylinders · swaps · $/hrElectric
~$2–$5 / shift
Up to 90% cheaper per cycle and insulated from fuel-price swings. Burns ~2–2.5 kWh per hour. Track by kWh consumed, charge cycles, opportunity-charging windows, and energy cost per hour.
Track: kWh · charge cycles · $/hrA true cost-per-hour comparison across all three power sources is what tells you which units to retire and which to electrify next — and it's impossible to build from three separate paper logs. sign up free and track every fuel type in one normalized dashboard, or book a demo to see a mixed-fleet cost comparison live.
Where the money actually leaks
Fuel waste isn't one big problem — it's four smaller ones that compound. Each is invisible on a fuel-card statement and obvious the moment you track consumption per asset.
Excessive idling
Equipment running while stationary burns fuel for nothing. The most efficient fleets idle 20% less than their peers — idle-reduction programs alone recover 4–8% of total fuel spend.
Theft & unaccounted draw
Fuel that never reaches the equipment. Matching every dispense to a specific asset and time closes the gap between what was bought and what was burned.
Poor maintenance
A clogged filter, a misfire, or a degrading engine quietly destroys efficiency. Linking fuel data to equipment health flags a thirsty unit before it becomes a repair bill.
Underutilized assets
A unit barely used still costs to fuel, insure, and maintain. Utilization data tied to consumption reveals which machines to redeploy, right-size, or sell.
Each leak hides behind the others on a monthly statement. Tracked per asset and per hour, they separate cleanly — and HVI flags each one as it happens, with idle alerts, dispense-to-asset matching, and fuel-to-health correlation built in.
The data points worth tracking
Logging gallons is not tracking. A real system captures the data points that turn consumption into decisions — these are the ones that move cost.
Most plants capture maybe one of these — gallons — and miss the four that actually drive decisions. sign up free and capture every data point per asset automatically, no clipboard required.
From fuel data to sustainability KPIs
Energy tracking isn't only a cost play anymore — it's how plants prove emissions progress to customers, regulators, and corporate ESG targets. The same per-asset data does both jobs.
Emissions per asset
Convert fuel and energy use into CO₂ per unit and per hour, so reductions are measured, documented, and defensible — not estimated once a year.
Electrification roadmap
Per-hour cost and emissions data tells you exactly which diesel or propane units to electrify first for the biggest payback — and quantifies the saving before you buy.
Regulatory readiness
With IC-equipment phase-outs and Low-Emission Zones expanding, documented energy data turns looming compliance from a scramble into a planned transition.
A diesel-to-electric forklift transition has delivered plants $700,000+ in annual savings on a 30-unit fleet — but only the plants tracking per-asset cost and emissions could prove the case and time the switch. HVI captures both from the start.
Clipboard tracking vs. HVI
Both technically record fuel. Only one ties every gallon and kilowatt-hour to a specific asset, flags waste as it happens, and turns the data into decisions instead of a month-old statement.
Clipboard / fuel-card only
- Spend known a month late, by asset never
- Idling invisible until the fuel bill spikes
- Diesel, propane & electric logged in separate places
- Theft and unaccounted draw blend into "normal" use
- No cost-per-hour to compare units or power sources
- Emissions estimated once a year for reporting
With HVI software
- Every dispense tied to a specific asset and time
- Real-time idle alerts surface waste instantly
- Diesel, propane & electric normalized in one dashboard
- Dispense-to-asset matching exposes the leak
- Cost per hour calculated for every unit and fuel type
- CO₂ per asset tracked continuously for ESG reporting
recovered per year on a typical 25-asset fleet — through idle reduction, theft prevention, and right-sizing combined. Most operations reach full ROI within 90 days, and visibility alone cuts consumption 10–15%. HVI turns your single biggest variable cost into your biggest savings opportunity, per asset, in real time.
Frequently asked questions
How do you track fuel consumption across different equipment types?
The key is normalizing everything to a common unit — cost and energy per operating hour — so diesel, propane, and electric equipment can be compared on the same scale. For diesel you track gallons dispensed and idle time; for propane, cylinders consumed and tank-swap frequency; for electric, kWh drawn and charge cycles. Each is then divided by operating hours to produce a true cost-per-hour figure. That's what lets you see that an electric unit running at $2–$5 a shift is dramatically cheaper than a diesel at $20–$40, and decide which units to retire or electrify. HVI's inspection and maintenance software captures all three fuel types per asset and normalizes them automatically, so you're comparing real numbers instead of three incompatible paper logs. sign up free and see every asset on one cost-per-hour dashboard.
Where does most plant fuel waste actually come from?
Four sources, and they compound. Excessive idling is usually the biggest and the cheapest to fix — equipment burning fuel while stationary, where idle-reduction alone recovers 4–8% of total fuel spend. Theft and unaccounted draw account for another 6–15% of spend, fuel that's purchased but never reaches a tracked machine. Poor maintenance — a clogged filter or a degrading engine — silently erodes efficiency by 5–15%. And underutilized assets keep costing money to fuel and maintain while barely working. None of these show up on a monthly fuel-card statement; they only separate out when consumption is tracked per asset and per hour. HVI's software flags each one in real time with idle alerts, dispense-to-asset matching, and fuel-to-health correlation.
Is it worth switching plant equipment from diesel or propane to electric?
Often yes, but the only way to know for your plant is to track per-asset cost and emissions first. Electricity typically costs 60–80% less than diesel per operating cycle, maintenance runs 50–70% lower with fewer moving parts, and electric units are insulated from fuel-price volatility and tightening emissions regulations. One manufacturing plant that switched 30 diesel forklifts to electric documented over $700,000 in annual savings. But the upfront price gap is real, so the smart move is to use cost-per-hour and utilization data to identify which specific units have the biggest payback and electrify those first. HVI's inspection and maintenance software gives you exactly that data, so the electrification case is quantified before you spend. book a demo to model your fleet's electrification savings.
What metrics should a plant track for equipment energy management?
Five data points turn raw consumption into decisions. Fuel or energy per asset isolates your thirstiest units. Cost per operating hour is the single number that compares diesel, propane, and electric fairly. Idle time and idle percentage surface the fastest, behavior-based savings. Utilization rate reveals over- and under-used machines for right-sizing the fleet. And CO₂ or emissions per unit feeds sustainability reporting and Low-Emission-Zone planning. Most plants capture only the first — gallons — and miss the four that actually drive cost and compliance decisions. HVI's software captures all five per asset automatically, so the data is ready when a budget review or an ESG report needs it. sign up free and start capturing every metric today.
How does HVI help track plant fuel and energy?
HVI is an inspection and maintenance software platform that runs fuel and energy tracking alongside equipment health in one place. It records consumption per asset across diesel, propane, and electric equipment, normalizes everything to cost and energy per operating hour, and flags waste in real time — idle alerts when equipment runs stationary, dispense-to-asset matching to expose theft and unaccounted draw, and fuel-to-health correlation that ties a drop in efficiency to a specific maintenance issue. It tracks utilization to surface under-used machines, calculates CO₂ per asset for sustainability reporting, and keeps it all in the same dashboard as your inspections and work orders, so a thirsty unit becomes a work order automatically. Most plants recover $40,000–$75,000 a year on a 25-asset fleet and reach full ROI within 90 days. book a demo and we'll map the software onto your equipment on the call.
Stop guessing where the fuel goes. Track every drop and every kilowatt-hour.
HVI tracks fuel and energy per asset across diesel, propane, and electric equipment, flags idling and theft in real time, calculates cost per hour for fair comparison, surfaces under-used machines, and feeds your sustainability KPIs — all in one platform with your inspections and maintenance. Recover the 6–15% you're losing and turn your biggest cost into your biggest saving.
No credit card required · Live in under two weeks · Multi-fuel tracking + idle alerts + cost-per-hour + sustainability KPIs in one platform