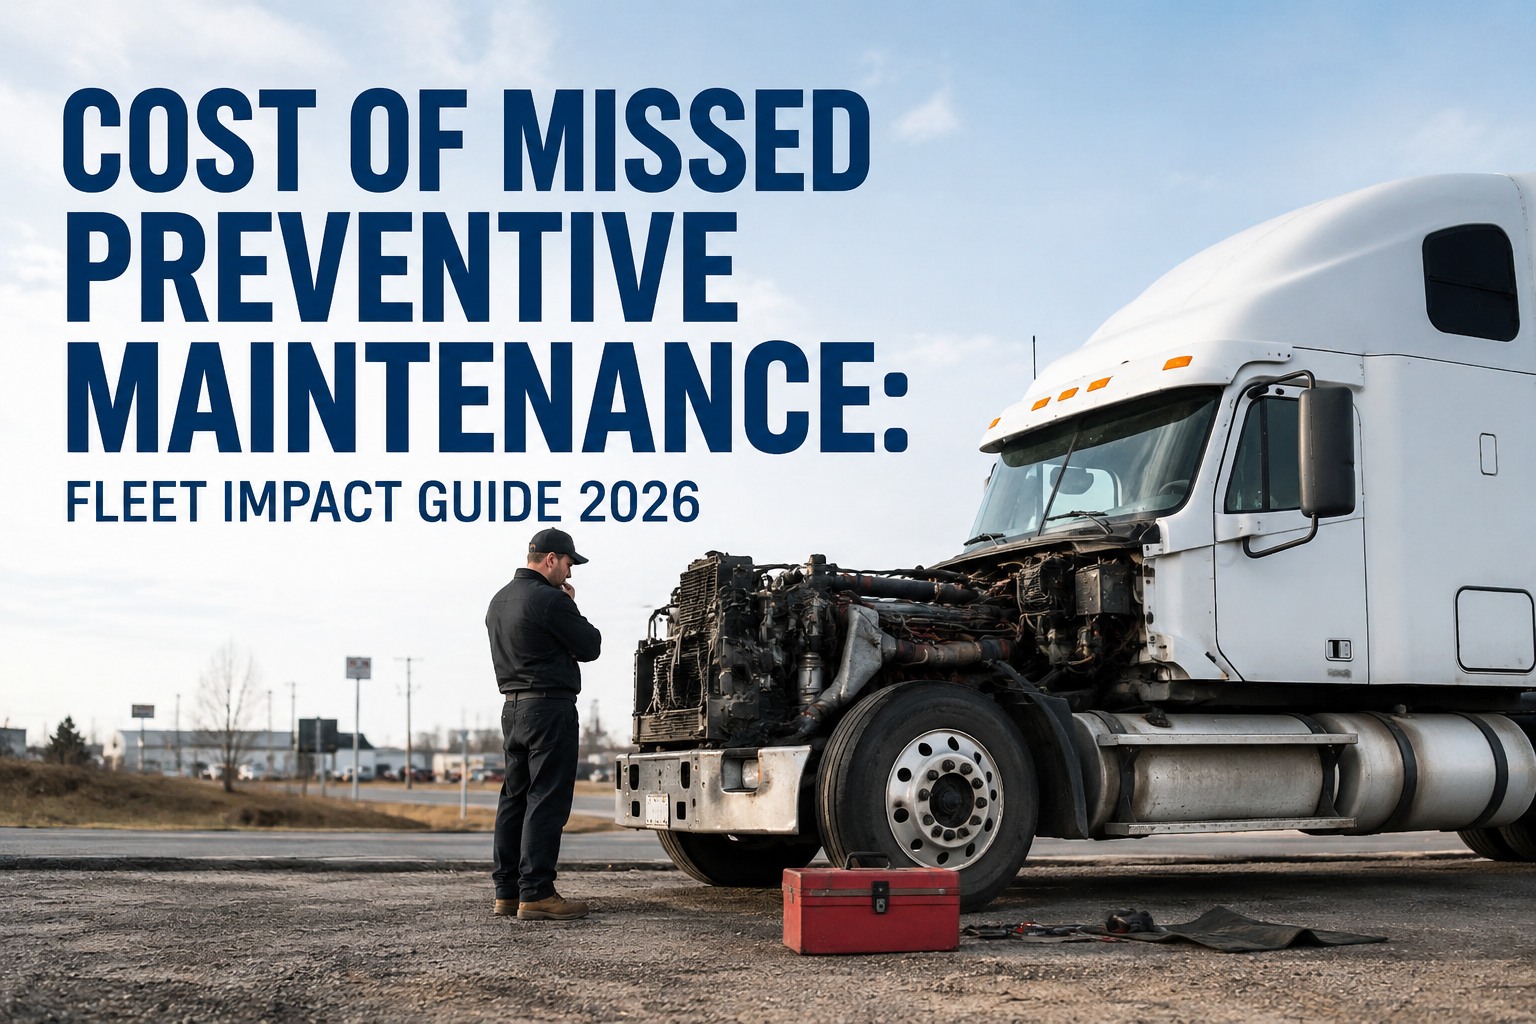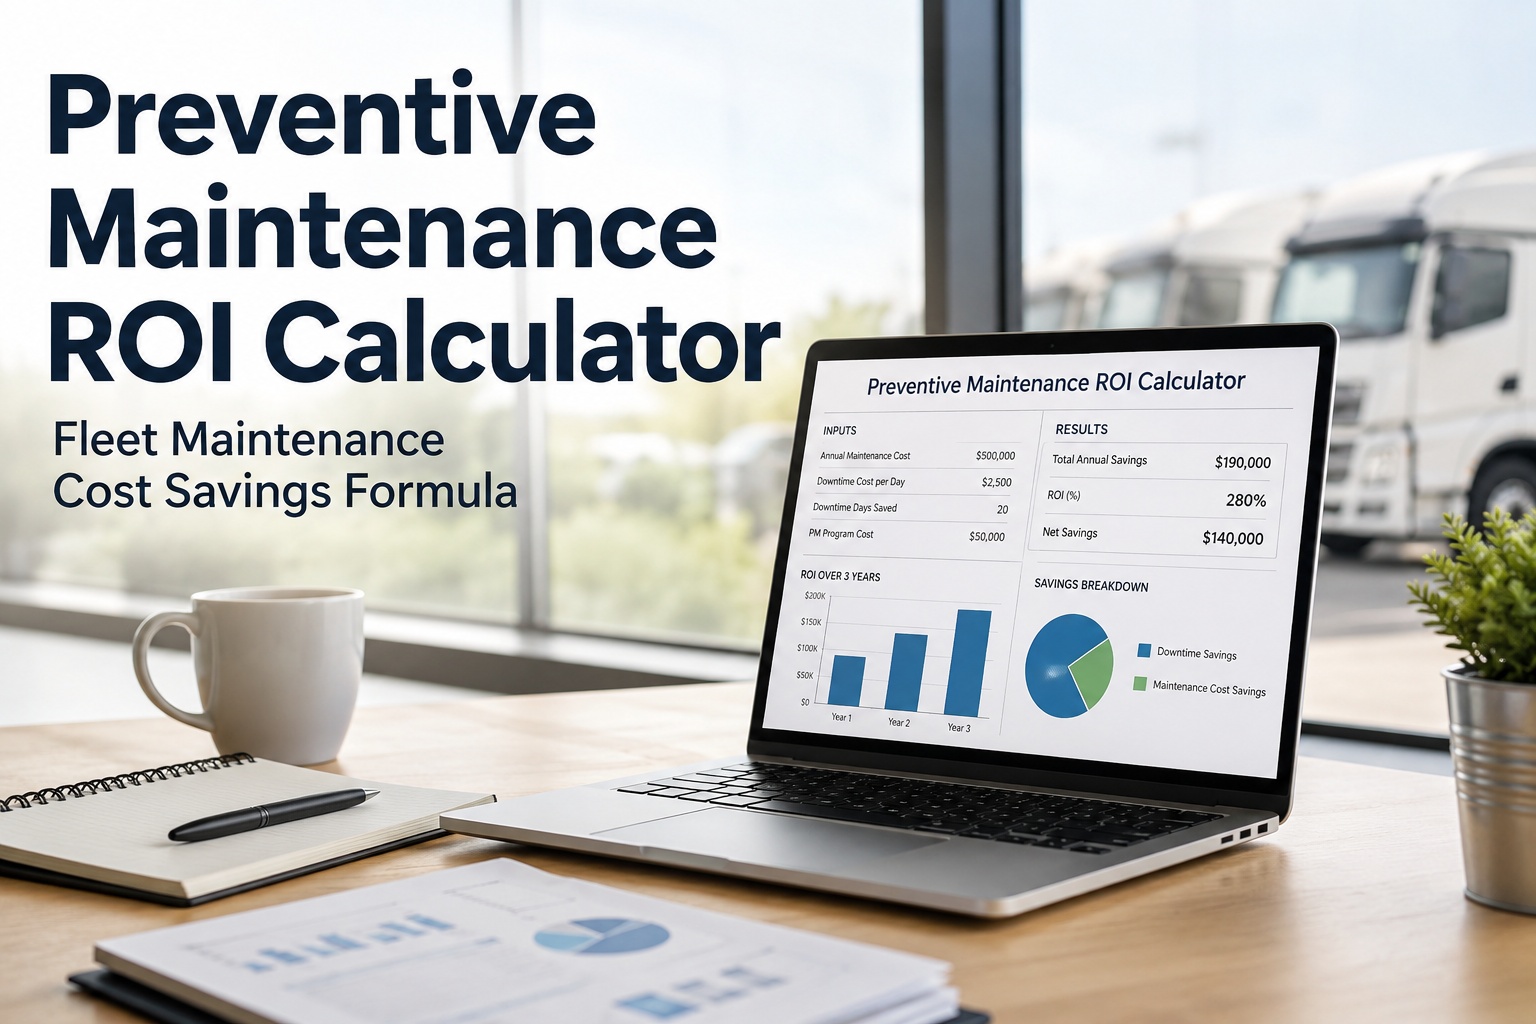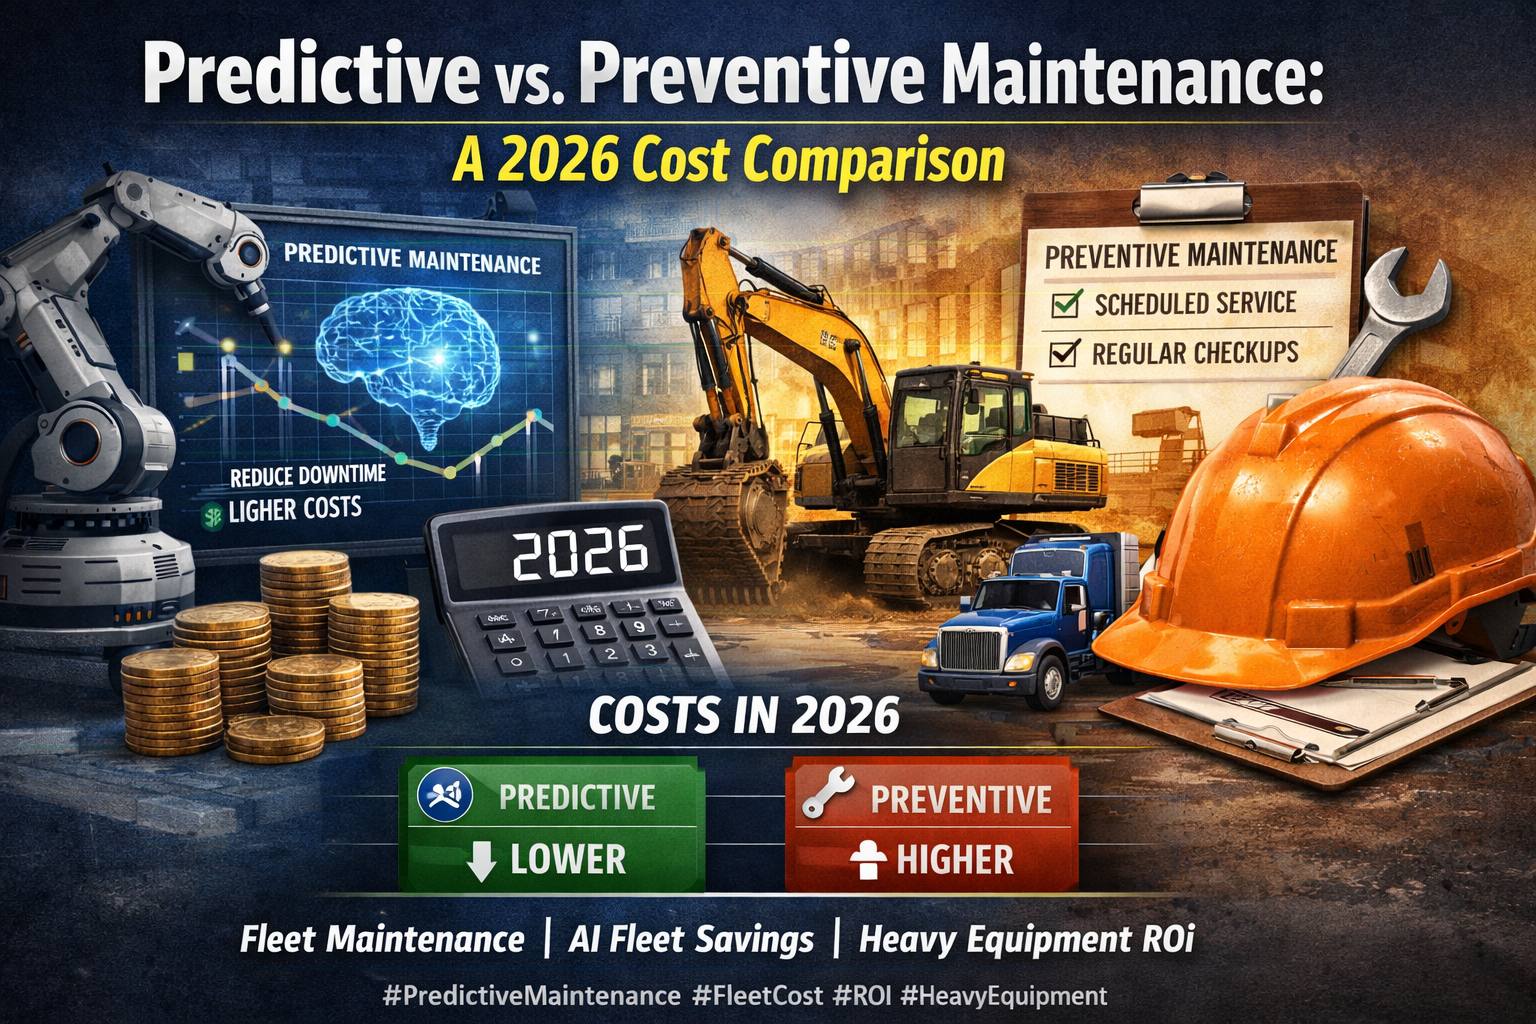
Choosing between predictive vs preventive vs reactive maintenance is the biggest strategic decision a fleet or plant maintenance director will make this year. The wrong answer inflates costs by 25-40%, and getting it exactly right isn't about picking one approach — it's about knowing which mix belongs on which asset. This guide breaks down what each strategy actually costs, where each one earns its keep, and how the best-performing fleets run all three at once. Book an HVI demo → to build the mix.
Three maintenance strategies. Three completely different cost structures. One right mix for your fleet.
Reactive fleets pay 3-5x per failure but zero upfront. Preventive fleets pay upfront to prevent 70% of failures. Predictive fleets use data to catch what preventive misses. Here's what each one actually looks like at scale.
are PM-preventable
pure reactive strategy
PM meets predictive data
Predictive vs preventive vs reactive maintenance — the head-to-head
The three strategies compete on a small number of axes that determine which one belongs on which asset. Cost per event, uptime achievable, data requirements, and where the strategy fits best on a real fleet. This table is the CFO version of the answer.
The table settles most arguments but not all of them. The real decision is which strategy to run on which asset — and that depends on the failure consequence, replacement cost, and whether the asset generates enough data to make prediction cost-effective. Below, each strategy on its own terms. Book an HVI demo to see the strategy mix applied to a real fleet.
Reactive maintenance — when running to failure is actually the right call
Reactive maintenance has a bad reputation because most operations running it are running it by default, not by design. Done deliberately, on the right components, it's actually the cheapest strategy. The trick is knowing where to deploy it.
The math is unforgiving. A reactive brake failure that shuts a truck down on the shoulder costs the labor, the parts, the towing, the rescheduled load, and the CSA violation. A preventive brake service caught during a scheduled inspection costs the labor and the parts. Same brake, same technician, same shop — the timing changes the cost by 3-5x. Try HVI free to move reactive-by-default components onto a real PM schedule.
Preventive maintenance — the baseline every serious fleet operates on
Preventive maintenance is the workhorse strategy. It doesn't optimize the way predictive does and it doesn't have the zero-planning-cost of reactive, but it catches roughly 70% of unplanned failures on typical fleet assets and forms the scheduling backbone that other strategies build on top of. Every disciplined operation runs preventive maintenance as the default and layers predictive on top of it for critical assets.
The right PM program combines all four. Time-based catches age failures. Meter-based catches usage failures. Failure-mode catches component-specific patterns. Regulatory catches everything the government cares about. A fleet running just one type is running an incomplete program. Book an HVI demo to see how the four PM types layer into a single dashboard.
Predictive maintenance — where it works and where it's just expensive theater
Predictive maintenance is the most-hyped and most-misunderstood of the three strategies. Done right on the right assets, it produces 10-25% additional savings beyond a solid preventive program. Done wrong, it's expensive sensor infrastructure producing dashboards nobody reads. The question isn't whether to add predictive — it's where.
The realistic predictive strategy for most fleets in 2026: layer it on top of preventive for the top 20% of assets by cost or criticality. Class 8 engines, transmissions, hydraulic systems on heavy equipment, and BEV battery packs are the standard starting list. Everything else stays on meter-based preventive maintenance until the data proves otherwise. Book an HVI demo to see which of your assets qualify for predictive layering.
The 60/30/10 hybrid — how top-performing fleets actually run
The best-performing fleets aren't purely predictive, purely preventive, or purely reactive. They run all three at once, on a specific asset-mix basis. The rough industry split for well-managed operations:
The 60/30/10 split isn't a target; it's a description of what emerges naturally when a fleet makes rational strategy decisions asset by asset. What matters isn't hitting these exact percentages — it's building a program where each strategy runs on the assets it fits best. The dashboard shouldn't tell you "we're 60% preventive" as a goal; it should tell you "we're preventive on the right assets and reactive on the right ones." Try HVI free to build the mix.
From a reliability engineer at a 340-unit mining fleet
We spent 18 months trying to go from pure reactive to pure predictive because a consulting firm sold us on the ROI. We installed vibration sensors on 340 haul trucks and dozers. The dashboards were beautiful. The maintenance costs went up 22%.
Rebuilt the program in HVI last year around the 60/30/10 principle. Preventive on the fleet baseline, predictive on the top-value engine and transmission components only, deliberate reactive on cheap consumables. Twelve months later: maintenance cost per operating hour dropped 31% from the reactive-only baseline, unplanned downtime dropped 44%, and the sensor infrastructure investment finally started paying back on the assets where it actually made sense.
EKElena K.Reliability Engineer · Regional mining operation · 340 haul trucks, dozers, and loaders
Frequently asked questions
What is the difference between predictive, preventive, and reactive maintenance?
Reactive maintenance waits for equipment to fail before servicing it — also called "run-to-failure" or "break-fix." Cost per event runs 3-5x higher than planned service, but planning cost is zero. Preventive maintenance schedules service at defined intervals (time, meter, or usage) regardless of asset condition — the disciplined baseline every serious fleet operates on. Catches roughly 70% of unplanned failures. Predictive maintenance uses sensor data, oil analysis, telematics, or vibration monitoring to service assets only when the data indicates deterioration. Highest ROI on high-value critical assets; not cost-effective on cheap consumables. Best-run fleets combine all three: preventive as the baseline, predictive layered on top-value assets, and deliberate reactive on cheap, easily-replaced components.
Is predictive maintenance always better than preventive maintenance?
No. Predictive maintenance is better than preventive on the top 20% of assets by cost or criticality — Class 8 engines, transmissions, high-value hydraulics, battery-electric truck packs. On the other 80% (mid-value components, standard wear items, calendar-based service), preventive maintenance is either equivalent or superior once you account for sensor infrastructure cost. Fleets that try to go fully predictive typically see costs rise for the first 12-18 months because sensor infrastructure and data infrastructure investment outruns the failure-prevention benefit on low-value assets. The right frame isn't "predictive vs preventive" as a binary; it's "which strategy fits which asset." Preventive as the baseline, predictive as the layer on top for high-value assets, is the pattern most top-performing operations converge on.
How much can predictive maintenance save vs preventive maintenance?
On assets where predictive is a genuine fit, layering it on top of a solid preventive program produces 10-25% additional savings versus preventive alone. The savings come from three sources: extending service intervals when data shows the component isn't due (rather than servicing on rigid calendar), catching developing failures before they cascade into secondary damage, and reducing unnecessary parts replacement on components still within healthy operating parameters. Note the framing: predictive maintenance savings are measured versus a well-run preventive program, not versus reactive. A fleet moving from pure reactive to preventive typically saves 25-40% first. A fleet then adding predictive to the top 20% of assets typically saves another 10-25% on those specific assets. The two savings compound rather than duplicate.
When is reactive maintenance actually the right choice?
Reactive maintenance is the correct strategy for cheap, easily-replaced components where the cost of scheduled service exceeds the failure cost. Light bulbs, small fasteners, filters under $30, redundant secondary components (spare tires, backup generators), and equipment scheduled for imminent replacement all belong on deliberate reactive strategy. The rule of thumb: if replacement cost is under $500 and failure doesn't cascade into safety, compliance, or downtime consequences, reactive is often the cheapest strategy. The problem isn't reactive maintenance itself — it's reactive maintenance by default. Every fleet has some components that should run reactive; the mistake is running everything reactive because the PM program was never built.
How do fleets transition from reactive to preventive maintenance?
The transition from reactive-by-default to disciplined preventive typically takes 90-180 days and follows a specific sequence. First: inventory every asset and identify OEM-recommended service intervals for each. Second: build meter-based and calendar-based PM triggers into a CMMS or dashboard that reminds technicians automatically (paper schedules fail at scale). Third: capture every completed service with photos, technician sign-off, and parts detail so the maintenance history becomes an auditable asset trail. Fourth: measure PM Compliance Rate (services completed on time divided by services due) monthly and target 92%+ within six months. Fleets that follow this sequence typically see unplanned downtime drop 40-60% within the first two quarters, maintenance cost per mile drop 15-25% within a year, and CSA Vehicle Maintenance BASIC improve by 20+ percentile points.
Build a smarter maintenance program — the mix that actually cuts your operating cost.
HVI ships with pre-built PM templates by asset type, meter-based and calendar-based triggers, and photo-verified service records that become the training data for predictive analytics. The 60/30/10 mix, built asset by asset, on one platform. Live for your fleet in 5-7 days.
PM templates · Meter triggers · Photo evidence · Predictive-ready data · SOC 2 Type II