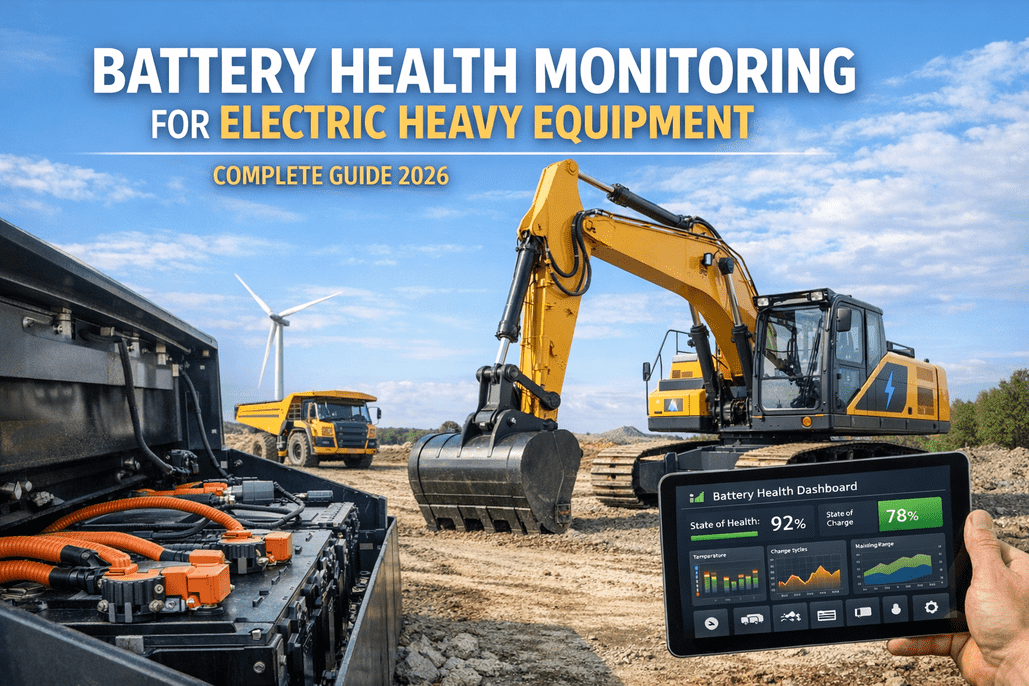
The battery pack is the single most expensive component in any electric heavy equipment — representing 30-40% of total asset value and costing $45,000 to $150,000+ to replace on a 20-30 tonne machine. Unlike diesel engines that degrade gradually with visible symptoms (oil consumption, blow-by, reduced power), battery degradation is invisible until range drops below operational thresholds or the Battery Management System (BMS) flags a cell-level fault. By that point, the damage is already done. Battery health monitoring transforms this from a guessing game into a data-driven management discipline: tracking State of Health (SoH) trends, identifying the specific operator behaviors and charging patterns accelerating degradation, predicting replacement timing, and integrating battery data into your maintenance management system so every charge cycle, every thermal event, and every capacity measurement feeds the same platform that tracks your work orders and PM schedules. The 2025 Geotab study of 22,700 electric vehicles confirmed modern batteries average 2.3% capacity loss per year — projecting to 81.6% SoH after eight years. But that average masks enormous variation: fleets using primarily high-power DC fast charging see 3%+ annual degradation, while fleets managing charging strategically experience under 1.5%. The difference between those two paths is roughly $50,000-$100,000 per machine in battery replacement timing over a 10-year lifecycle. This guide covers the metrics that matter, the degradation factors specific to heavy equipment duty cycles, charge optimization protocols, thermal management for harsh environments, replacement decision frameworks, and Book a demo. Or start free to see how HVI integrates battery health monitoring into your fleet maintenance operations.
The Battery Dashboard: Metrics That Matter
Battery health monitoring starts with six core metrics that every fleet manager must track. These metrics form the dashboard that tells you whether each battery is healthy, degrading normally, or headed for early failure.
State of Health
Current usable capacity as a percentage of original. 100% = new battery. Most OEM warranties cover to 70-80%.
Track: Monthly trend. >3% annual decline = investigate charging patterns. <80% = plan replacement timeline. <70% = immediate replacement or second-life assessment.
State of Charge
Current charge level as percentage. Not a health metric itself — but SoC patterns directly affect health. Daily SoC range is the most controllable degradation factor.
Target: Daily operating range 20-80%. Charge to 100% only when full capacity is operationally required. Avoid routine depletion below 10%.
Cell Imbalance
Voltage difference between highest and lowest cells in the pack. Healthy: <50mV. Concerning: 50-100mV. Critical: >100mV.
Monitor: Growing imbalance indicates one or more cells degrading faster — reducing usable pack capacity. May require BMS recalibration or module replacement.
Charge Cycles
Total equivalent full charge-discharge cycles. LFP chemistry: 3,000-5,000+ cycles. NMC chemistry: 1,500-3,000 cycles. Actual life depends on depth of discharge per cycle.
Compare: Actual SoH vs. expected SoH at current cycle count. Faster-than-expected degradation = identify root cause (thermal, charging, depth-of-discharge).
Internal Resistance
Resistance increases as cells age — reducing power delivery and increasing heat generation during high-demand operations. Direct indicator of electrochemical degradation.
Trend: Resistance rising faster than capacity decline suggests lithium plating or electrolyte decomposition. Correlate with fast-charging frequency and cold-weather operation.
Peak Temperature
Maximum temperature recorded during operation and charging. Optimal range: 15-35°C. Above 35°C accelerates degradation. Below 0°C risks lithium plating during charging.
Alert: >40°C sustained = check cooling system. >50°C = immediate investigation. Cold-weather charging below 0°C should trigger pre-conditioning protocol.
HVI tracks SoH trends, charge patterns, thermal events, and degradation rates for every electric asset — alerting you to the behaviors costing battery life before they cost battery replacement.
Book a demo. Or
start free.
Degradation Factors: What Kills Heavy Equipment Batteries
Heavy equipment duty cycles are far more demanding than on-road vehicles — deeper discharges, higher ambient temperatures, more vibration, and longer continuous operation. These factors interact multiplicatively: high-power charging in hot weather causes more damage than either factor alone. Understanding which factors you can control is the key to extending battery life.
High-Power DC Fast Charging
HIGH
Dominant stressor per Geotab 2025 data. Vehicles relying heavily on DCFC above 100 kW degrade at ~3.0%/year vs. 1.5% for Level 2 AC charging. DCFC generates heat at the cell level that thermal management cannot fully dissipate.
Controllable. Use Level 2 AC as daily default for depot/overnight charging. Reserve DCFC for operational necessity. On construction sites, schedule Level 2 charging during shift breaks when feasible.
Deep Discharge Cycles
HIGH
Regularly draining to <10% SoC stresses cell chemistry and accelerates capacity loss. Heavy equipment often runs continuous shifts, tempting operators to drain batteries before recharging. Each deep cycle causes more degradation than two shallow cycles of the same total energy.
Controllable. Set operational SoC floor at 20%. Train operators: recharge during breaks, not when empty. Opportunity charging (top-ups during idle periods) extends pack life significantly.
Thermal Exposure
MEDIUM
Hot climates add ~0.4% additional annual degradation. Construction sites expose machines to direct sunlight, high ambient temperatures, and heat-radiating surfaces. Operating above 35°C accelerates chemical reactions that reduce capacity — and above 45°C can halve lifespan vs. 25°C baseline.
Partially controllable. Park in shade during idle. Ensure cooling system maintenance. Monitor coolant levels and flow rates. Avoid charging immediately after high-temperature operation — let batteries cool first.
Vibration & Mechanical Stress
MEDIUM
Construction equipment experiences vibration levels far exceeding on-road vehicles — breaker operations, rough terrain, loading impacts. Vibration stresses cell interconnections, can cause micro-fractures in electrode coatings, and accelerates cell imbalance in large packs.
Limited control. Monitor cell balance trends for vibration-related damage patterns. Inspect battery enclosure mounting hardware during PM intervals. OEM-specific vibration dampening varies significantly — factor into procurement.
Calendar Aging
LOW
Batteries degrade even when not in use — approximately 1-2% per year from chemical processes that occur regardless of cycling. Higher storage temperature accelerates calendar aging. Storing at high SoC (90%+) accelerates it further.
Partially controllable. For seasonal equipment, store at 40-60% SoC in temperature-controlled environment. Avoid storing at 100% or <10% for extended periods. Check SoH before and after storage to track calendar loss.
Cold-Weather Charging
MEDIUM
Charging below 0°C causes lithium plating — metallic lithium deposits on the anode that permanently reduce capacity and increase short-circuit risk. Most BMS systems limit charging rate in cold conditions, but some older systems may not adequately protect.
Controllable. Enable battery pre-conditioning before charging in cold conditions. Modern equipment with thermal management systems heat the pack to safe charging temperature automatically. Verify this function is working during winter PM inspections.
Charge Cycle Optimization: The Protocols That Extend Life
How you charge your electric heavy equipment is the single most impactful decision for battery longevity. These protocols translate the degradation science into daily operational rules.
Daily Charging Protocol
Default charge limit: 80%
Charging above 80% SoC stresses cell chemistry at high voltage. Set charger default to 80%. Override to 100% only when next shift requires full range (heavy load, long distance, full-day operation without charging access).
Operational floor: 20% SoC
Depletion below 20% stresses cells at low voltage. Train operators: "20% is empty." Schedule opportunity charging during breaks rather than running to minimum.
Level 2 AC as daily default
AC charging (7-19 kW) generates far less heat than DCFC. For overnight depot charging or shift-break charging, Level 2 is ideal — lowest cost, lowest stress, longest battery life.
DCFC only when operationally required
Reserve DC fast charging (>50 kW) for situations where turnaround time requires it. Track DCFC frequency per machine — more than 3x per month in hot climates shows measurably higher degradation (Geotab data).
Construction Site Charging Strategy
Opportunity charging during idle windows
Brief top-ups during lunch breaks, operator changes, or waiting periods are better for battery health than one deep discharge followed by one full charge. Shallow cycles cause less degradation per kWh delivered.
Cool-down before charging after heavy use
After sustained high-demand operation (continuous digging, material handling), battery temperature may be elevated. Allow 15-30 minutes cool-down before initiating charge — especially fast charge. Hot-battery charging multiplies thermal stress.
Pre-condition in cold weather before charging
Below 5°C, activate battery pre-conditioning (thermal management system heats pack to safe charging temperature) before plugging in. Charging a cold battery — even at low power — risks lithium plating.
Track charging source per machine
Log whether each charge event was Level 2 or DCFC, duration, and starting/ending SoC. This data feeds degradation analysis — showing which machines get the most DCFC and correlating with their SoH trends.
HVI logs every charge event — source type, duration, starting and ending SoC, temperature — and correlates with SoH trends to identify the specific behaviors accelerating degradation in your fleet.
Book a demo. Or
start free.
Replace vs. Recondition: The Decision Framework
At some point, every battery reaches the threshold where capacity no longer supports operational requirements. The question is whether to replace with a new pack, recondition (replace degraded modules within the pack), or retire the battery to a second-life application. This decision framework uses your battery health data to make the call objectively.
SoH 80-100%
Healthy — Monitor Only
Normal operation. Track monthly SoH trend and compare against expected degradation curve. No intervention needed. Focus on charging protocol compliance to maintain healthy trajectory.
SoH 70-80%
Approaching Threshold — Plan Ahead
Capacity reduction becoming noticeable — shorter runtime per charge. Evaluate whether reduced capacity still meets operational requirements (may be acceptable for lighter-duty assignments). Begin budgeting for replacement. Check cell balance — if specific modules are degrading faster, module-level replacement may restore capacity at lower cost than full pack replacement. Assess OEM warranty coverage.
SoH 60-70%
Below Warranty — Evaluate Options
Most OEM warranties trigger at 70% SoH. File warranty claim if eligible. If out of warranty: compare module-level reconditioning cost vs. full pack replacement. Reconditioning (replacing 2-4 degraded modules) may cost 30-50% of full replacement. Machine may be reassigned to lower-demand duty (material handling vs. continuous excavation) while replacement is planned.
SoH <60%
Replace — Assess Second-Life
Capacity no longer supports productive operation. Full pack replacement required. Retired battery may have second-life value as stationary energy storage (construction site solar storage, grid services, backup power) — SoH 40-60% is viable for stationary applications. EU Battery Passport regulation (effective 2027) will require SoH documentation for second-life assessments.
Battery Replacement Cost Context
$300/kWh
Current heavy equipment battery pack pricing (2025-2026), down from ~$500/kWh a few years ago. A 300 kWh pack for a 20-25 tonne excavator costs approximately $90,000.
30-40%
Battery percentage of total electric machine value. The pack is the single largest cost component — making lifecycle management critical to total cost of ownership.
$8,600/yr
Fuel cost savings per machine (30-tonne electric excavator vs. diesel equivalent, per IDTechEx analysis). Accumulated over 10+ years, these savings offset battery replacement cost.
50%
Maintenance cost reduction for electric vs. diesel heavy equipment — no oil changes, no DPF/DEF, no transmission service, fewer brake replacements (regenerative braking). Redirects budget toward battery health management.
CMMS Integration: Battery Data in Your Maintenance Platform
Battery health monitoring only delivers value when it connects to your maintenance management system — the same platform that handles inspections, work orders, PM scheduling, and cost tracking. Isolated battery dashboards create data silos. Integrated battery monitoring triggers maintenance actions automatically.
SoH trend data
Asset lifecycle planning. SoH projections feed replacement timing and capital budget forecasting. PM schedules adjust — lower-SoH machines get shorter inspection intervals for cooling system and cell balance checks.
Charge event logs
Operator behavior analysis. Identify machines with excessive DCFC frequency, routine deep discharge, or hot-battery charging. Generate operator coaching reports. Track compliance with charging protocols.
Thermal event alerts
Auto-generated work orders. Temperature exceeding threshold triggers WO for cooling system inspection — check coolant level, flow rate, radiator/condenser condition, and thermal interface material integrity.
Cell imbalance flags
Diagnostic work order with specific module identification. Technician receives WO with imbalance data, cell-level voltage readings, and recommended action (BMS recalibration vs. module replacement).
Cycle count tracking
Warranty management. Auto-calculate remaining warranty based on cycle count, calendar time, and SoH. Alert fleet manager when approaching warranty expiration with current SoH — triggering warranty claim if below threshold.
Replacement cost projections
Capital planning dashboard. Project replacement timing and cost per machine based on current degradation trajectory. Roll up across fleet for annual capital expenditure forecasting. Compare replace-vs-recondition economics.
Electric Heavy Equipment Market Growing 20.7% CAGR
The electric construction equipment market reached $14.5 billion in 2024 and is projected to hit $29 billion by 2029. Every major OEM — Volvo, Caterpillar, Komatsu, JCB, Hitachi, Hyundai — is shipping battery-electric machines. Battery health monitoring becomes essential at fleet scale.
Fast Charging Is Spreading — and So Is Its Impact
Komatsu and Dimaag's Mobile Megawatt Charging System (MWCS) brings fast charging to job sites. Convenient — but Geotab's 2025 data confirms DCFC above 100 kW doubles degradation rates vs. Level 2. Fleet charging policies that balance turnaround speed and battery life are now operationally critical.
Book a demo.
EU Battery Passport Regulation Coming 2027
The EU Battery Passport will require digital documentation of battery SoH, charge history, and lifecycle data for batteries above 2 kWh. Fleets operating in or exporting to European markets need battery health data infrastructure now — HVI provides the monitoring and documentation framework.
Second-Life Markets Creating End-of-Service-Life Value
Batteries retired from heavy equipment at 60-70% SoH retain significant value for stationary energy storage applications. Documented SoH history (charge cycles, thermal events, degradation curve) directly affects resale value. Fleets tracking battery health recover residual value that offsets replacement cost.
Battery Health Is Fleet Wealth
Every charge event, every thermal cycle, every deep discharge either extends or shortens the life of your most expensive component. The fleets that will win the electric heavy equipment transition aren't just the ones buying electric machines — they're the ones managing battery health with the same rigor they apply to diesel PM schedules. SoH tracking, charge protocol enforcement, thermal monitoring, and replacement planning integrated into your maintenance management system transforms battery management from an uncertain cost into a predictable lifecycle strategy. HVI connects battery health monitoring to the inspection, work order, and PM scheduling platform that manages your entire fleet — electric and diesel — on one system.
Battery Health Monitoring for Electric Heavy Fleets
HVI tracks SoH trends, charge patterns, thermal events, and degradation rates for every electric asset — integrated with your inspection, work order, and PM scheduling platform.
Frequently Asked Questions
Q: What is battery State of Health (SoH) and how is it measured?
SoH represents a battery's current usable capacity as a percentage of its original capacity when new. A battery at 80% SoH can only store 80% of the energy it held when new. It's calculated by measuring energy input during charging and output during operation, tracking the change in State of Charge (SoC) during these transfers. The BMS reports SoH, and fleet management software should trend it over time to detect accelerated degradation.
Q: How fast do heavy equipment batteries degrade?
The average across electric vehicles is 2.3% capacity loss per year (Geotab 2025 study, 22,700 vehicles). Heavy equipment may degrade faster due to deeper discharge cycles, harsher thermal environments, and higher vibration. Fleets using primarily Level 2 AC charging see ~1.5%/year. Fleets relying on high-power DCFC see ~3%/year. The specific rate depends on charging behavior, thermal management, and duty cycle.
Start tracking with HVI.
Q: Should I always limit charging to 80%?
As a daily default, yes — set charger limit to 80%. Charging above 80% stresses cell chemistry at high voltage, accelerating degradation. Override to 100% when the next shift genuinely requires full capacity (long haul, heavy load, full-day operation without charging access). Geotab's latest data shows the difference between 80% and occasional 100% charging is modest — the key is not making 100% the routine.
Q: When should I replace vs. recondition a battery pack?
At SoH 70-80%: evaluate whether reduced capacity meets operational needs — may be acceptable for lighter duties. At SoH 60-70%: check warranty, then compare module-level reconditioning (replacing 2-4 degraded modules at 30-50% of full pack cost) vs. full replacement. Below 60%: full replacement required, but assess second-life value for stationary energy storage. Cell balance data determines whether reconditioning is viable — if degradation is concentrated in specific modules, reconditioning offers strong ROI.
Q: How does battery monitoring integrate with CMMS?
HVI integrates battery health data into the same platform that manages inspections, work orders, and PM schedules. SoH trends feed asset lifecycle planning. Thermal alerts auto-generate work orders for cooling system inspection. Charge event logs feed operator behavior analysis. Cycle counts trigger warranty management alerts. All battery data flows into cost tracking for TCO analysis alongside diesel fleet maintenance costs.
Q: What about the EU Battery Passport regulation?
Effective 2027, the EU Battery Passport requires digital documentation of battery SoH, charge history, and lifecycle data for batteries above 2 kWh. Fleets operating in, selling to, or exporting equipment to European markets need battery health data infrastructure now. HVI's battery monitoring provides the charge event logging, SoH trending, and thermal history documentation the regulation will require.