If your CSA score feels like a black box, you're not alone — most of the confusion comes from mixing up what the number is and what moves it. A CSA score explained properly starts with a distinction almost everyone blurs: CSA is the broader FMCSA safety program, while the Safety Measurement System (SMS) is the tool that turns roadside inspections, crashes, and investigations into the percentiles carriers watch. Get that straight and the rest is far less mysterious. This guide walks through the BASIC categories, how percentiles are calculated, and what's actually changing. Book a demo to strengthen the vehicle-maintenance inputs behind your profile.
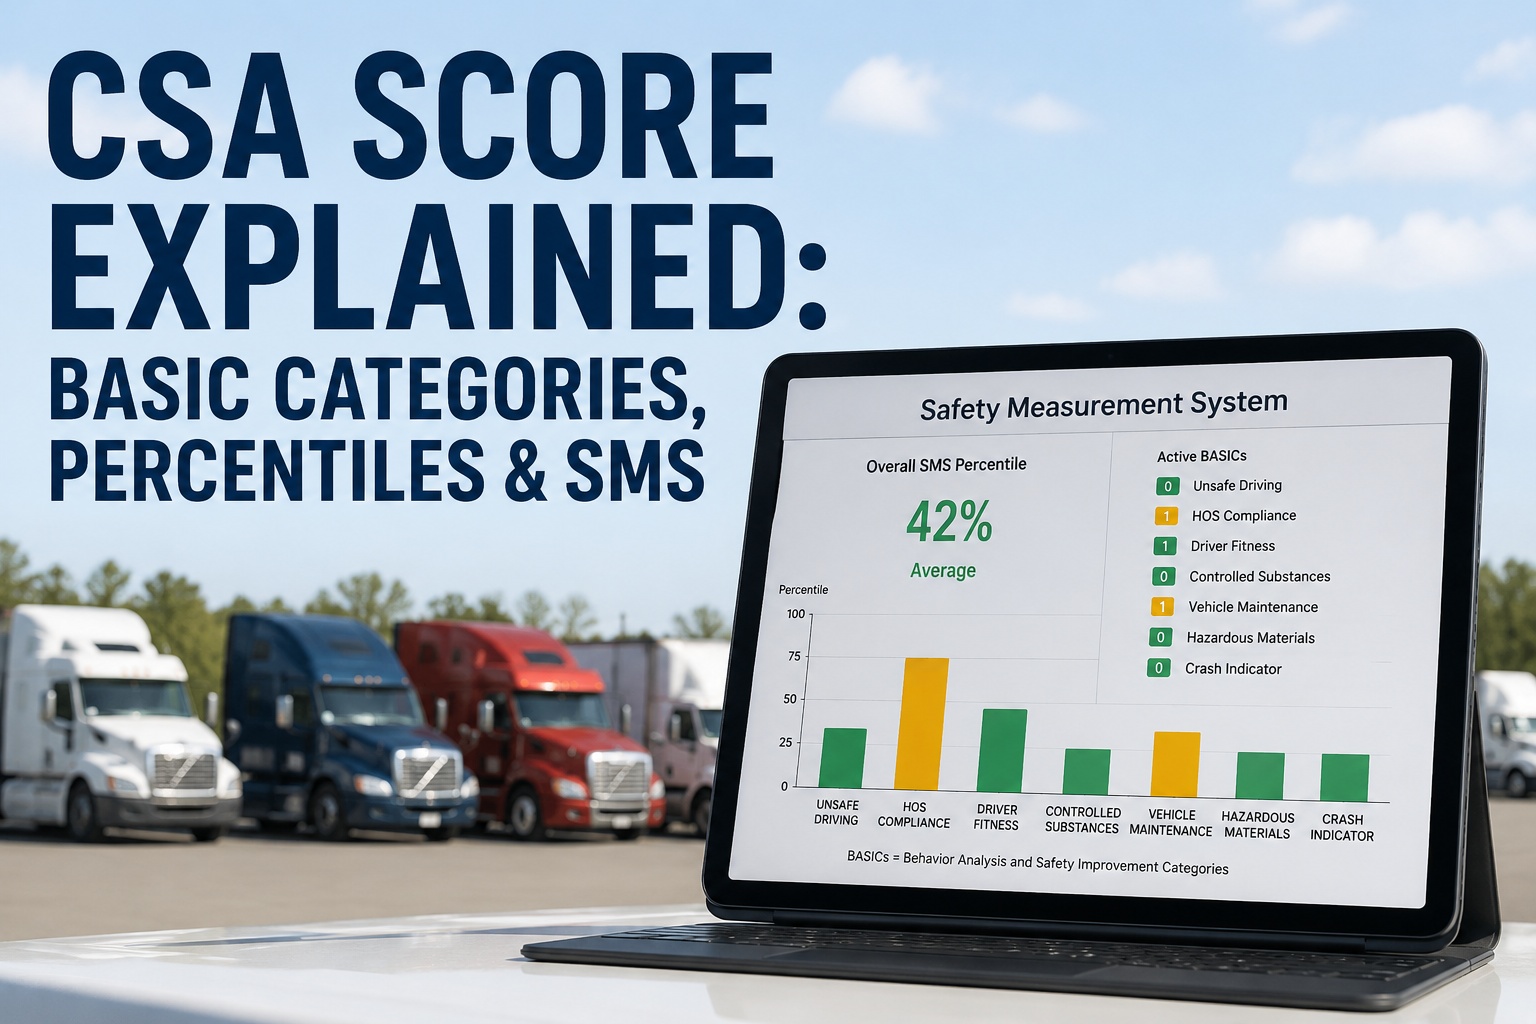
CSA Score Explained: BASIC Categories, Percentiles & SMS
The broader FMCSA program — the overall safety and compliance framework whose goal is to identify higher-risk carriers and prevent crashes.
The tool FMCSA uses to evaluate carrier safety performance — the system that processes the data and produces the percentiles people call "CSA scores."
Educational overview — not legal or compliance advice. FMCSA methodology can change. Always verify the current SMS methodology and your official carrier profile at fmcsa.dot.gov, since figures and rules are updated over time.
With that distinction in place, here's the plain-English version of what the SMS actually does. Each month, it takes safety data — roadside inspection violations, State-reported crashes, and investigation results — and organizes it into safety categories. It weights each violation by how serious it is and how recently it happened, accounts for how much a carrier operates and how often it's inspected, and then compares the carrier against other carriers with a similar amount of safety-event data. The output is a set of percentiles: a carrier's standing relative to its peers in each category. Crucially, a percentile is a comparison, not a raw tally — which is why your number of violations doesn't translate one-for-one into a score.
How the SMS turns data into a percentile
The calculation isn't a simple sum. It's a pipeline — data in, weighting applied, comparison made, percentile out. Understanding the flow explains why two carriers with the same violation count can have very different scores.
Roadside inspection violations, State-reported crashes, and investigation results feed the system.
Each violation carries a severity weight and a time weight — recent events count more than older ones.
How much the carrier operates and how often it's inspected shapes the measure — raw counts alone don't decide it.
The carrier is ranked against peers with similar safety-event data, producing a percentile per category.
This is why the raw number of violations doesn't equal a simple score: a carrier with many inspections and a few violations can rank better than one with fewer violations but very little inspection activity. The comparison group and the weighting do the heavy lifting. Book a demo to strengthen the inspection inputs that feed this pipeline
The BASIC categories
The SMS organizes safety data into categories known as the BASICs — Behavior Analysis and Safety Improvement Categories. FMCSA's current public material describes seven. Note that some information and categories aren't publicly displayed for every carrier, so a given profile may show only some of these.
Dangerous operation — speeding, reckless driving, improper lane changes, and similar violations.
Driving beyond HOS limits and related records-of-duty-status violations.
Driver qualification issues — licensing, medical certification, and required documentation.
Violations involving impairment or the misuse of controlled substances and alcohol.
Mechanical defects and equipment violations — brakes, tires, lights, and required inspection items. HVI's focus area
Violations related to the safe handling, placarding, and transport of hazardous materials.
Crash history — a consequence-based category that incorporates carrier size and mileage exposure.
Each BASIC measures a distinct slice of safety performance, and they're prevented differently — Vehicle Maintenance by inspection and upkeep, the driver-side categories by process and training. Of these, Vehicle Maintenance is the one most directly within a maintenance program's control, which is where we'll focus later. Start free on HVI to target the Vehicle Maintenance inputs directly.
Severity, time, and why a clean inspection matters
Two weightings shape how much any single violation affects a score, and one often-overlooked factor works in your favor: inspections that find nothing.
Not all violations count equally. Each is assigned a severity weight reflecting how much it relates to crash risk — a serious brake defect carries more weight than a minor issue.
Recency matters. More recent violations are weighted more heavily than older ones, so a violation from last month affects the score more than one approaching the end of the data window.
An inspection with no violations is a positive data point — it adds inspection activity without adding violation weight, which can help your standing relative to peers.
Adds weighted violation data to the relevant category. The impact depends on the violation's severity, its recency, and your overall inspection history.
This is why building a record of clean inspections and inspection volume matters, not just avoiding violations. The system evaluates a body of data over time, so consistent, well-documented inspection activity is part of a healthy profile. Book a demo to build a consistent, well-documented inspection record
What's changing — live vs. approved, kept honest
There's a lot of noise online claiming a sweeping overhaul is already live. Accuracy matters more than drama here, so here's the careful version: what FMCSA's current material describes, versus what's approved but not confirmed in effect. Verify against FMCSA directly.
- The SMS organizes data into seven BASICs
- A 24-month rolling data window, recalculated monthly
- Severity and time weighting of violations
- Percentiles produced by comparison against carriers with similar safety-event data
- Some categories and data are not publicly displayed for every carrier
- An enhanced SMS methodology FMCSA has developed and made previewable
- Reorganized compliance categories, including a "Vehicle Maintenance: Driver Observed" concept
- Simplified severity weighting and revised intervention thresholds
- A proportionate-percentile approach in place of fixed safety-event groups
- These are approved refinements; confirm the current live methodology and any rollout status directly with FMCSA
The safe posture: manage your safety data against what's live today, keep an eye on approved changes, and verify your actual percentile on the official FMCSA carrier profile rather than a third-party summary. Methodology evolves, and only FMCSA's live system determines your real numbers. Start free to keep your vehicle-maintenance records solid through any methodology change.
The Vehicle Maintenance BASIC: where a maintenance program actually helps
Of all the BASICs, Vehicle Maintenance is the one most directly connected to a fleet's day-to-day maintenance and inspection work — which is exactly why it's worth understanding how defects turn into compliance risk, and how process closes the gap.
The mechanism is simple: fewer preventable defects reaching the roadside means fewer vehicle-maintenance violations entering the data, and thorough documentation means the maintenance program is demonstrable. Neither guarantees a particular score — the SMS is FMCSA's to calculate — but both directly address the inputs the Vehicle Maintenance BASIC draws from. Book a demo to see the inspection-to-repair workflow in action
Practical ways to strengthen your safety profile
Improving a safety profile isn't about gaming a number — it's about improving the underlying safety-management processes that generate the data. These are the levers within a fleet's control.
Identify which violations repeat and address the root cause, rather than fixing the same issue over and over.
Consistent, structured inspections catch defects before they reach a roadside inspection.
Close the loop on every finding with a verified, recorded repair — and keep the evidence.
Keep the driver-side documentation complete, since several BASICs draw on it.
Use your own inspection and violation history to find patterns and fix the source, not just the symptom.
Check your official carrier profile, and use the DataQs process to challenge records you believe are inaccurate.
Notice that none of these promise a specific percentile. They improve the real safety processes behind the data — which is both the honest goal and, over time, the most reliable path to a healthier profile.
From a compliance officer who stopped chasing the number
Early on, I was obsessed with the percentile itself — refreshing the profile, panicking at every uptick. What I eventually understood is that the number is just a reflection of the data, and the data is a reflection of what we actually do. You can't shortcut it. So we stopped chasing the score and started fixing the processes: tighter inspections, every defect tracked to a repair with a photo, PM that actually ran on schedule.
Our Vehicle Maintenance data improved because we were putting fewer preventable defects on the road, not because we found a trick. And when the methodology talk started swirling — new windows, new weights, all of it — I stopped worrying about the rumors. If our maintenance is genuinely solid and documented, we're in decent shape whatever the exact formula turns out to be. I still verify everything on the actual FMCSA profile, though. That's the only number that's real.
The bottom line on CSA scores
A CSA score explained honestly comes down to a few durable truths, regardless of how the methodology evolves.
The percentiles come from the SMS, which weights violations by severity and recency and ranks you against similar carriers.
Raw violation count doesn't map one-for-one to a score — exposure, inspection volume, and the peer group all matter.
Improve the underlying inspection, repair, and documentation practices — that's the honest and durable path.
FMCSA's current material describes seven BASICs and a 24-month window, and the agency has approved further enhancements you can preview — but treat only the live system as fact and verify your actual percentile on the official carrier profile. For the Vehicle Maintenance BASIC specifically, the most reliable improvement is fewer preventable defects and stronger documentation — which is precisely where a structured inspection and maintenance program earns its keep. HVI supports that process; it doesn't calculate or control your CSA percentile, and no tool can guarantee a particular outcome. Always confirm current FMCSA methodology and requirements directly. Book a demo to improve your vehicle-maintenance compliance with HVI.
Frequently asked questions
What is a CSA score and how is it different from SMS?
CSA and SMS are related but not the same thing, and confusing them is the source of much of the confusion around "CSA scores." CSA stands for Compliance, Safety, Accountability, and it's the broader Federal Motor Carrier Safety Administration (FMCSA) program — the overall safety and compliance framework whose purpose is to identify higher-risk carriers and help prevent crashes. SMS stands for Safety Measurement System, and it's the specific tool FMCSA uses within the CSA program to evaluate a carrier's safety performance. The SMS is what actually processes the data — roadside inspection violations, State-reported crashes, and investigation results — and produces the percentiles that people commonly refer to as "CSA scores." So when someone talks about their "CSA score," they're really referring to their SMS percentiles in the various safety categories. The distinction matters because it clarifies what you're looking at: CSA is the program and its goals, while SMS is the measurement methodology and the numbers. Because FMCSA periodically updates the SMS methodology, the way those percentiles are calculated can change over time, so carriers should always verify the current methodology and check their actual results on the official FMCSA carrier profile rather than relying on secondary descriptions.
What are the BASIC categories?
The BASICs — Behavior Analysis and Safety Improvement Categories — are the safety categories the SMS organizes data into. FMCSA's current public material describes seven: Unsafe Driving, which covers dangerous operation such as speeding and reckless driving; Hours-of-Service Compliance, covering driving beyond HOS limits and related records-of-duty-status issues; Driver Fitness, covering driver qualification matters like licensing and medical certification; Controlled Substances and Alcohol, covering impairment and substance-misuse violations; Vehicle Maintenance, covering mechanical defects and equipment violations such as brakes, tires, and lights; Hazardous Materials Compliance, covering the safe handling and transport of hazardous materials; and the Crash Indicator, which is based on crash history and incorporates carrier size and mileage exposure. Each BASIC measures a distinct area of safety performance, and they're addressed differently — Vehicle Maintenance through inspection and upkeep, the driver-focused categories through process and training. An important nuance is that some information and some categories are not publicly displayed for every carrier, so any given carrier's public profile may show only a subset of these categories. FMCSA has also developed approved enhancements to how categories are organized, so carriers should confirm the current structure and their own results directly with FMCSA.
How do violations affect a CSA score?
Violations affect the SMS percentiles through a weighting system rather than a simple one-for-one tally, which is why a carrier's raw number of violations doesn't translate directly into its score. Each violation is assigned a severity weight that reflects how strongly it relates to crash risk — a serious safety defect carries more weight than a minor issue. Each violation also carries a time weight, meaning more recent violations count more heavily than older ones; a violation from last month affects the score more than one nearing the end of the data window. Beyond individual violations, the calculation accounts for exposure and inspection activity — how much the carrier operates and how often it's inspected — and then compares the carrier against others with a similar amount of safety-event data to produce a percentile. This is why context matters so much: a carrier with many inspections and relatively few violations can rank better than one with fewer violations but very little inspection activity, and a clean inspection (one with no violations) is a positive data point because it adds inspection history without adding violation weight. Because the methodology can be updated, carriers should verify the current weighting and calculation approach with FMCSA and check their actual percentile on the official carrier profile.
Did FMCSA change the SMS methodology in 2026?
This requires a careful answer, because there's a lot of inaccurate information circulating. FMCSA has developed and approved a set of enhancements to the SMS methodology — these include reorganized compliance categories (such as a "Vehicle Maintenance: Driver Observed" concept), simplified severity weighting, revised intervention thresholds, and a proportionate-percentile approach intended to replace fixed safety-event groups — and the agency has made a preview available so carriers can see how the enhancements would affect their results. However, it's important to distinguish approved changes from changes that are confirmed to be live in the official scoring system. FMCSA's current public material still describes seven BASICs and a 24-month data window. You may encounter claims that a specific dated overhaul is already fully in effect, that the data window is now 12 months, that all severity weighting has become a simple one-or-two scale, or that Vehicle Maintenance has been split into active public categories — but these should not be treated as fact unless FMCSA's official documentation confirms they are in effect. The methodology genuinely can and does change over time, so the reliable approach is to verify the current live methodology and your actual percentile directly through FMCSA's official carrier profile and methodology documentation rather than relying on third-party summaries.
How does vehicle inspection software help with the Vehicle Maintenance BASIC?
Vehicle inspection and maintenance software helps with the Vehicle Maintenance BASIC by addressing its underlying inputs, not by calculating or controlling the score itself — an important distinction. The Vehicle Maintenance BASIC draws on roadside vehicle-maintenance violations, which originate from mechanical defects and equipment issues like brakes, tires, and lights, as well as from documentation problems. A platform like Heavy Vehicle Inspection (HVI) helps a fleet reduce the preventable defects that become those violations and strengthen the documentation that demonstrates a maintenance program. It does this through structured pre-trip and post-trip inspections that catch defects consistently, defect identification captured with photo evidence, repair assignment and mechanic documentation that track each finding through to a verified fix, verification before a vehicle returns to service, preventive maintenance that services wear items before they fail, and a searchable vehicle history that reveals recurring problems so root causes can be addressed. The logic is straightforward: fewer preventable defects reaching the roadside means fewer vehicle-maintenance violations entering the data, and thorough documentation means the program is demonstrable. What such software cannot do is guarantee a particular CSA percentile or intervention outcome — only FMCSA's SMS calculates the score, and many factors are outside any single tool's control. HVI functions as a vehicle inspection and maintenance compliance layer that helps address the defects and documentation contributing to Vehicle Maintenance performance, which fleets should pair with verifying their actual data through FMCSA.
Improve Vehicle Maintenance compliance with HVI
HVI won't calculate your CSA percentile — only FMCSA's SMS does that. What it will do is strengthen the vehicle-maintenance processes behind it: structured inspections, defect tracking with photo evidence, repair documentation, preventive maintenance, and a searchable vehicle history that helps you catch and correct problems before they become roadside violations. Fewer preventable defects, better documentation, no guarantees of any specific outcome — just a solid maintenance program that stands on its own through any methodology change.
Structured inspections · Defect & repair tracking · Preventive maintenance · Searchable history