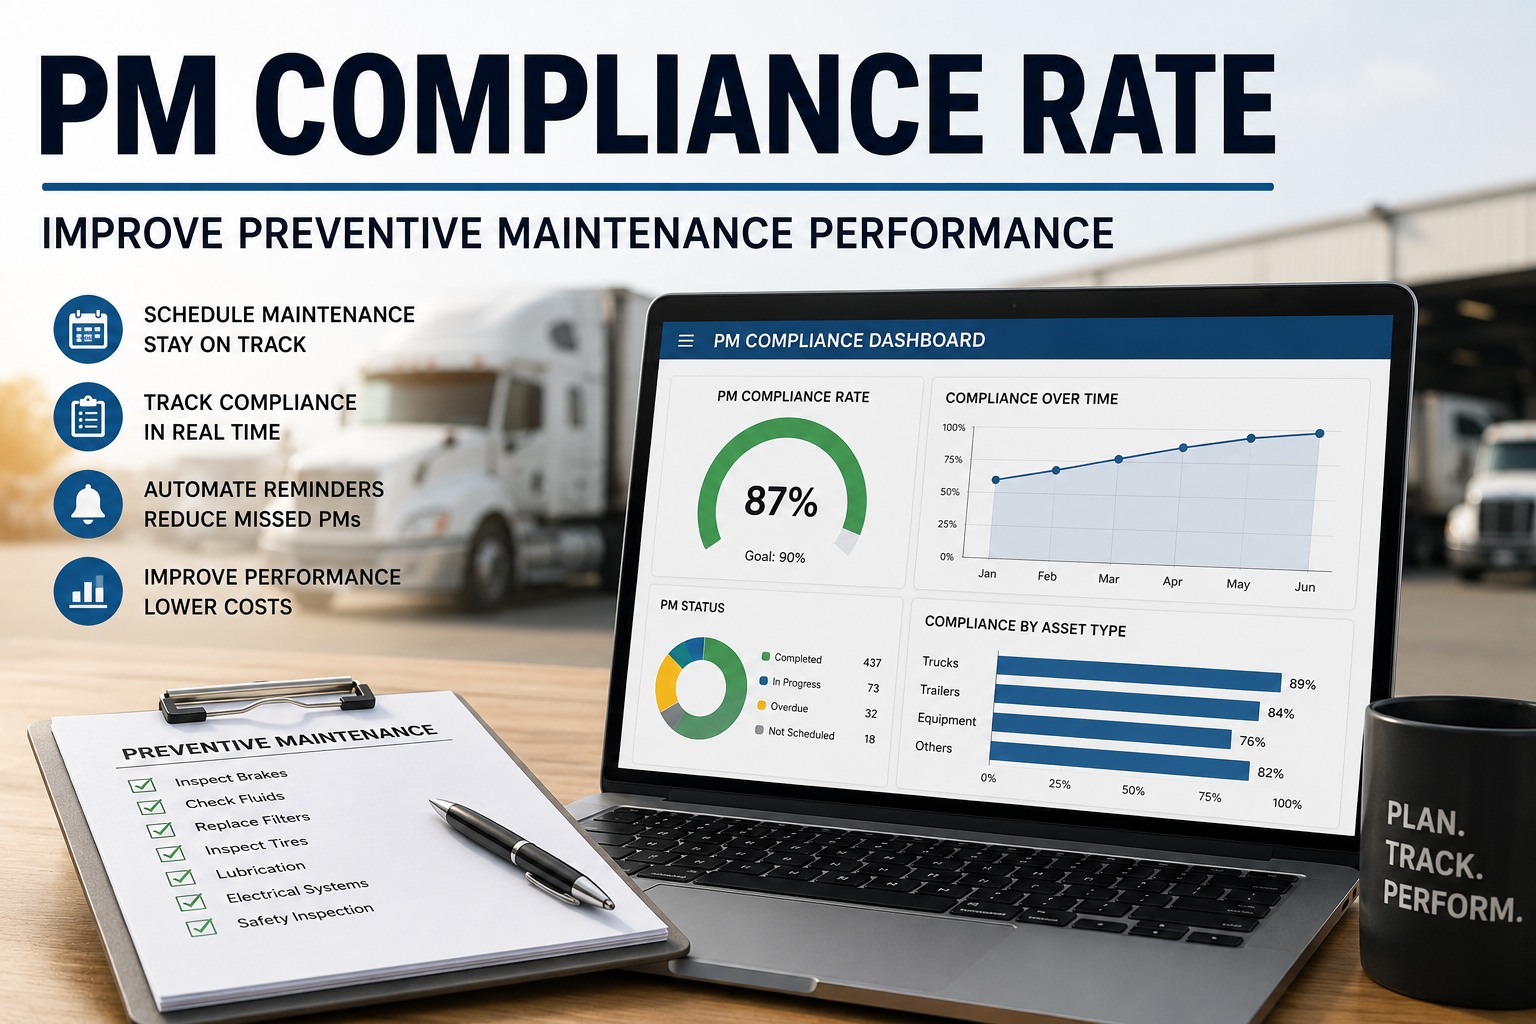
PM compliance rate is the single strongest leading indicator of fleet maintenance economics — the percentage of scheduled preventive maintenance completed on-time versus missed or deferred. Best-in-class fleets run 90%+ compliance and reap 30-40% lower R&M costs, 60-70% less unplanned downtime, and materially cleaner CSA scores. Industry-average fleets sit at 70-85%. Below 60% signals systemic breakdown that predicts elevated CPM and roadside violations. Book an HVI demo for automated PM tracking.
One KPI. Four performance tiers. Four different fleet outcomes.
PM compliance rate predicts your downtime percentage, your R&M cost per mile, your CSA score, and your breakdown frequency. The tier your fleet lands in is the tier your outcomes will land in.
What PM compliance rate actually measures
PM compliance rate is defined by the Society for Maintenance & Reliability Professionals (SMRP) as the percentage of scheduled preventive maintenance tasks completed within a defined tolerance window — typically 10% of the interval — divided by total PMs scheduled. It's expressed as a percentage and calculated monthly at minimum, weekly for fleets with active PM programs.
The 10% window matters. A PM scheduled at 15,000 miles with a 10% window can be completed anywhere between 13,500 and 16,500 miles and still count as compliant. Outside that window — whether early (wasting service life) or late (accepting risk) — the PM counts as non-compliant even if it was eventually completed. This distinction separates world-class fleets from average ones. Just doing the PM isn't enough; doing it in the right window is.
Count only PMs completed within the 10% tolerance window. Late completions don't count as compliant — they count as failures caught late. This is where most fleets over-report their compliance rate.
Count all PMs that came due in the reporting period. Include PMs that were rescheduled, postponed, or waived — postponement isn't exemption. Missed PMs count against the total.
Rolling 30-day or 7-day windows produce stable trend data. Calendar-month reporting creates artificial cliff-edges at month-end that mask the underlying reality.
Fleet-wide compliance rate hides per-truck outliers. Track both. One truck at 40% compliance drags fleet average down and predicts specific equipment failure — visible only at the per-truck level.
Fleets that track compliance rate correctly find their real number is 10-15 percentage points lower than their intuitive estimate. That gap is where operational improvement lives — and where digital PM platforms produce their largest measurable impact. Book an HVI demo to see PM compliance tracked with SMRP-standard methodology
The 5 places where PM compliance breaks down
Compliance rate doesn't fall for one reason. Five distinct operational failure points explain nearly all of the gap between world-class fleets at 90%+ and average fleets at 75%. Every fleet leaks compliance at some combination of these five.
PMs come due but nobody sees them. Paper-based fleets rely on shop foremen tracking service intervals mentally or on shared spreadsheets that don't automatically flag due services. First place to lose 8-12 points of compliance rate. Common in fleets under 50 units where "we all know when trucks need service" replaces systematic scheduling.
Truck is scheduled for PM but dispatch needs it on a load. Service gets pushed — sometimes by weeks. When operational pressure regularly wins over maintenance discipline, compliance rate drops 5-8 points structurally. Requires management alignment on when deferral is acceptable and when it isn't.
PM comes due but the parts aren't in stock or the shop is booked with reactive repair. Service delays beyond the 10% window count as non-compliant even if the fleet's intent was right. Predictive parts stocking and shop capacity planning eliminate 3-6 points of compliance loss here.
PM was completed but not documented in the compliance-tracking system. Technician did the work; paperwork didn't follow. In the reporting system this looks like a missed PM. Common in fleets running paper work orders that get lost between shop bay and back office. 4-8 points of "phantom" non-compliance.
PMs scheduled at wrong intervals for actual duty cycle. Highway trucks scheduled on time-based intervals despite low mileage; vocational trucks scheduled by mileage despite low speed / high hours. Over-scheduling wastes labor; under-scheduling accepts wear. Duty-cycle-aligned intervals eliminate 2-5 points of avoidable compliance loss.
Diagnosing which of the five is the primary loss driver for a specific fleet requires per-truck compliance history — not just fleet-wide averages. Fleets typically have 2-3 dominant loss drivers, not one. Fix the largest first; the next largest becomes visible only after the largest is resolved. Book an HVI demo to see the loss driver breakdown for your fleet
The 6 tactics that move compliance rate
Moving PM compliance rate from 70% to 90% is not one intervention. Six tactics executed together produce sustained improvement. Fleets attempting single-tactic solutions typically see short-term bumps that revert within a quarter.
The single highest-leverage tactic. Auto-generate work orders when trucks hit hour or mile intervals from telematics data — not from calendar or memory. Eliminates the scheduling visibility gap entirely and moves compliance 8-12 points on its own.
Publish compliance rate weekly to fleet management team and quarterly to executives. Metrics that don't get reported don't get managed. Fleets adding executive visibility to PM compliance see 5-8 points improvement within 6 months as ops-vs-maintenance conflicts get resolved at the right level.
Require formal approval before any PM gets deferred more than 10% past due. Not to prevent deferral — sometimes it's the right call — but to make deferral visible and accountable. Fleets adding this control see compliance rate rise 3-5 points as informal deferrals stop.
Match PM intervals to how the truck is actually used. Long-haul on highway = mile-based intervals. Vocational stop-start = hour-based intervals. Refrigerated with high PTO = engine hour intervals. Wrong intervals guarantee compliance failure; right intervals make compliance achievable.
Stock the parts needed for the next 60 days of scheduled PMs, not just for reactive repair inventory. When a scheduled PM comes due and the filter isn't on the shelf, the PM slips. Predictive stocking based on scheduled PM forecast prevents this failure mode.
Track compliance rate per truck, not just fleet-wide. Trucks at 40% compliance predict failure — visible only if you're looking at them. Fleet management platforms tracking per-truck compliance identify outlier equipment before it becomes an OOS violation or a breakdown.
The six tactics compound. A fleet at 72% compliance implementing all six typically hits 88-92% within 12 months — without changing headcount, fleet size, or duty cycle. The tools and discipline produce the result; the compliance rate produces the downstream economics. Start a free trial to implement the six tactics against your baseline.
The compliance-to-outcomes cascade — what improving PM actually delivers
PM compliance rate is a leading indicator, not an outcome. The outcomes that matter to fleet CFOs and operations executives are downtime, cost per mile, safety scores, and revenue-generating equipment availability. Each of these moves as compliance moves — and the direction is always the same.
The cascade is why PM compliance rate matters as a fleet management KPI. It's not just a maintenance department metric — it's the leading indicator of four distinct financial outcomes that show up on the P&L. Fleet CFOs who instrument compliance rate turn maintenance from a cost center into a lever. Start a free trial to instrument the cascade metrics for your fleet.
From a Maintenance Supervisor who took a fleet from 68% to 91% in one year
When I inherited this shop, our reported PM compliance was 82%. But we weren't using the 10% window — we were counting any completed PM regardless of when it happened. Real number under SMRP methodology was 68%. Board didn't know we had a problem.
First move: put every truck on auto-generated work orders driven by telematics mileage, not paper schedules. Second: weekly compliance report to the ops director. Third: no PM deferral over 10% without written approval. Within 90 days we were at 82% real. Within a year, 91%. Unplanned downtime dropped from 12% to 6%. R&M cost per mile dropped $0.05. Insurance renewal came in 18% lower the following year. Same trucks, same drivers, same shop — different discipline.
Frequently asked questions
What is a good PM compliance rate for a commercial fleet?
Best-in-class fleets consistently hit 90% or higher PM compliance under SMRP-standard methodology (PMs completed within a 10% tolerance window of the scheduled interval). Industry-average fleets sit in the 70-85% range. Below 70% signals systemic breakdown in scheduling, execution, or documentation that predicts elevated maintenance CPM and increased roadside violations. The specific outcomes correlate closely with tier. World-class fleets at 90%+ compliance typically see unplanned downtime under 5%, R&M cost per mile of $0.14-0.18, mean-time-between-failures of 65,000+ miles, and CSA Vehicle Maintenance BASIC scores under 40. Best-in-class fleets at 85-89% compliance see unplanned downtime 5-8%, CPM $0.18-0.21, MTBF 45,000-65,000 miles, CSA 40-60. Industry-average fleets at 70-84% see downtime 8-14%, CPM $0.21-0.28, MTBF 30,000-45,000, CSA 60-80. At-risk fleets under 70% see downtime exceeding 15%, CPM over $0.30, MTBF under 30,000 miles, CSA above 80. These correlations mean PM compliance rate is not just a maintenance department metric — it's the leading indicator of four downstream financial outcomes. Every 10-point improvement in compliance rate typically reduces R&M CPM by $0.02-0.04 and cuts unplanned downtime by 3-5 percentage points over the following 12 months.
How do you calculate PM compliance rate correctly?
The SMRP-standard formula is: PM Compliance Rate = (PMs Completed Within 10% Window ÷ Total PMs Scheduled in Period) × 100. The 10% window is critical. A PM scheduled at 15,000 miles has a compliant range from 13,500 to 16,500 miles. A PM completed at 12,000 miles is early and wastes remaining service life; a PM completed at 18,000 miles is late and accepts wear risk beyond design. Both count as non-compliant under proper methodology, even though the truck received the PM. Most fleets over-report compliance because they count any completed PM regardless of timing. Correct application: the numerator counts only PMs completed within the 10% tolerance window. Late completions don't count as compliant — they count as failures caught late. The denominator counts all PMs that came due in the reporting period, including any that were rescheduled, deferred, or waived — postponement isn't exemption. Missed PMs count against the total. Reporting period should be rolling 30-day or 7-day windows for stability; calendar-month reporting creates artificial cliff-edges. Track compliance at two levels: fleet-wide (for management reporting) and per-truck (for identifying outlier equipment). One truck at 40% compliance predicts specific equipment failure — visible only at the per-truck level. Fleet-wide averages hide the trucks driving future violations. Digital PM platforms automate the calculation from work order data and produce continuous compliance reporting without spreadsheet overhead.
Why is PM compliance rate more important than PM completion count?
Because PM completion count doesn't measure discipline — it just measures activity. A fleet that completes 500 PMs but 200 of them were late and 100 were early hasn't demonstrated maintenance discipline; it has demonstrated that the work eventually got done. The economic and safety value of PM comes from doing the right service at the right time, not from doing service eventually. A brake lining inspection scheduled at 90 days delivers meaningful information at 85 days (5% early) or 95 days (5% late). At 120 days (33% late), the inspection may catch a problem that has already caused wear to a drum, chamber, or S-cam that could have been prevented with on-time service. The lining inspection still gets counted in raw completion count but has failed the reliability engineering purpose it was designed to serve. Similarly, oil changes done 20% early waste the remaining service life in the oil and drain interval, delivering no reliability benefit and increased labor cost. Compliance rate — the percentage completed within the 10% window — captures both timing failures. A fleet at 500 PMs completed per month with 85% compliance is delivering measurably better reliability outcomes than a fleet at 500 PMs completed with 65% compliance, even though both fleets appear equally busy. This is why SMRP, AEMP, and ATA all standardize on compliance rate rather than completion count as the primary PM KPI.
Can PM compliance rate be improved without adding shop headcount?
Yes — and this is typically where the biggest gains come from. The most common misconception about low compliance rate is that it requires more technicians to fix. In practice, most compliance loss comes from process failures, not capacity failures. The five most common breakdowns are: scheduling visibility gap (nobody sees the PM come due), operational deferral pressure (dispatch overriding maintenance), parts and shop capacity constraints (wrong parts for scheduled PM), documentation and closeout gap (PM done but not recorded), and interval calibration errors (PMs scheduled for wrong duty cycle). Of the five, only "parts and shop capacity constraints" is a resource question — and that's usually solved by predictive parts stocking based on the scheduled PM forecast, not by more shop bays. The other four are process and discipline questions that respond to digital PM platforms with auto-generated work orders, executive-level compliance dashboards, deferral approval workflows, and per-truck accountability tracking. Fleets typically move compliance rate from 70% to 90% within 12 months using existing headcount but with the six tactical improvements applied together. The ROI is fast: a 10-point compliance improvement typically pays for the platform investment within 6-9 months through reduced unplanned downtime, lower R&M CPM, and avoided roadside violations that would otherwise generate fines and CSA score deterioration.
What's the difference between PM compliance rate and PM completion time?
PM compliance rate measures whether PMs get done in the right window (percentage of scheduled PMs completed on time). PM completion time measures how long each PM takes to complete once started (labor hours per PM event). Both are important KPIs but they measure different things. High compliance with high completion time means the fleet is doing the right PMs at the right time but taking too long — a shop efficiency question. Low compliance with low completion time means the fleet completes PMs quickly but misses the schedule — a planning discipline question. Best-in-class fleets track both metrics and treat them as independent variables. Compliance rate is typically the leading indicator of fleet reliability outcomes (downtime, CPM, safety); completion time is typically the leading indicator of shop labor productivity. A fleet chasing lower completion time without maintaining compliance rate ends up doing quick sloppy PMs that don't catch developing failures. A fleet chasing higher compliance without controlling completion time ends up over-servicing and running up labor cost. Digital fleet analytics platforms track both metrics per truck, per shop, and per technician — surfacing the trade-offs at every level of the operation. Fleet CFOs use the combination to identify where labor productivity opportunities exist without sacrificing the reliability discipline that PM compliance rate protects.
From tracking compliance to owning it — in under 90 days.
HVI's preventive maintenance module ships with SMRP-standard 10% window compliance methodology built-in. Work orders auto-generate when trucks hit hour or mileage intervals from telematics; per-truck compliance dashboards surface outlier equipment; deferral approval workflows create accountability; executive reporting turns maintenance into a boardroom KPI. Live for your fleet in under two weeks — typical result: compliance rate climbs 15-25 percentage points within 90 days, downtime drops 30-50%, and R&M CPM falls into the top-quartile range.
SMRP methodology · Auto-generated work orders · Per-truck compliance tracking · SOC 2 Type II