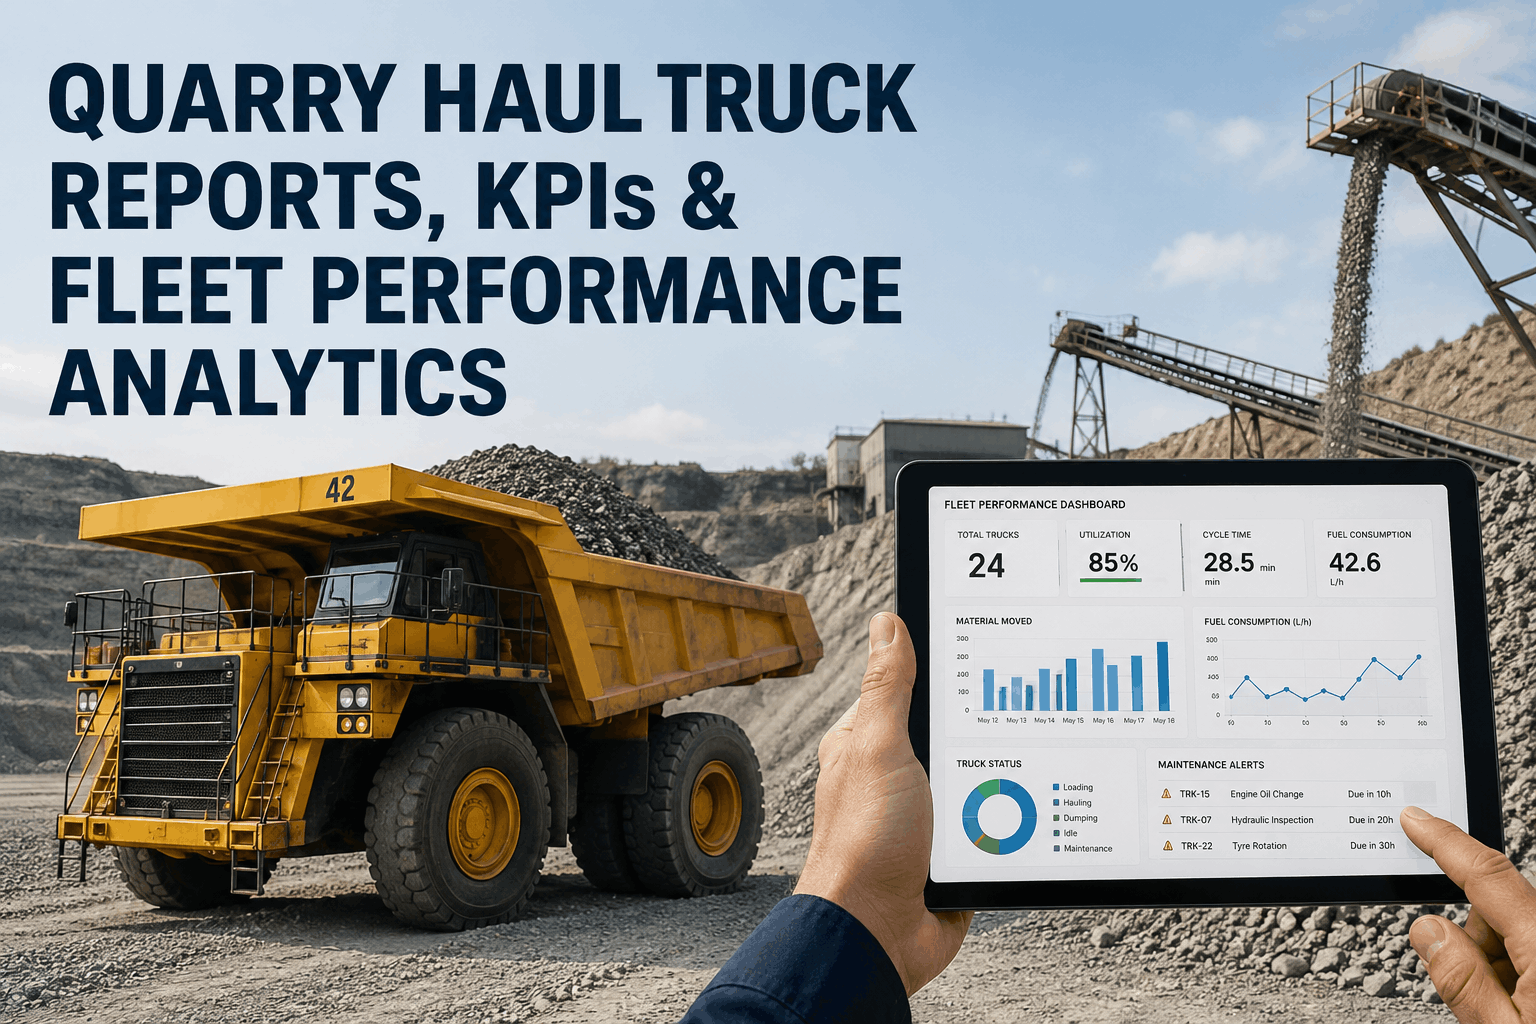
A quarry lives or dies by tonnes per hour, and almost all of that number runs through the haul trucks. Every ton moved late, every truck idling at the shovel, every minute added to a cycle ripples straight back through the production schedule — and the supervisor managing by radio call and end-of-shift report finds out about the problem after the shift is already lost. The next shift inherits it. The difference between a quarry that hits its tonne target and one that chases it all month isn't bigger trucks; it's whether the operation can see its haul-cycle data while the shift is still running. The right KPIs turn a fleet of trucks into a measurable, tunable system: cycle time tells you the clock, payload tells you whether each cycle is worth the diesel, availability tells you how much of your fleet you actually have, and fuel-per-tonne ties it all to cost. Haul truck reporting and KPI software replaces the radio and the clipboard with a live dashboard — surfacing the bottleneck at the loader, the truck running 15% underloaded, the unit whose climbing fuel rate is the first sign of a failure. This page breaks down the haul-truck KPIs that actually move tonnes, the benchmarks that separate average from world-class, and how reporting turns shift data into shift decisions.
Stop Managing the Last Shift. Start Managing This One.
HVI turns haul-cycle, payload, utilization, and maintenance data into one live dashboard — so you catch the loader bottleneck, the underloaded truck, and the failing unit while the shift is still running, not in tomorrow's report.
The Haul Cycle: Where Every Minute Lives
Cycle time is the clock that governs everything. Break it into its five components and the constraint becomes obvious — you can't fix a queue problem by pushing drivers to haul faster. Each segment is a separate lever.
LOAD
Time at the loader — driven by bucket size, fragmentation, dig-face design, and operator pass technique.
HAUL
Loaded travel — road condition, grade, speed, and congestion. The longest segment on most sites.
DUMP
Time at the tip — queue, spot availability, and tip-head design all add up here.
RETURN
Empty travel back to the loader — faster than the haul leg, but still road-condition dependent.
QUEUE
Waiting for loader or dump access — pure waste. The first place reporting should point you.
Every minute added to average cycle time cuts the number of cycles per shift — and tonnes fall with it. Tracking cycle time by route, shift, and loader-truck pairing isolates exactly where the time is leaking.
The KPIs That Actually Move Tonnes
Dozens of metrics exist; a handful decide whether you hit target. These are the ones to put on the dashboard, what they measure, and the red flag that says act now.
Cycle Time
Total loop, load to return. The master productivity clock.
Red flag: creeping upward with no bench change = haul-road or queue problem.
Payload Utilization
Actual load vs. rated capacity, per cycle and per shovel.
Red flag: one shovel 15% underloaded can hide behind a healthy fleet average.
Equipment Availability
Operating hours vs. scheduled hours — how much fleet you really have.
Red flag: below 80% means downtime is quietly capping your tonnage ceiling.
Utilization Rate
Active hauling time vs. total available time.
Red flag: low utilization = idle assets and lost tonnes you're still paying for.
Fuel per Tonne
Diesel burned against material moved — the true efficiency number.
Red flag: rising on one truck = injector/filter wear before any fault code.
MTBF & MTTR
Hours between failures and time to repair — reliability and recovery.
Red flag: falling MTBF signals a unit heading toward repeat breakdowns.
Average vs. World-Class: The Benchmarks
Knowing your numbers only matters against a target. These are the maintenance and performance benchmarks that separate a typical quarry fleet from a best-in-class one — and the gap is worth real money per machine.
KPI
Industry Average
World-Class
Equipment Availability
72–78%
92%+
MTBF (haul trucks)
400–600 hrs
1,000+ hrs
MTTR
12–18 hrs
Under 6 hrs
PM Compliance
70–80%
95%+
First-Time Fix Rate
65–75%
90%+
Closing the gap from average to best-in-class is worth $85,000–$135,000 a year per 10-machine fleet through fewer emergency repairs and higher availability — and lifting MTBF alone can add $45,000–$75,000.
Why Real-Time Beats the Shift Report
The value of a KPI collapses the longer you wait to see it. A cycle-time overrun spotted live can be fixed this shift; the same data in tomorrow's report is just a post-mortem. This is the core case for live reporting.
RADIO & SHIFT REPORT
Problem discovered after the shift is already lost
Next shift inherits the bottleneck unchanged
Payload variance hides in fleet averages
Failing units found by breakdown, not by trend
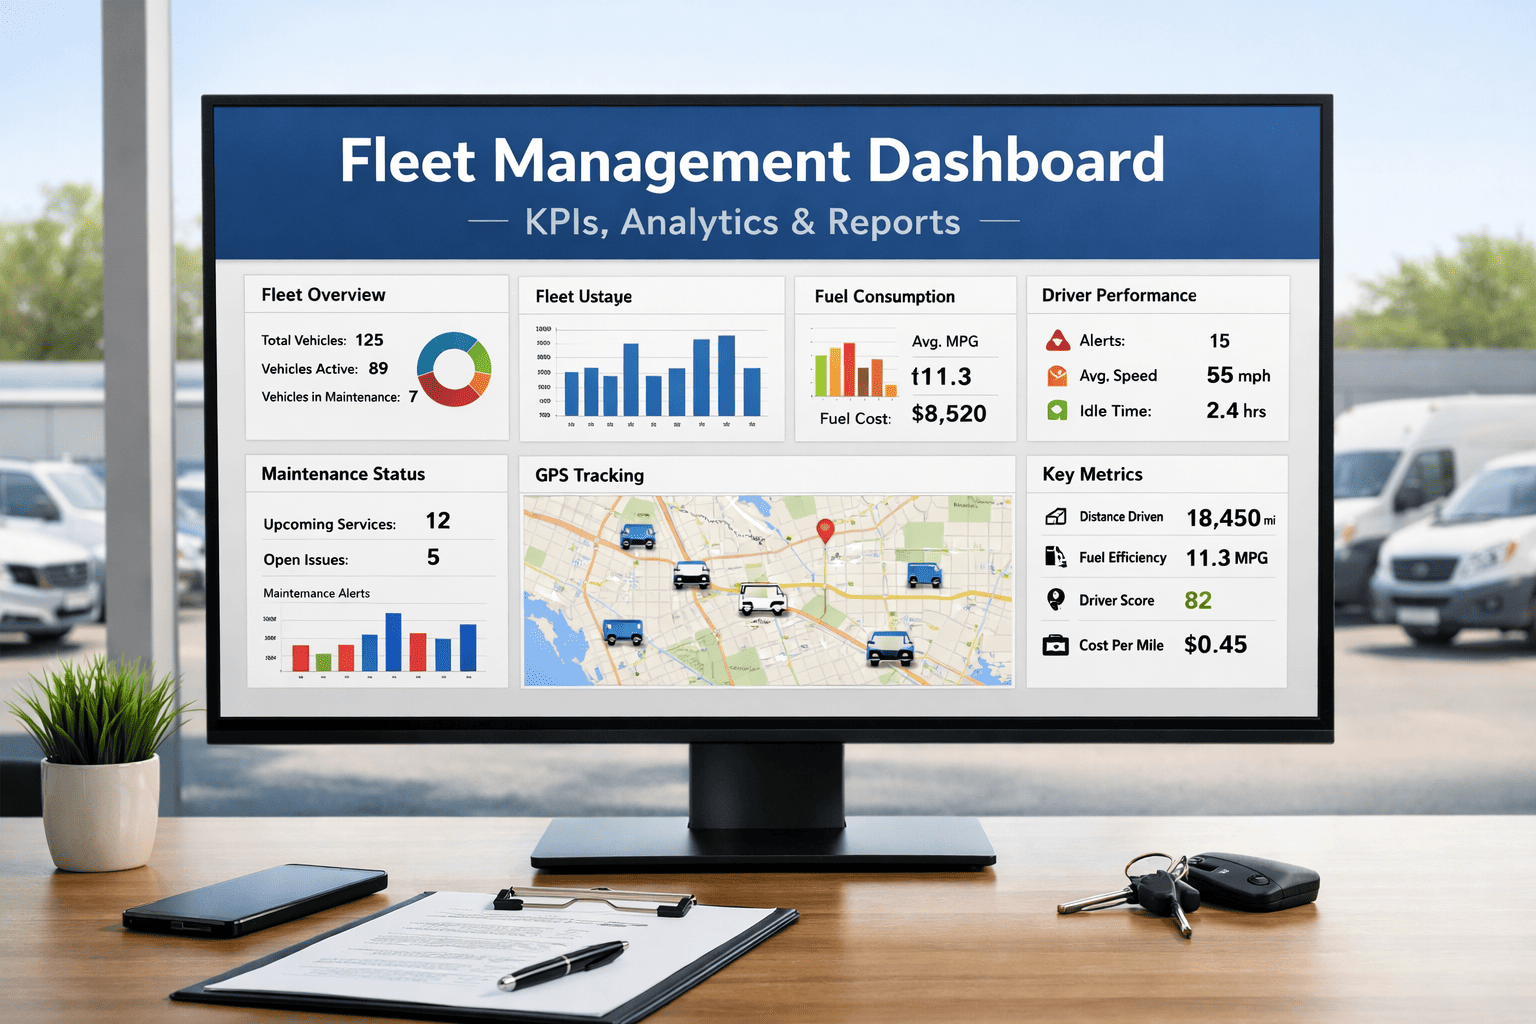
LIVE KPI DASHBOARD
Cycle overrun flagged while the shift can still act
Supervisor rebalances trucks mid-shift
Underloaded shovel surfaced per cycle
Rising fuel rate triggers PM before failure
From Data to Decision in One Loop
Reporting only earns its keep when it closes the loop back to action. Capture, surface, decide — every shift, on the same screen.
1
Capture
Cycle timestamps, payload, fuel, and machine status logged per truck, operator, and shift automatically.
2
Surface
Live dashboard flags the bottleneck, the outlier truck, and the KPI trending the wrong way.
3
Decide
Rebalance the fleet, coach the operator, schedule the PM — and watch tonnes-per-hour respond.
Turn Haul-Truck Data Into Tonnes Per Hour
Cycle-time breakdown, payload and utilization by machine, availability and MTBF tracking, fuel-per-tonne, and a live KPI dashboard — built for quarry and aggregate haul fleets. See the bottleneck while you can still fix it. Trusted by 25,000+ users worldwide.
Frequently Asked Questions
What are the most important haul truck KPIs for a quarry?
The core set is cycle time (the master productivity clock, broken into load, haul, dump, return, and queue), payload utilization (actual load vs. rated capacity, tracked per shovel not just fleet-wide), equipment availability and utilization, fuel per tonne, and the reliability pair MTBF and MTTR. Cycle time and payload decide tonnes per shift; availability and MTBF decide how much fleet you actually have to move them with.
Sign up for a free HVI trial to track them live.
What's a good equipment availability benchmark for haul trucks?
Industry average equipment availability runs about 72–78%, while world-class operations reach 92% or higher. Below 80% generally means downtime is quietly capping your tonnage ceiling. For reliability, haul-truck MTBF averages 400–600 hours but best-in-class fleets achieve 1,000+, and MTTR should target under 6 hours versus a typical 12–18. Closing those gaps is worth $85,000–$135,000 a year per 10-machine fleet.
Schedule a demo to benchmark your fleet.
Why break cycle time into separate components?
Because the fix depends entirely on which segment is slow. A long queue time is a dispatch and loader-matching problem; a long haul time is a road-condition or grade issue; a long load time points to fragmentation or operator technique. Pushing drivers to "go faster" won't fix a queue at the tip head. Tracking load, haul, dump, return, and queue separately — by route and loader-truck pairing — isolates the real constraint so you target the right lever.
How does real-time reporting actually improve production?
It enables short-interval control — acting on data during the shift instead of reading about it after. When a supervisor sees a cycle-time overrun or a bottleneck at the loader live, they can rebalance trucks, reroute, or address the loader while the shift is still running. Managed by radio and end-of-shift report, the same problem isn't visible until the tonnes are already lost and the next shift inherits it. Live visibility is the difference between fixing and explaining.
Sign up for a free HVI trial to get the live dashboard.
How do haul-truck KPIs connect to maintenance?
Several KPIs double as early maintenance signals. A truck's fuel-per-tonne creeping above its baseline is often the first sign of injector or filter wear, weeks before a fault code. Falling MTBF flags a unit heading toward repeat failures. Availability and PM compliance reveal whether downtime is eroding your tonnage. HVI ties these performance metrics to maintenance scheduling, so a KPI trending the wrong way becomes a work order before it becomes a breakdown.
Sign up for a free HVI trial to link KPIs and maintenance.