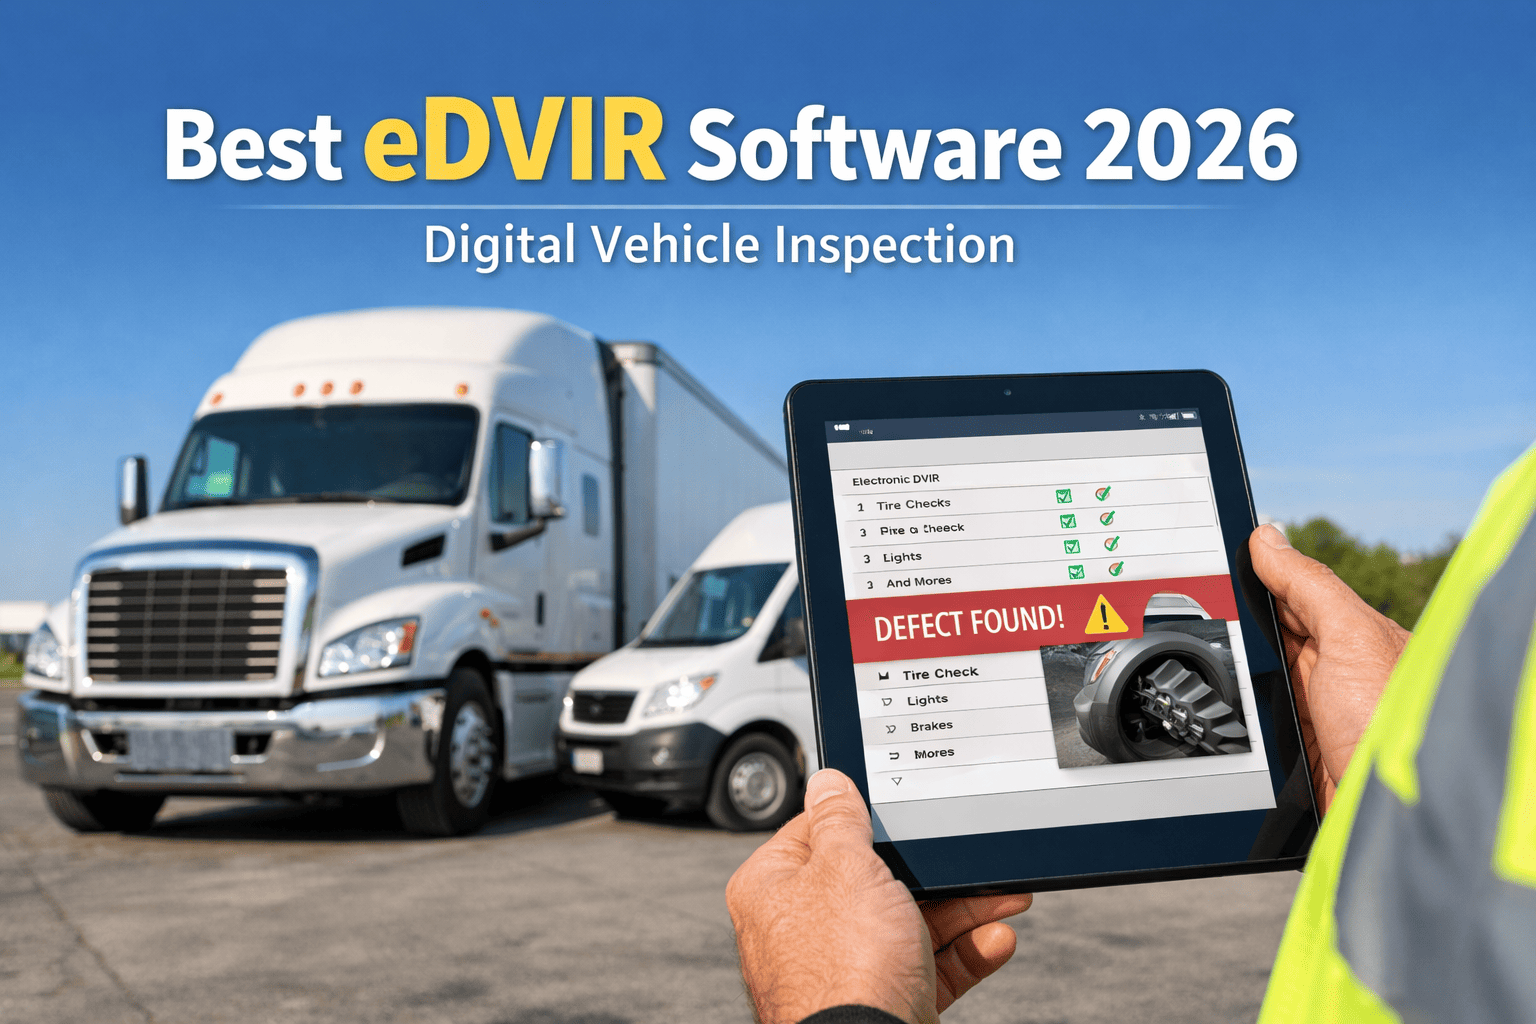
Fleet safety management technology is not a single product — it's a layered stack of six functional systems that work together: telematics for vehicle and driver behavior data, AI dashcams for video and real-time behavior detection, digital DVIR and inspection for mechanical defect capture, incident management for collision documentation, driver management for qualification and coaching, and analytics for cross-system visibility. No single layer is complete on its own. The 2026 shift is toward integration, not more standalone products — and integration is where the operational value lands. Book a demo .
The Fleet Safety Technology Stack — How the Six Layers Fit Together
Each layer captures a different data type. Integration between layers is where the operational safety value lands.
Every layer in the fleet safety stack captures a different data type and answers a different operational question. Telematics answers "where and how is the vehicle being driven"; AI dashcams answer "what did the driver do and see"; digital DVIR answers "what mechanical condition is the vehicle in"; incident management answers "what happened during and after the event"; driver management answers "is this the right driver in the right seat"; analytics answers "what patterns tell us where to intervene next." The layers overlap in narrow ways but do not substitute for each other — and no single layer produces the safety outcomes that come from the layers running together with data flowing bidirectionally between them.
Integration — where the six layers combine into measurable outcomesFour integration pathways that consistently produce documented safety improvements
The safety outcomes documented in industry research (Samsara 2,600-fleet study, Motive/Lytx/Netradyne field data, insurance underwriter feedback) come from integration patterns — not from any single layer in isolation. Four pathways matter most. Book a demo to see HVI's inspection layer integrating with telematics + dashcam feeds
Every one of these pathways depends on clean data flowing between layers — and clean data starts with the DVIR + inspection layer capturing what the vehicle actually looks like at pre-trip. Book a demo to see HVI's data feeding the safety stack
Documented safety outcomes — with source attributionIndustry benchmarks from vendor-published studies and independent research
The outcomes below come from published industry research and vendor-attributed field data. Individual fleet outcomes depend on baseline safety maturity, adoption rate, and integration depth — these are documented ranges rather than universal fleet promises.
Vendor selection — the questions that separate integration from marketingWhat to ask each vendor to test whether their layer actually plays with the others
Every safety technology vendor claims "seamless integration." Very few deliver bidirectional data flow that actually works in production. The questions below separate real integration from marketing language during vendor evaluation. Start a free trial to test HVI's integration approach on your fleet.
Marketing decks list "open API" and "compatible with major platforms." Production reality is which specific vendor pairs have live customer deployments today, with named customers and named workflows. Ask for the reference call.
Many "integrations" are one-way data pushes (telematics event → safety dashboard, read-only). Real bidirectional flow means the safety layer can push corrective action back to the source system (route hard-braking events to specific driver coaching queues, flag vehicles for inspection). Ask for the specific bidirectional workflows.
APIs go down. Vendor connections fail. Ask what happens to your safety workflow when telematics data doesn't reach the safety platform for 4 hours — do drivers still complete DVIRs? Do coaching queues still route? Or does the whole workflow stall waiting for the connection to restore?
Data portability matters. If you swap dashcam vendors in year 3, does your video history come with you or stay with the old vendor? What DVIR records export in standard format? Which coaching data is proprietary vs portable? Ask before you sign, not after.
Adoption drives outcomes. Best software with weak adoption underperforms good software with strong adoption every time. Watch a driver complete a pre-trip inspection on the platform. Watch the coaching workflow. If it takes longer than the paper equivalent or requires context-switching between apps, adoption will suffer regardless of feature list.
These five questions filter marketing claims from production reality faster than any RFP process. Book a demo to see HVI answer each one against real customer integrations
From a fleet safety director on layering the stack in the right order
When we started building our safety technology stack, we made the classic mistake of chasing the flashiest layer first — AI dashcams. Great vendor, great features, real behavior detection. But without the DVIR side of the stack in place, we had video of incidents and no context on the mechanical condition of the vehicle at the time of the event. When our insurance carrier asked for cross-referenced records after a crash, we had beautiful dashcam clips and paper DVIRs in three yards.
The lesson was to layer in the right order for our fleet: digital DVIR + maintenance records first (foundation), then telematics (behavior data spine), then AI dashcam (video + real-time detection), then incident management to tie it all together, then analytics on top. Each layer only pays back when the layers underneath are already producing clean, integrated data. The stack isn't a shopping list — it's an architecture.
Frequently asked questions
What is fleet safety management technology?
Fleet safety management technology is the layered stack of software and hardware systems that captures, analyzes, and acts on safety-relevant data across a commercial fleet. It is not a single product — it's typically six functional layers: telematics + GPS for vehicle and driver behavior data (location, speed, engine health, harsh events, HOS/ELD); AI dashcams and video telematics for dual-facing camera footage with real-time behavior detection (distraction, drowsiness, phone use); digital DVIR and inspection systems for mechanical defect capture and records (49 CFR 396.11 compliance, photo-verified defects, work order routing); incident management for collision workflow (FNOL, evidence assembly, insurance coordination); driver management for qualification files, MVR + medical certificate tracking, Clearinghouse queries, safety scorecards, and coaching workflows; and analytics + reporting for cross-system dashboards, CSA BASIC trend visibility, and ROI measurement. No single layer is complete on its own — the 2026 industry shift is toward integration between layers rather than adding more standalone products. The safety outcomes documented in industry research come from the integration patterns, not from any single technology in isolation.
Which fleet safety technology layer should I invest in first?
The best-sequenced fleet safety stack typically starts with the foundational layers that produce clean data for the other layers to work with, rather than the flashiest new technology first. A common effective sequence: (1) digital DVIR and maintenance records — produces the mechanical condition record that every downstream layer references and satisfies 49 CFR 396.11 compliance; (2) telematics + GPS — the always-on behavior data spine that feeds coaching, maintenance, and safety analytics; (3) AI dashcam and video telematics — adds visual evidence and real-time driver behavior detection with in-cab coaching; (4) incident management — ties dashcam, telematics, DVIR, and maintenance records into cross-referenced post-crash evidence packages; (5) driver management — qualification files, coaching workflows, and safety scorecards that use data from the layers below; (6) analytics and reporting — the cross-system visibility layer that only works when the underlying data flows are clean. Fleets that start with dashcams before DVIR often end up with excellent video of incidents and fragmented mechanical records — a weak position for both insurance defense and DOT audit response. Individual fleet sequencing may vary based on current gaps and immediate risk exposure.
Does AI dashcam replace DVIR inspection?
No. AI dashcams and digital DVIR systems capture fundamentally different data types and answer different operational questions. AI dashcams capture driver behavior during operation (distraction, drowsiness, phone use, harsh events) and road-facing video (following distance, lane departure, near-collisions). AI dashcams cannot see the pre-trip walk-around and cannot document mechanical defects that would only be visible during static inspection: brake condition, tire tread depth, lighting function verification, coupling engagement, cargo securement, air leak testing. Under 49 CFR 396.11 and 396.13, the driver vehicle inspection report requirement covers specific mechanical inspection categories that only physical walk-around inspection satisfies — the regulation is not addressed by video coverage of the driving activity. Fleets running AI dashcams without digital DVIR have excellent behavior data and gaps in mechanical condition documentation. The two layers are complementary, not substitutable. The 2026 CSA methodology overhaul reinforces this: the "Driver Observed" split within Vehicle Maintenance BASIC scores separately those violations that drivers should catch during walk-around, making DVIR quality directly visible in BASIC scoring alongside dashcam-captured driving behavior.
How much does a full fleet safety technology stack cost?
Full fleet safety technology stack costs vary significantly by layer selection, fleet size, and vendor tier — but rough per-vehicle-per-month ranges as of 2026 are: telematics + GPS $20–$50; AI dashcam + video telematics $30–$80 including hardware amortization; digital DVIR + inspection $10–$30; incident management $10–$25 (often bundled with dashcam or telematics); driver management $8–$20; analytics + reporting typically included with one of the other layers rather than standalone. Total stack cost commonly runs $75–$200 per vehicle per month for a comprehensive layered deployment, plus one-time hardware and implementation costs. Individual fleet numbers depend heavily on which vendors are selected, bundled vs standalone pricing, hardware amortization approach, and negotiated volume terms. These are illustrative ranges rather than universal benchmarks — specific vendor pricing changes frequently and enterprise contracts often differ materially from published pricing. Fleet leaders evaluating stack cost should compare the aggregated stack expense against the documented industry outcomes (52% accident reduction, 5–20% insurance premium range) applied conservatively to their specific fleet's baseline exposure.
Where does HVI fit in the fleet safety technology stack?
HVI operates in the digital DVIR and inspection layer of the fleet safety technology stack — layer 3 in the typical six-layer architecture. Features cover the mechanical inspection and maintenance records functions: mobile-completed pre-trip and post-trip inspections with guided walk-around templates covering the 11 FMCSA-required categories under 49 CFR 396.11; photo capture with GPS and timestamp per defect; defect-to-work-order routing so flagged items reach the shop dashboard the moment the driver submits; storage of qualified periodic inspection records under 49 CFR 396.17; corrective action documentation tied to originating defect records; and searchable per-asset multi-year DVIR + maintenance history that integrates with the other stack layers for cross-referenced incident response and audit retrieval. HVI is not a telematics or GPS provider, AI dashcam manufacturer, insurance broker, safety consultant, driver coaching service, or FMCSA advocate. Telematics, video telematics, insurance underwriting, coaching programs, and specialized safety consulting remain with providers that operate in those specific stack layers. What HVI provides is the DVIR + inspection + maintenance records layer that captures what AI cameras cannot see and produces the mechanical condition records that the other layers reference for incident response, audit defense, and CSA BASIC management.
Build the DVIR + inspection foundation your safety stack depends on
Dashcams capture behavior. Telematics capture location and vehicle data. HVI captures what they can't see — the mechanical defect at pre-trip walk-around — and produces the records the rest of your stack references for incident response, audit defense, and CSA management.
No credit card · No hardware · Setup in minutes