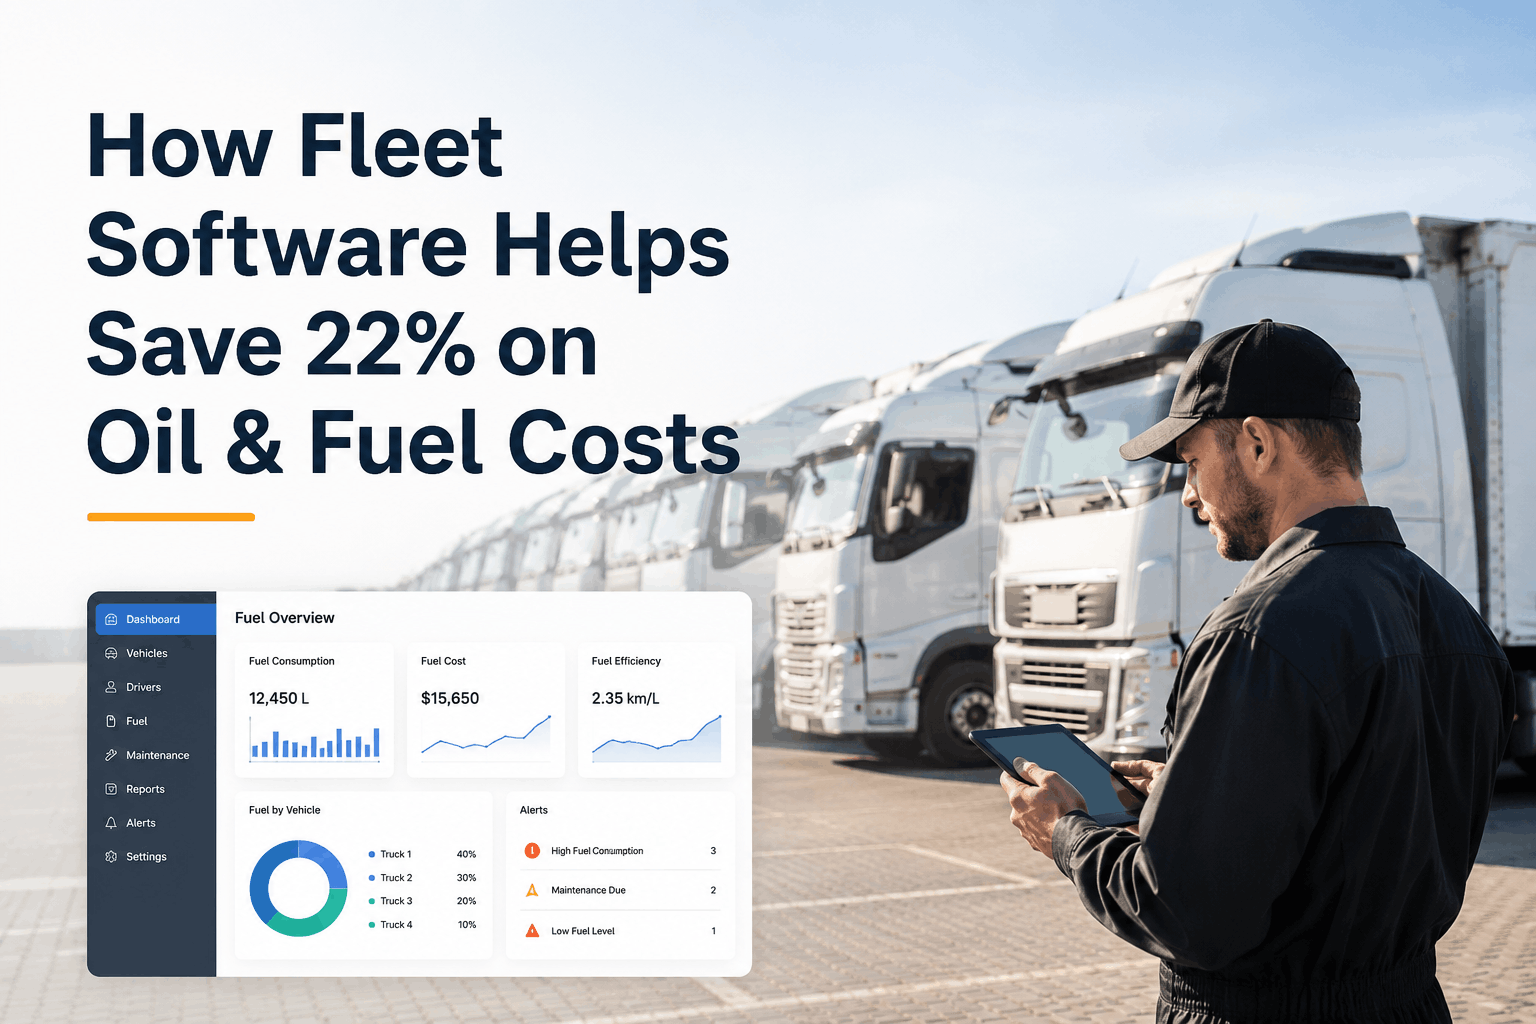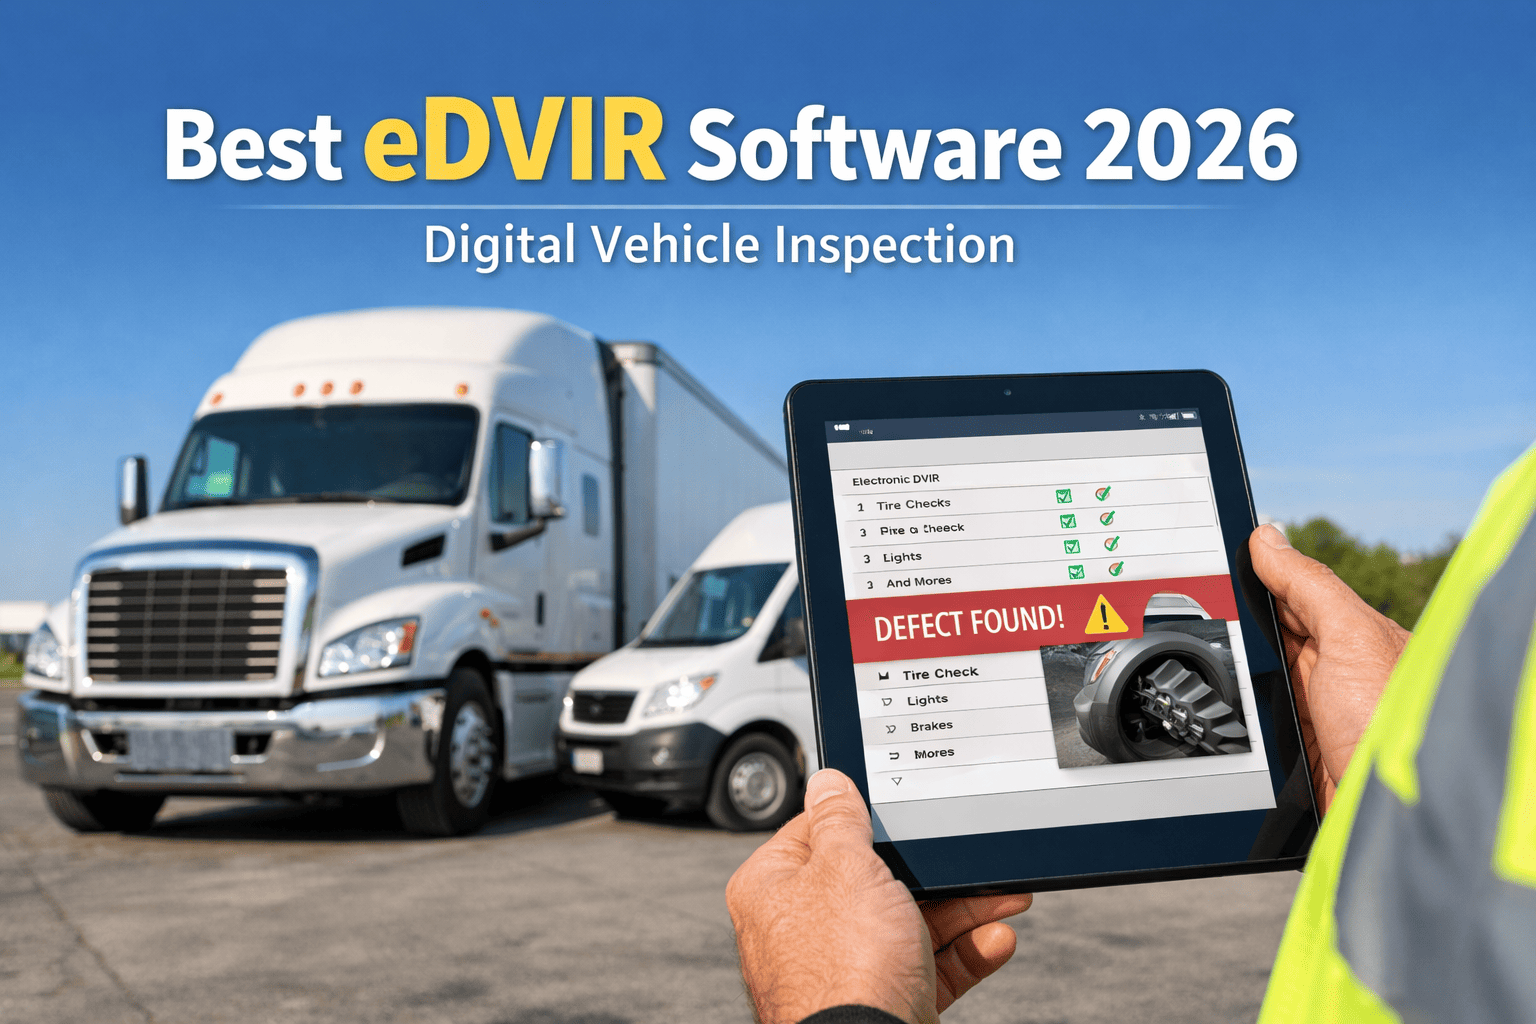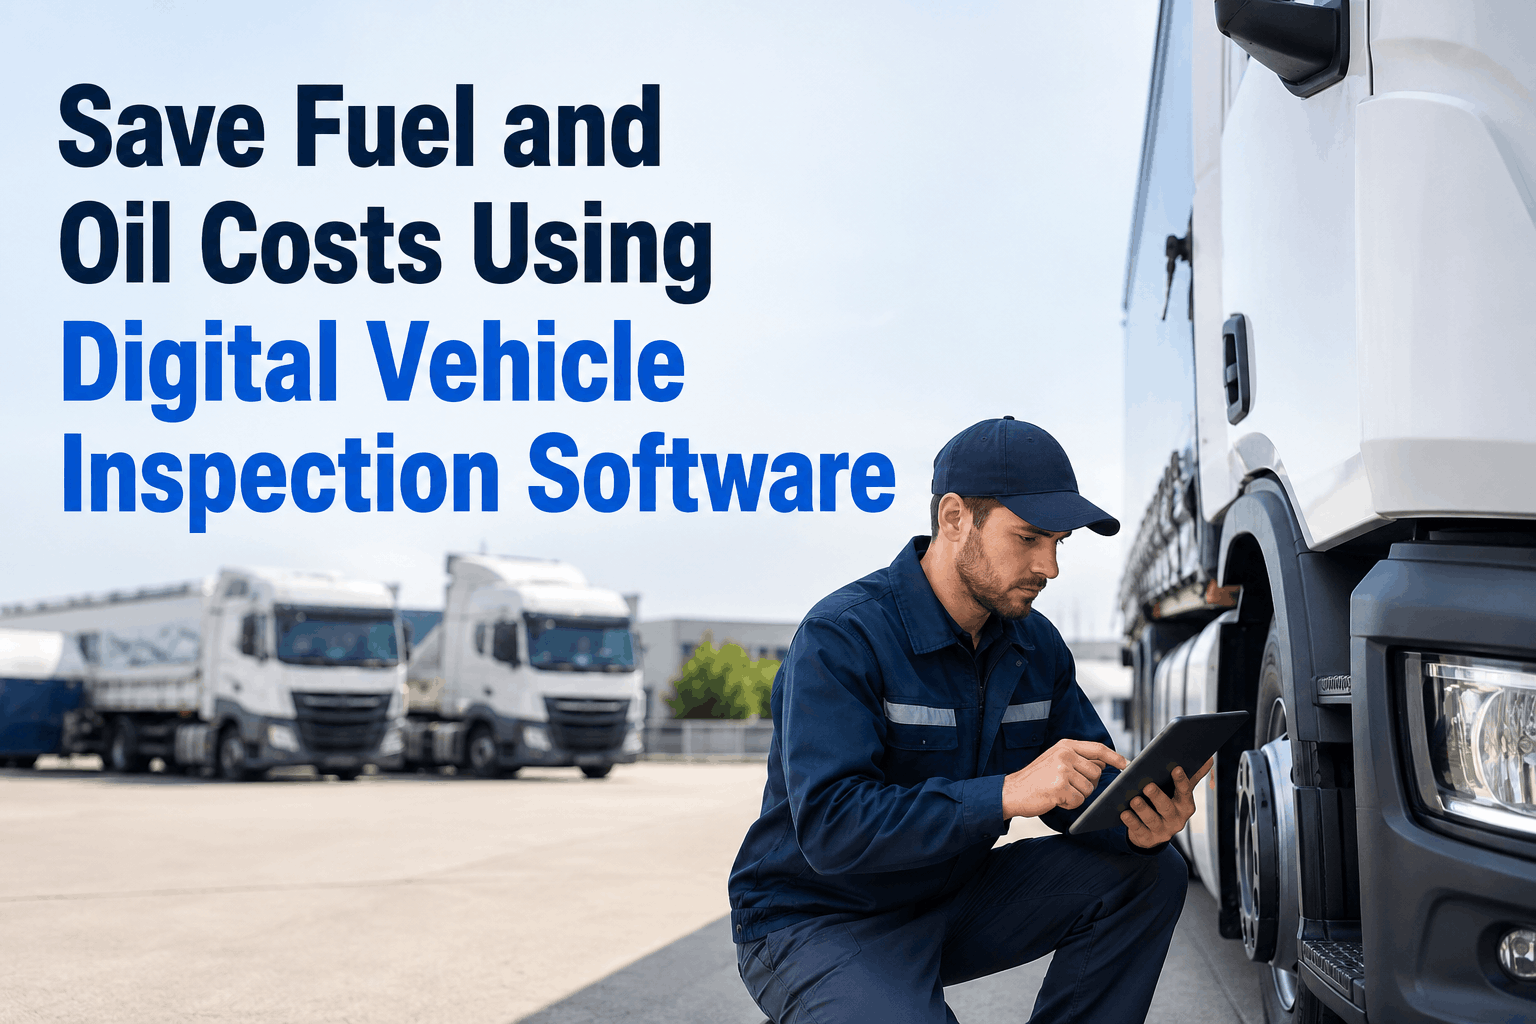
The single most overlooked fuel-saving tool in commercial fleets is also the cheapest one already in your operation — your daily vehicle inspection. The problem is that when that inspection lives on paper or in a driver's memory, it stops being a savings mechanism and becomes a compliance ritual. Digital vehicle inspection software changes the economics by enforcing what gets checked, capturing photo evidence, routing defects to maintenance automatically, and surfacing patterns that paper inspections lose. Fleets that move from paper DVIRs to a proper digital inspection workflow typically see fuel and oil costs drop 8–14% within the first 90 days — not from telematics or route changes, but from catching mechanical issues earlier in their lifecycle. This article walks through how digital inspections actually convert into fuel and oil savings, the leak-detection taxonomy drivers should be looking for, a 24-hour timeline showing what one shift's inspections prevent, and the fleet-size ROI math. Start your free HVI trial to put guided eDVIRs on every driver, or book a demo for a fuel-specific ROI breakdown across your fleet.
A day in the life — what one shift's digital inspection prevents
The clearest way to understand how inspection software saves fuel is to walk through what actually happens at a single yard, on a single morning, when the workflow runs the way it's supposed to. Six drivers. Six inspections. Six different defects caught. Tracking only the fuel and oil consequences of what would have happened if those defects had gone uncaught for another day, week, or month.
26% under-inflated. At 80,000 mi/yr, that one tire alone costs roughly 6% MPG on this position. Photo evidence captured, work order auto-routes to shop. Topped off before dispatch.
$60 hose replacement at the shop today. Without the photo capture, the seep becomes a roadside overheat in 2–3 weeks: tow + head gasket inspection + emergency repair averages $3,800.
Software flags the trend per VIN. Truck normally consumes 1 qt every 5,000 mi; current rate is 1 qt every 600 mi. Compression test scheduled before the wear cascades into a $12,000 rebuild.
Restricted intake = rich combustion = 3–8% MPG loss. Filter replacement is a $48 part. The yellow-zone catch prevents two months of fuel waste before the next scheduled PM.
A dragging caliper burns 2–5% MPG continuously. Driver enters "wheel runs hot at stops" — work order escalates to brake inspection. Without the digital capture, the issue gets reported verbally and lost.
Crystallized DEF on a fitting signals a small leak. SCR fault would have triggered within days, escalating to 5 MPH limp mode. Fitting tightened in 10 minutes — derate never starts.
The 5 fuel leaks digital inspection actually catches
Every commercial vehicle has the same five categories of fuel-stealing defects. They show up in different ways and at different rates, but they're consistently the highest-impact items a daily inspection can surface. Knowing the signature of each lets drivers — and software — flag them earlier.
Signature: Visual sag on one side of the truck. Audible hissing at glad-hands. Compressor running constantly. Pressure gauge readings below spec.
What inspection software does: Required-field gauge entry on every tire. Photo of the gauge attached. Trends per VIN catch slow leaks at the 5-PSI mark instead of the 30-PSI mark.
Signature: Drip patterns on the ground after a 20-minute stop. Wet seams on the engine block. Crystalline residue (DEF) or sweet smell (coolant) or diesel odor (fuel) around the affected area.
What inspection software does: Underbody photo required at pre-trip. Slow seeps become visible to maintenance through the photos — paper would have missed them.
Signature: Yellow or red zone on the restriction indicator. Sluggish acceleration. Black exhaust on hard throttle. Reduced power notification on dash.
What inspection software does: Restriction indicator is a required check on the inspection. Yellow-zone entry creates a non-blocking flag; red-zone creates a blocking work order that prevents dispatch.
Signature: Vehicle pulls during deceleration. One wheel running hot at stops. Uneven tire wear pattern. Steering pull on highway. Vibration at certain speeds.
What inspection software does: Drive-impression field on the inspection — drivers note anything that "feels wrong." Heat-sensing during walk-around catches dragging brakes before they cost weeks of fuel.
Signature: Engine-hour or odometer reading past service interval. Filter color darkened beyond spec. Oil analysis showing wear-metal trends.
What inspection software does: PM intervals fire alerts on actual engine hours, not calendar memory. Late oil changes thicken oil and steal MPG — software prevents this category entirely.
The fuel cost stack — where the savings actually accumulate
Different defects compound at different rates. The cost stack below shows how a typical truck's fuel waste builds up across the five categories above, and how digital inspection software intercepts each one. The percentages don't always add cleanly — fixing one issue often resolves contributing problems in another — but the cumulative impact across a fleet is consistently in the 8–14% range.
Three things that make inspection software actually save fuel
Not every "digital DVIR" product delivers these savings. Some are little more than electronic versions of the same paper form. The three capabilities below separate inspection software that actually reduces fuel and oil costs from software that just digitizes the paperwork.
If the driver can submit the inspection without entering tire pressure, fluid levels, or filter status, the form will get marked "OK" every time and the savings disappear. Real DVI software refuses submission until every category shows actual data — not memory.
Slow leaks, hose damage, and filter restriction all become visible to maintenance through photos that paper-based reporting cannot transmit. Photo capture forces drivers to actually look at the component instead of clicking through a checklist.
One inspection in isolation is just a snapshot. Per-VIN history reveals patterns — oil top-off frequency doubling, repeat brake complaints on the same wheel, recurring soft tire on the same position. Patterns are where 30–40% of the fuel savings live.
ROI by fleet size — what 12% savings looks like in real numbers
The savings percentage holds roughly constant; the dollar value scales with fleet size. Below is what 12% combined fuel-and-oil reduction translates to at three typical fleet sizes, with 2026 diesel at $4.15/gal and a baseline 6.5 MPG Class 8 truck running 80,000 miles per year.
How HVI delivers these savings — the inspection workflow that actually works
HVI is purpose-built around the inspection-and-maintenance side of fleet operations. Every feature in the platform maps to one or more of the fuel-and-oil savings categories above, and the workflow is designed so a thorough pre-trip takes 5–12 minutes on the smartphone every driver already carries.
Drivers cannot submit the inspection until every fuel-impact category — tire pressure, fluid levels, filter status, leak check — shows actual data. No more "OK" across the board. The savings start at submission #1.
Any "Fail" tap requires a photo. Slow oil seeps, weeping coolant hoses, restricted filters, and crystallized DEF residue all become visible to maintenance through documented evidence — the kind paper systems lose.
Driver flags, work order auto-creates, technician sees it before the next shift. The 1.8-day average paper-DVIR delay disappears — and so does the fuel waste that builds up during that delay window.
Oil, filter, and DEF service intervals fire alerts on actual usage data, not calendar reminders. PM compliance climbs above 95%, and the 1–8% MPG impact of late servicing simply stops happening.
Every inspection, defect, repair, and PM service indexed by vehicle. Oil-consumption trends, repeat defect patterns, and cost-per-mile per truck all become visible — turning vague "this truck has been weird lately" into actionable data.
Remote yards, rural depots, and cellular dead zones still capture full inspections. Data syncs when signal returns. No lost defects, no missed fuel-savings opportunities because of a connectivity gap.
HVI runs independent of any specific telematics or ELD platform — it's the inspection-and-maintenance backbone of your fuel-efficiency stack, not a competitor to your other fleet tools. Schedule an HVI demo to see a fleet-specific rollout plan and ROI projection.
Frequently asked questions
Stop treating digital inspections as a compliance task. Start treating them as your fuel and oil cost reduction engine.
HVI ties every defect, leak catch, PM alert, and repair to per-VIN cost data — so the savings stop being theoretical and start showing up on your monthly fuel report. No hardware, no IT lift, measurable ROI within 30 days.
No credit card required · Fuel/oil ROI breakdown in 30 minutes · Per-VIN cost tracking from day one