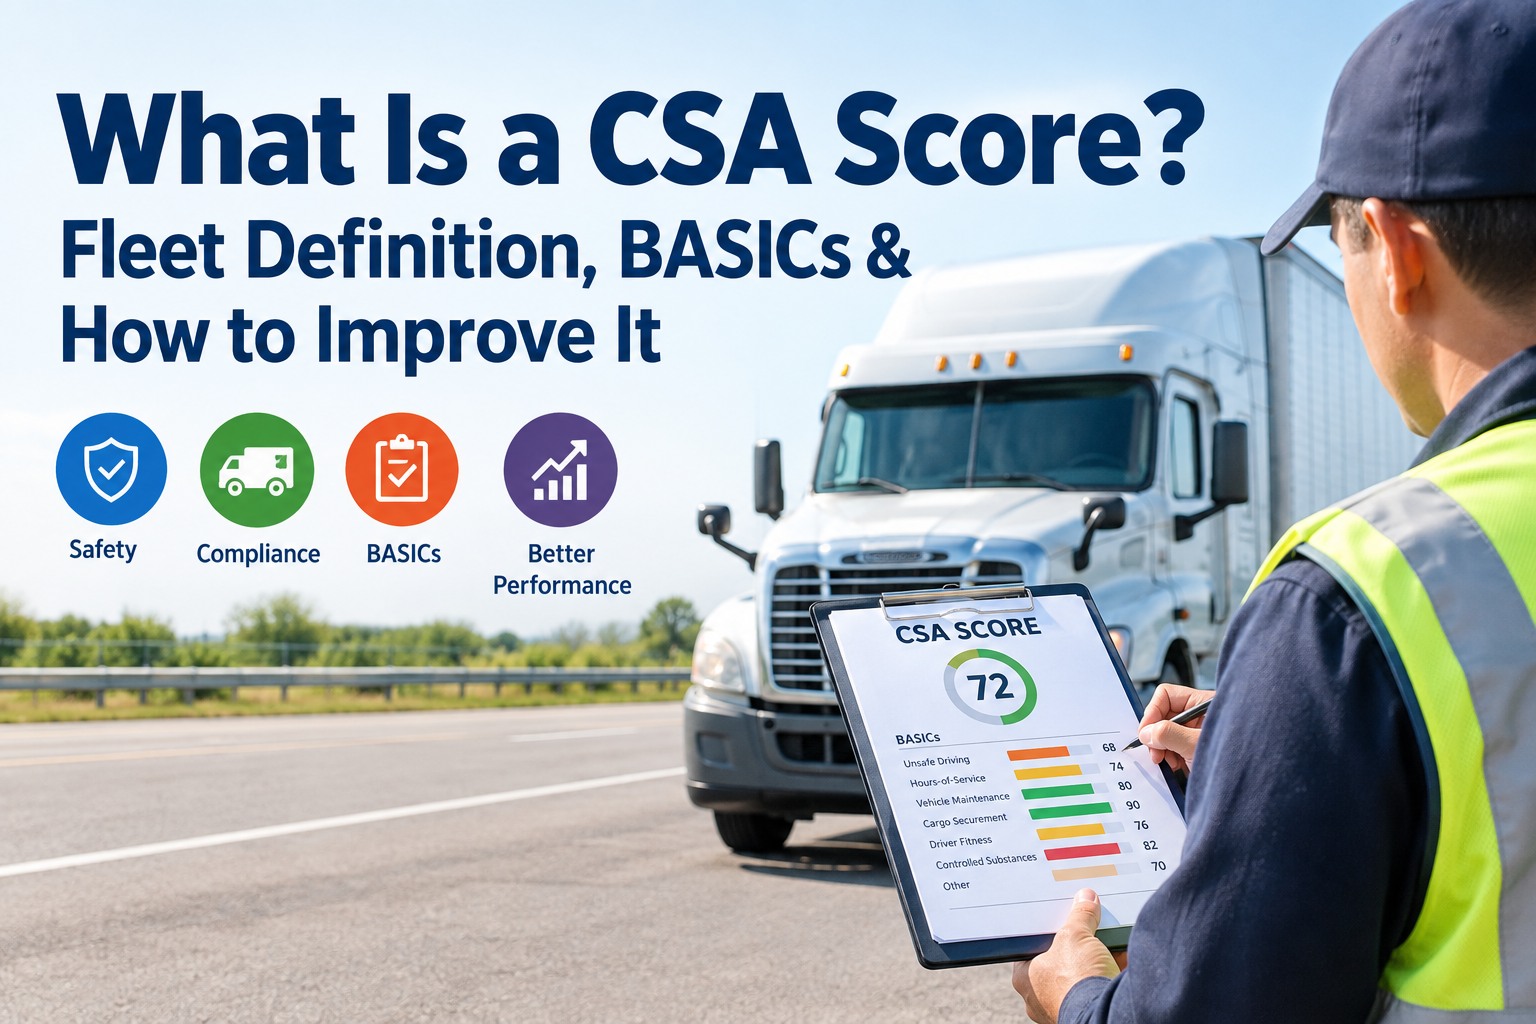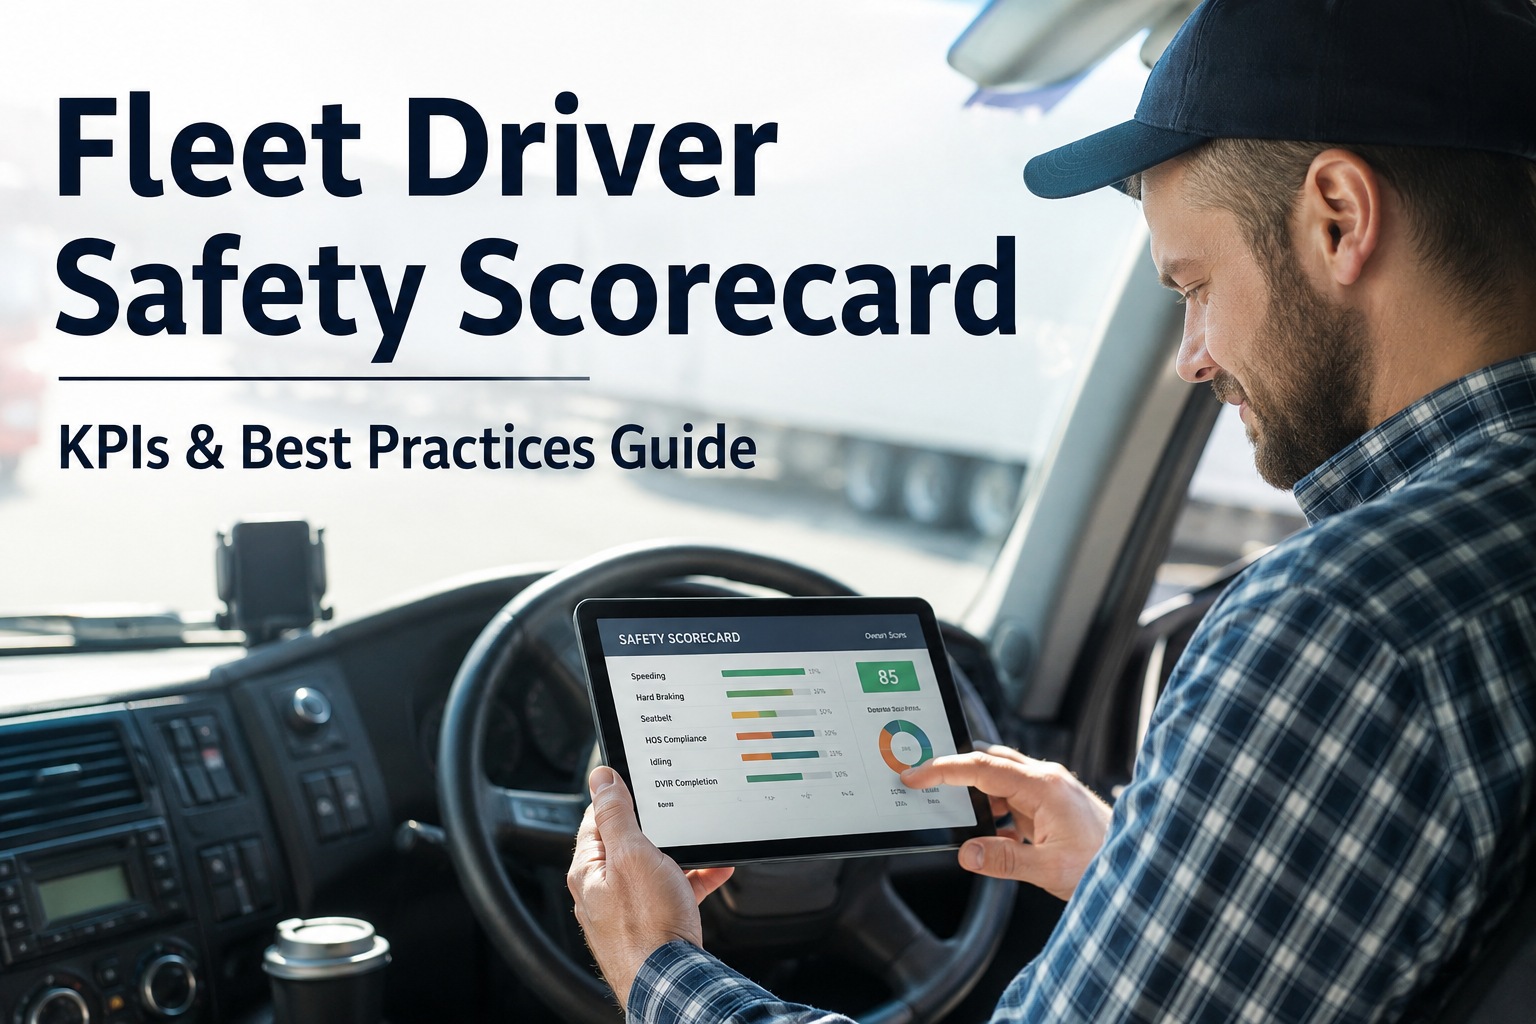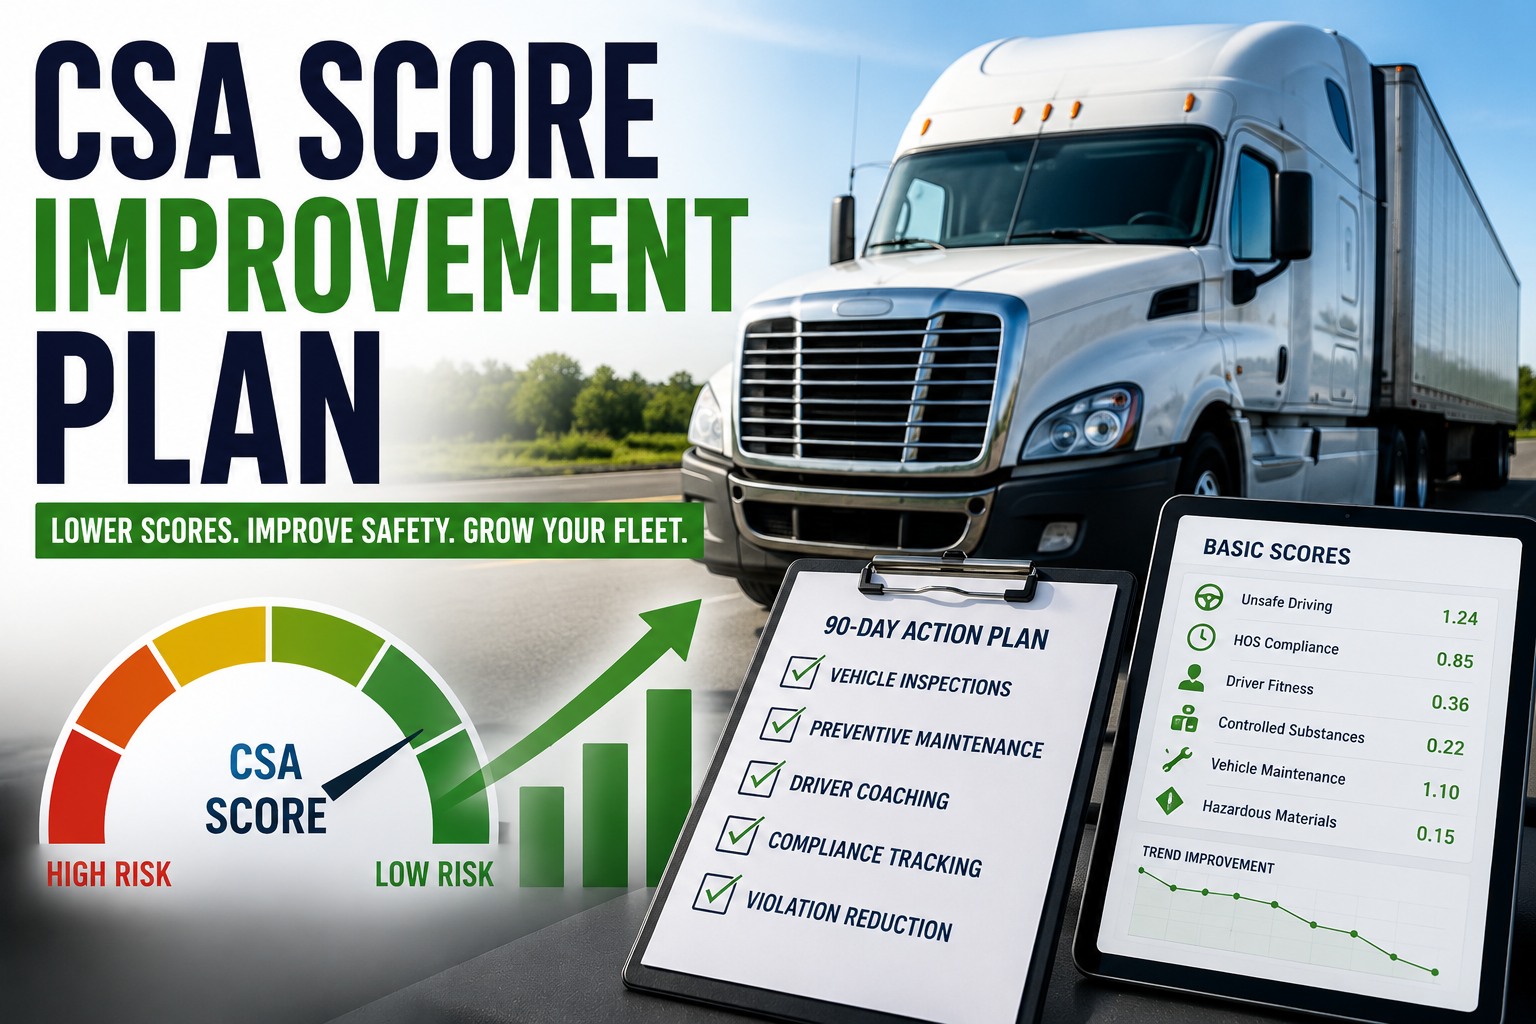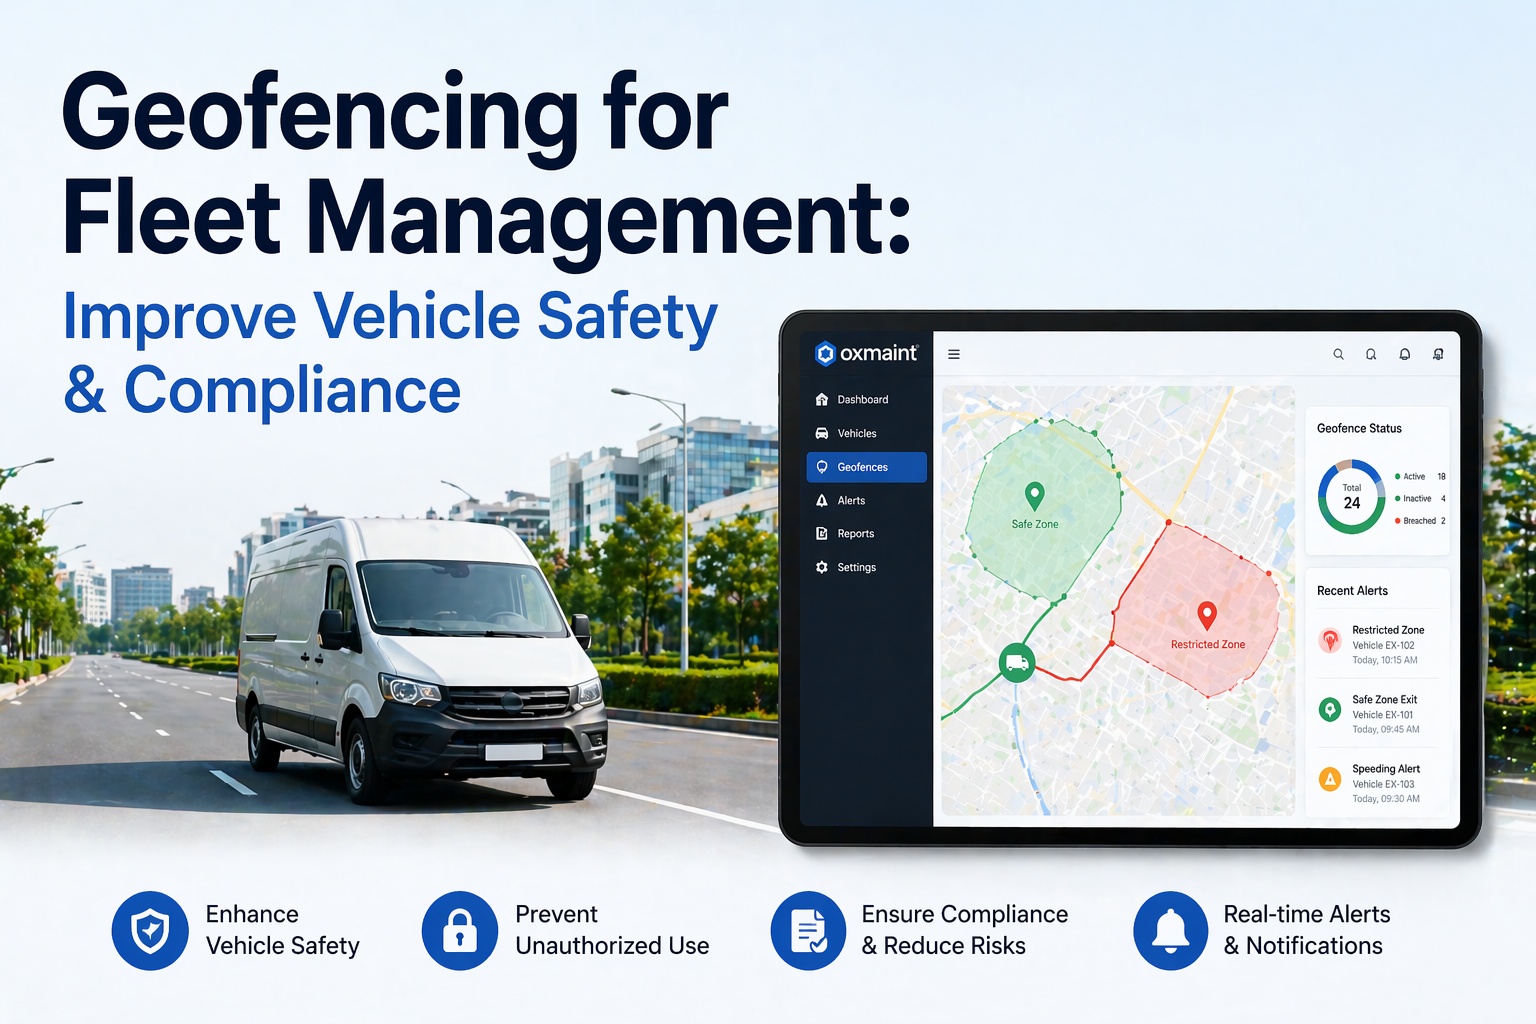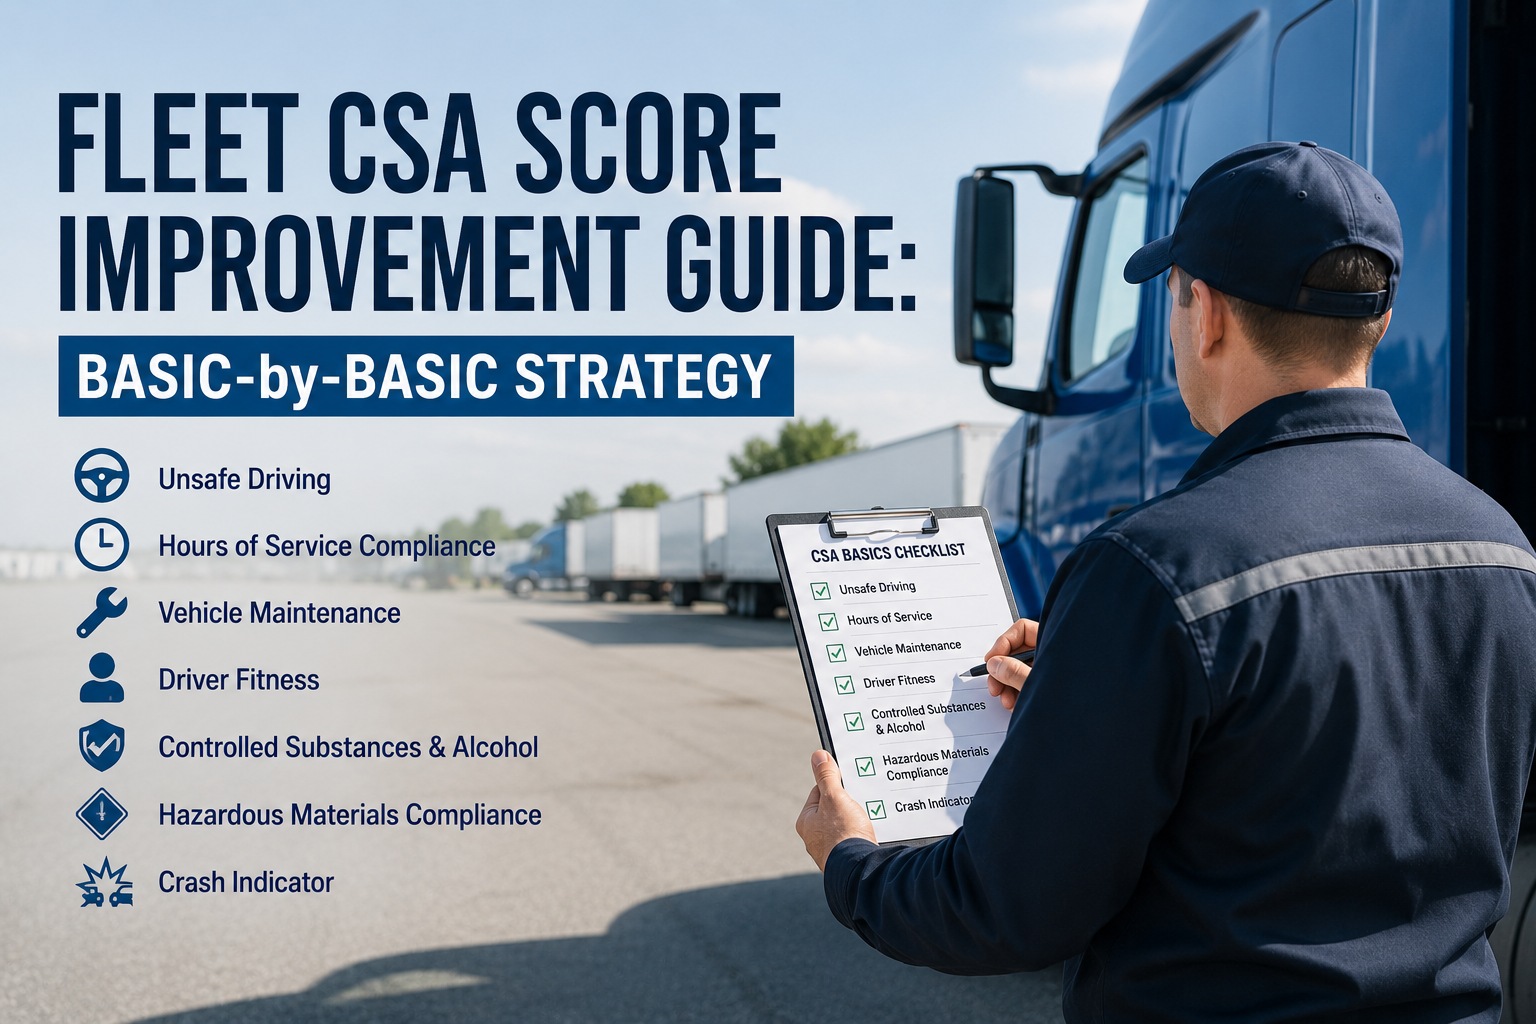
Your CSA score is your fleet's public safety credit report — and unlike your DOT authority or your MC number, it's a moving target that updates monthly based on every roadside inspection, crash, and compliance investigation on your record. Every broker, insurer, shipper, and FMCSA investigator can pull it up. Elevated percentiles in any of the seven Behavior Analysis and Safety Improvement Categories (BASICs) trigger a cascade of consequences: warning letters, targeted roadside inspections, compliance reviews, insurance surcharges of 30–50%, non-renewals and lost freight relationships. Under the 2026 CSA overhaul, out-of-service violations now carry double weight, Vehicle Maintenance was split into two categories, and the counting window dropped to 12 months — meaning your score responds faster to improvement AND to violations. This guide walks through the BASIC-by-BASIC strategy that best-in-class fleets use to drive percentiles down and hold them there. Book a demo when you want to see it modeled on your DOT number.
The 7 BASICs FMCSA scores you on
Each BASIC has its own intervention threshold. Cross the threshold in any one and FMCSA starts paying attention.
How CSA percentile scoring actually works
CSA scores are percentile rankings from 0 to 100, calculated within FMCSA's Safety Measurement System (SMS) and updated monthly. Lower is better. A percentile of 15 means you're safer than 85% of comparable carriers. A percentile of 82 means 82% of comparable carriers outperform you — and FMCSA is likely paying attention.
Most fleets are surprised to learn their CSA score isn't a single number; it's seven independent percentiles with different consequences. Book a demo to see all seven percentiles on one dashboard
What happens when you cross a threshold
FMCSA doesn't intervene with a single warning — it escalates. The intervention ladder below shows what happens as a BASIC percentile stays above threshold, and what each stage actually looks like operationally.
Certified mail from FMCSA identifying which BASIC crossed the threshold and requesting a response. No fine, but the letter is now part of your compliance record. This is your last "quiet" warning.
Your DOT number gets flagged in the Inspection Selection System (ISS-D). Weigh station inspectors see the flag and prioritize your trucks. Result: more inspections, more chances to accumulate violations, downward score spiral.
FMCSA requests documentation on the specific BASIC. DVIRs, driver files, drug testing records, maintenance history — whatever the compliance category demands. Documentation gaps here are ~40% of preventable escalation.
FMCSA investigators arrive at your terminal. They audit the specific BASIC in depth — observing operations, interviewing staff, pulling physical records. Findings feed a "cooperative safety plan" or civil penalty.
Full safety fitness determination review. Every operational area audited. Outcome can be a "Conditional" or "Unsatisfactory" safety rating. Unsatisfactory triggers a 45-day corrective window before operating authority is revoked.
The ladder is designed to give fleets multiple chances to self-correct, but every rung comes with real costs — documentation labor, legal fees, insurance impact, lost freight. The economics strongly favor staying off the ladder entirely. Book a demo to see the exposure score dashboard
The 4 priority BASICs: fix these first
Not all BASICs are equally influenced by operational change. These four respond fastest to disciplined process improvement — and together they account for the majority of intervention triggers across the industry.
The behavior-behind-the-wheel BASIC
- Speeding (15+ mph over posted limit is highest severity)
- Lane change / following too closely
- Reckless or aggressive driving
- Seat belt not fastened
- Improper use of hand-held device
- Telematics + video (drive-cam) coaching program
- Driver scorecard tied to safety KPIs
- Monthly safety meetings with real violation review
- Speed governor / geofenced speed limits
- Post-event coaching within 24 hours of any incident
The scheduling + ELD BASIC
- 14-hour on-duty window exceedance
- 11-hour driving limit exceedance
- 30-minute break violations
- False RODS / ELD tampering (2026 focus)
- Unassigned driving time on ELD
- ELD provider on FMCSA's registered device list
- Dispatch software that validates HOS before assignment
- Monthly ELD audit for unassigned time & edits
- Driver ELD training refresher every quarter
- Verify ELD not on FMCSA's revoked-device list
The inspection + PM BASIC
- Brake defects (24.4% of vehicle OOS violations)
- Tire condition — tread, damage, inflation
- Lighting & reflector defects
- Cargo securement failures
- Suspension & steering issues
- Digital DVIR with mandatory brake/tire/light questions
- Meter-triggered PM automation
- Any "unsafe" defect auto-locks vehicle from dispatch
- Photo-verified defect closeout
- Complete annual DOT inspection documentation
The credential + qualification BASIC
- Expired or missing CDL
- Expired medical examiner's certificate
- Missing / incomplete driver qualification file
- Wrong CDL class for equipment operated
- Missing endorsement (hazmat, tanker, passenger)
- Automated 90/60/30-day expiration alerts
- Digital DQ file with completeness checks
- Auto-block dispatch when credential expires
- Annual DQ file audit built into onboarding
- Direct integration with National Registry (medical)
The 3 specialty BASICs: Controlled Substances, HM Compliance, Crash Indicator
Three BASICs sit outside the daily operational discipline but can still trigger intervention. Understanding them protects against blind spots.
Drug & alcohol program compliance
Random testing pool eligibility, pre-employment testing, post-accident testing, and FMCSA Clearinghouse query compliance. A single violation carries an outsized weight because these violations are relatively rare. Many brokers refuse to work with carriers that have any substance-related violation on record, regardless of overall percentile. Fix: automated Clearinghouse queries, DOT-compliant random testing consortium, documented pre-employment full query on every driver.
Only applies to placardable HM carriers
Loading & securement of HM cargo, shipping papers accuracy, placarding, hazmat driver endorsement, and hazmat-specific training records. In 2025, loading violations alone accounted for 28.8% of all HM OOS violations. Fix: HM-specific pre-trip checklist, digital shipping paper verification, annual hazmat training documentation, security plan on file.
Historical crash frequency & severity
State-reported crashes over the trailing 24 months, weighted by severity. Not-preventable determinations via FMCSA's Crash Preventability Determination Program can remove qualifying crashes from your measure. Fix: forward-facing dash cam evidence on every truck (essential for Not-Preventable claims), immediate post-crash documentation protocol, driver defensive-driving training, and a formal crash review board.
These three BASICs get less daily attention than the priority four, but each one can independently trigger intervention. Start a free trial to see how a unified compliance dashboard covers all seven categories in one place.
The 90-day CSA improvement roadmap
Cutting CSA percentiles is a stacked sequence — assessment first, then quick wins, then systemic fixes, then documentation. Here's the exact 90-day plan that best-in-class fleets run to move from an average to a low-percentile carrier.
- Pull current CSA scores from csa.fmcsa.dot.gov — document percentile in each BASIC
- Identify BASICs above 50th percentile as priority focus
- Audit every driver's CDL, medical, and DQ file — fix expired items immediately
- File DataQs challenges on any incorrectly attributed violations
- Deploy digital DVIR with mandatory brake / tire / light questions
- Meter-triggered PM automation deployed — every truck on a schedule
- 90/60/30-day credential expiration alerts running for all drivers
- Monthly ELD audit process live — unassigned time & edits reviewed
- Driver coaching program with monthly safety scorecards
- Photo-verified defect closeout workflow in place
- Complete safety program written & adopted (unlocks 5–15 point CSA reduction potential)
- Formal crash review board established with dash cam evidence protocol
- Annual DOT inspections documented & searchable
- Live CSA percentile monitoring dashboard with monthly trend review
- Documented improvement trajectory for insurance renewal negotiations
Fleets that run this 90-day plan consistently report a 10–25 percentile reduction across their priority BASICs within one quarter, and a 30–50 percentile reduction within a year. Start a free trial to load the DVIR templates and PM automation into your fleet this week.
Best-in-class CSA benchmarks: what an A-grade fleet looks like
The gap between an average fleet and a best-in-class fleet is entirely operational. Here's the metric-by-metric comparison across the priority BASICs.
The gap between average and best-in-class isn't in the vehicles or the drivers — it's in the operational discipline stack that produces clean inspection records month after month. Book a demo to see the discipline stack live on your DOT number
From a safety manager who moved a fleet from 68th to 22nd percentile in Vehicle Maintenance
We were 68th percentile in Vehicle Maintenance — three points from the intervention threshold. Warning letter had already come in the mail. My CFO was quoted an 18% insurance increase at renewal and my broker was giving me the "you should really fix this" talk before we even got to the price conversation.
The move was digital DVIRs with mandatory brake and tire questions. First 60 days took us to 45th percentile just by catching things before they got to a roadside inspection. Adding meter-triggered PM and credential tracking pulled us to 22nd percentile over the next 6 months. Insurance came back flat instead of up 18%. That single line item paid for the software 15 times over.
The bottom line on CSA score improvement
CSA score is not a compliance metric — it's a leading indicator that shows up on every insurance renewal, every broker vetting, and every FMCSA enforcement decision. The seven BASICs each have their own intervention threshold, but four of them (Unsafe Driving, HOS, Vehicle Maintenance, Driver Fitness) respond fastest to operational discipline and account for the majority of intervention triggers. The 2026 CSA overhaul made this harder in some ways (OOS violations weighted 2×) and easier in others (12-month window means clean quarters compound faster). The 90-day roadmap of assessment, quick wins, systemic fixes, and documentation moves a typical carrier from average to low-percentile within a quarter, and to best-in-class within a year. The compliance software stack that runs the whole thing pays for itself in the first insurance renewal cycle. CSA improvement isn't a compliance exercise; it's the highest-ROI operational discipline available on any DOT-regulated fleet in 2026.
Frequently asked questions
What is a good CSA score for a fleet?
CSA scores are percentile rankings from 0 to 100 where lower is better. A score of 15 means you're safer than 85% of comparable carriers. For the three high-crash-correlation BASICs (Unsafe Driving, HOS Compliance, Crash Indicator), the intervention threshold sits at the 65th percentile — so anything below that is generally safe from FMCSA attention, and anything below the 25th percentile is best-in-class. For the four other BASICs (Vehicle Maintenance, Vehicle Maintenance: Driver-Observed, Driver Fitness, Controlled Substances/Alcohol), the intervention threshold is the 80th percentile, so scores below 40th are strong and below 20th are best-in-class. Insurance underwriters typically flag scores above the 50th percentile in any BASIC as a rate-increase trigger. Brokers doing carrier vetting often set their own cutoffs even more conservatively, particularly for the safety-critical BASICs. The right benchmark isn't a single number; it's tracking your monthly trajectory across all seven BASICs and confirming each one trends down over time.
How long does it take to improve a CSA score?
CSA scores update monthly based on rolling data, so improvement is visible within the first monthly refresh after new clean inspections and expired violations start dropping out of the calculation. Under the 2026 CSA methodology, violations count for 12 months (down from 24), which means the improvement curve is meaningfully faster than it used to be. Typical fleets implementing a full discipline stack — digital DVIRs, PM automation, credential tracking, driver coaching — see a 10–25 percentile drop across their priority BASICs within the first quarter, and 30–50 percentile drops within a year. The two variables that determine speed of improvement: how quickly you stop generating new violations (immediate impact) and how many old violations still count against you (12-month clock). Fleets that were carrying a heavy violation history from the 24-month legacy window will see slower initial improvement as old data ages off, but the trajectory accelerates through months 6–12 as those violations reach the cutoff.
What are the 7 CSA BASICs?
The seven Behavior Analysis and Safety Improvement Categories (BASICs) that FMCSA uses to score carriers are: (1) Unsafe Driving — speeding, reckless driving, lane change violations, with a 65% intervention threshold; (2) HOS Compliance — 14-hour, 11-hour, and 30-minute break violations, false RODS, 65% threshold; (3) Crash Indicator — frequency and severity of state-reported crashes over 24 months, 65% threshold; (4) Vehicle Maintenance — brake, tire, light, steering, and suspension defects, 80% threshold; (5) Vehicle Maintenance: Driver-Observed — new in 2026, scores DVIR quality and completeness, 80% threshold; (6) Driver Fitness — CDL, medical certificate, and driver qualification file compliance, 80% threshold; (7) Controlled Substances/Alcohol — drug and alcohol testing program and Clearinghouse compliance, 80% threshold. Hazardous Materials Compliance is a separate category applicable only to placardable HM carriers, generally at an 80% threshold. Each BASIC is scored independently, and crossing the threshold in any one triggers the FMCSA intervention cascade.
What changed in the 2026 CSA overhaul?
The 2026 CSA overhaul was the largest SMS methodology change since the program launched in 2010. Four major changes: (1) Vehicle Maintenance BASIC was split into a standard category plus a new "Driver-Observed" category that specifically scores defects that should have been caught on the pre-trip DVIR — making DVIR discipline directly measurable in your CSA score for the first time. (2) OOS violation severity weight doubled from 1× to 2×, meaning a single OOS event now moves your percentile more than it used to. (3) The counting window for new violations dropped from 24 months to 12 months, so both new violations and clean inspections hit your score faster than before. (4) Violation codes were consolidated from 950+ codes into approximately 116 violation groups, and severity weights were simplified from a 1–10 scale to a 1-or-2 scale (1 for standard, 2 for OOS). Additionally, FMCSA introduced "proportionate percentiles" that use exact inspection counts instead of safety event group cutoffs, reducing artificial score volatility from small data changes.
Does a bad CSA score affect insurance rates?
Yes — directly and materially. Commercial trucking insurance underwriters pull FMCSA SMS data during every renewal cycle and adjust premiums based on BASIC percentiles. Typical rate impacts: percentiles above the 50th in any BASIC generally trigger surcharges of 5–15% at renewal. Percentiles above the intervention threshold (65% for Unsafe Driving / HOS / Crash Indicator, 80% for the maintenance and driver BASICs) commonly trigger 30–50% rate increases, non-renewals, or surplus lines placement. Multiple BASICs above threshold can result in outright declination of coverage — and many carriers don't even see the declines because their broker never gets a quote back. On the upside, a documented trajectory of CSA improvement is a legitimate negotiating point at renewal. Fleets that moved from 65th to 25th percentile in Vehicle Maintenance over a 12-month period can typically negotiate flat or slightly reduced renewals even in a hardening market. Insurance is the single most measurable financial impact of CSA score, and it compounds year over year.
Move your fleet's CSA score below every intervention threshold — and hold it
HVI gives you digital DVIRs that score clean on the 2026 Driver-Observed BASIC, meter-triggered PM for Vehicle Maintenance, 90/60/30-day credential alerts for Driver Fitness, and a live CSA percentile dashboard that tracks all seven BASICs in real time. Live in under two weeks — typical payback in the first insurance renewal cycle.
No credit card · DOT/FMCSA-ready templates · Live CSA monitoring on every BASIC