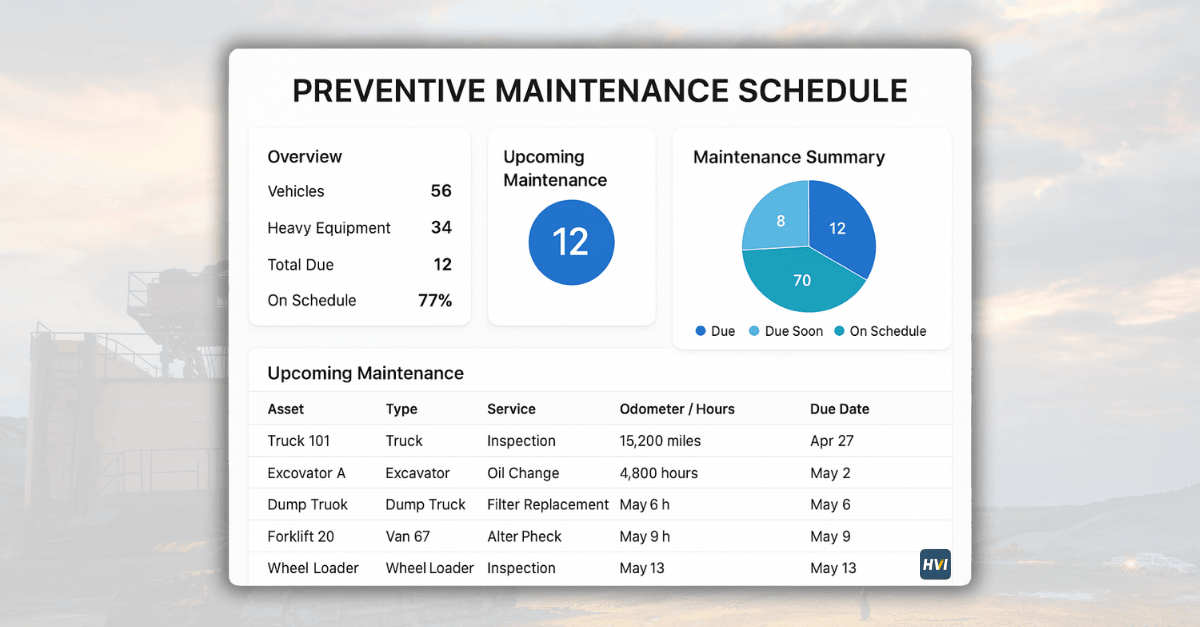
A fleet PM schedule that ran clean five years ago is almost certainly leaking money today. Duty cycles drift, meter accuracy erodes, service intervals hardcoded in 2019 don't match a truck now doing 40% more idle time. Fleet PM schedule optimization is the discipline of finding those leaks and re-tuning based on what your maintenance records actually say. This playbook walks the KPI audit, the interval adjustment framework, and the workload rebalancing that gets fleets from 70% PM compliance to 95%+. Book a demo to see optimized PM live.
The Numbers That Tell You Your PM Program Is Leaking
Here's what an average fleet looks like today vs where a leading fleet actually operates. The gap is where the optimization work lives.
If any of the four gauges above look uncomfortable, that's the starting point. Optimization isn't a rewrite — it's a series of targeted adjustments to the intervals, triggers, and workload distribution that already exist. The rest of this playbook walks the audit, the interval tuning, the workload rebalancing, and the KPI cadence that turns a 72% compliance fleet into a 95%+ one.
The 5 leaks in most PM programsFind these before you tune anything
Every fleet's PM engine leaks in more or less the same places. Fix these five and compliance moves faster than any interval retuning ever will. Book a demo to run this diagnostic on your live PM data
Calendar-only intervals on high-mileage units
A truck doing 120,000 mi/year on a 90-day PM is 15,000+ miles overdue at every service. Calendar-only worked when duty cycles were homogeneous. Modern fleets mix highway, urban, and idle time enough that meter or hybrid triggers catch what calendar misses.
Meter readings that update once a month (or never)
Without telematics, driver fuel-log, or DVIR meter capture, the PM engine is flying blind. A meter that hasn't updated in 45 days can't trigger a mileage-based service on time. This is the #1 cause of missed PMs on fleets that "have" meter-based scheduling.
Universal intervals across mixed duty cycles
Applying the same "15,000 mi B-service" to a highway hauler and a stop-and-go delivery truck ignores the physics. Group PMs by asset class and duty cycle, then set intervals per class — one universal interval optimizes for none of them.
PM triggers with no advance-warning window
A PM that fires the exact day the threshold is hit gives dispatch zero lead time to route the truck to a bay. Result: the PM slides 2 weeks, compliance drops. Set a 7-day / 500-mile warning window so parts and bay time can be scheduled ahead.
No feedback loop from failure history
If oil filter MTBF drops from 12,000 to 9,500 miles across a vehicle class, your interval should follow. Fleets that don't tie failure data back into interval tuning re-run the same failure pattern every quarter.
The 4-metric baseline auditMeasure before you tune — every time
Before adjusting a single interval, run this 4-metric baseline. These are the numbers you'll re-measure in 60 days to prove the tuning actually worked. Everything else is noise until these four are solid.
The four metrics above are the honest scorecard for any PM program — and the numbers you'll benchmark against 60 days after tuning. Book a demo to see all four calculated live from your fleet data
The interval adjustment frameworkData-driven, not opinion-driven
Once you have your baseline, adjusting intervals is a repeatable framework, not a hunch. Every change ties back to one of three signals from your maintenance records. Book a demo to see the framework applied to your live data
Every adjustment gets tagged with the signal that drove it, so 6 months later you can see which tuning changes worked and which ones didn't. Optimization without traceability is just guessing.
Workload balancing across the shopThe overlooked half of PM optimization
Interval tuning only works if the shop can actually execute the schedule. A perfectly optimized PM plan that produces 40 work orders on Monday and 3 on Tuesday isn't optimized — it's just moved the problem. Workload smoothing is the second half of the optimization job.
If every 90-day PM in your fleet fires on the 1st of the month, you get a monthly overload. Stagger the anchor dates across the calendar — group A on the 1st, group B on the 8th, group C on the 15th, group D on the 22nd — and the shop workload flattens without changing a single interval.
A 7-day / 500-mile advance-warning window doesn't just give lead time — it gives the foreman a 7-day slot to schedule the PM into a lower-workload day. Trucks flag as "PM due within 7 days," foreman drags them into open bay slots.
Route all diesel-engine A-services to your diesel-certified tech on Mondays. Batch tire and alignment work on Wednesdays. Batch aftertreatment DPF service on Fridays. Specialists complete work 30–40% faster than generalists on the same tasks — workload smoothing + specialization compounds.
Every scheduled PM in the 14-day forward window feeds an auto-generated parts pick list. Parts inventory reorders before the tech walks to the shelf, not after. Kills the #1 shop-floor delay: waiting on a part that should have been on the shelf.
Workload smoothing is the multiplier that turns tuned intervals into actual compliance gains. Book a demo to see the workload dashboard and the auto-generated parts forecast.
The weekly KPI review cadenceTrack thresholds, not averages
The difference between a fleet that tracks KPIs and one that improves KPIs is the review cadence and the threshold triggers. Monthly reviews catch trends 2–4 weeks after they matter. Weekly reviews catch them before the next PM cycle. Start a free trial and configure your own threshold alerts.
From a maintenance director who moved compliance from 71% to 96%
We thought our PM program was fine. Our compliance number was 71% and we told ourselves that was normal for a 96-truck operation. When we actually pulled MTBF data by component class, oil filter life had dropped 22% on the Cascadia fleet over 18 months and nobody had noticed — we were just adding to the emergency queue every week.
Optimization wasn't a rebuild. We shortened oil intervals on that class by 2,000 miles, staggered our PM anchor dates across the month, and set a Wednesday MTBF review. Six months later: 96% compliance, planned/unplanned ratio moved from 55/45 to 78/22, and cost per mile down $0.11. The data was always there. We just weren't looking at it weekly.
Frequently asked questions
What's a realistic PM compliance target for a mid-size fleet?
Industry benchmarks from 2026 fleet KPI research place best-in-class at 95–100% PM compliance, "good" fleets at 85–94%, and everything below 85% in the "systemic problem" zone. The gap between 85% and 95% represents a 40–50% difference in breakdown frequency and 15–25% difference in cost per mile — for a 200-vehicle fleet, that's typically $200,000–$400,000 in annual savings. Most fleets that measure compliance for the first time land between 65% and 80%; getting to 90%+ typically takes 60–90 days of focused work on the five leaks covered above, with the remaining push to 95%+ taking another 60 days as workload balancing and interval tuning compound. The 10% rule is standard: a PM counts as "on time" if completed within 10% of the scheduled interval (within 3 days on a 30-day PM, within 500 miles on a 5,000-mile PM).
How often should I actually re-tune PM intervals?
Interval reviews should happen quarterly at minimum for full-fleet re-evaluation, but individual class adjustments happen as soon as the trigger data warrants — typically 4 weeks after a trend becomes visible. The framework is: rolling weekly MTBF review catches a downward trend on a component class; if the trend holds for 4 consecutive weeks with 15%+ decline, adjust the interval on that class immediately. Waiting a full quarter to react to a 4-week MTBF signal costs breakdowns that were avoidable. Conversely, don't adjust intervals reactively after a single failure — one failure is data noise, four weeks of failure trend is signal. The MTBF trend line is the honest arbiter between "PM interval is right" and "PM interval needs shortening."
Should I lengthen intervals if a PM keeps finding no defects?
Yes — but only after 20+ consecutive services with zero defects on the same component across the same asset class. One or two clean services is data noise; 20 in a row is signal that the interval is too aggressive. The classic candidate is a filter or fluid check where the original interval was set conservatively by an OEM recommendation and real-world wear is proving out much slower. Lengthen the interval by 25–30% and re-monitor for another 20 services — if defects still don't appear, lengthen again. This is where labor budget frees up for other work. The mistake to avoid is lengthening intervals on safety-critical items (brakes, steering, coupling) even with clean history — regulatory minimums (DOT annual, FMCSA 396.17, DVSA) always win over MTBF signals on safety components.
Does PM optimization work with a small fleet under 20 vehicles?
The framework works — but the data cadence is different. On a 200-vehicle fleet you have enough events per week to see MTBF trends clearly. On a 15-vehicle fleet you're working with smaller data samples, so trend signals take longer to become statistically meaningful (typically 8–12 weeks vs 4 on a large fleet). What doesn't change: the five leaks are the same, the four baseline metrics are the same, and the interval adjustment framework is the same. Small fleets often see faster compliance gains than large ones simply because a single admin can execute the workflow changes end-to-end without cross-team coordination. The 40–50% breakdown reduction from moving 85% → 95% compliance applies at every scale.
What's the fastest lever to move compliance from 70% to 90%?
In our experience with fleets running this optimization, the single fastest lever is fixing meter capture. Fleets that "have" meter-based PM but rely on manual entry once a month typically have PMs firing weeks late because the meter didn't reflect actual usage. Layer three meter sources in parallel — telematics feed daily, driver fuel-log entry per fill-up, DVIR odometer capture per inspection — and PM triggers fire when they should. This alone moves most fleets from the 70–75% range into the 85–90% range within 30 days without touching a single interval. The remaining push to 95%+ is where interval tuning, workload balancing, and staggered anchor dates come in — but meter accuracy is the foundation. Everything else optimizes downstream of it.
Optimize your fleet PM schedule with the data you already have
HVI's PM analytics surface every KPI in this playbook in real time: compliance rate, planned/unplanned ratio, MTBF trend by component class, availability, cost per mile. Threshold alerts fire the moment metrics cross your defined lines. Interval adjustments are one-click and tagged with the driver signal. Workload balancing built into the scheduler. Live in 1–2 weeks.
No credit card · No hardware · PM analytics live on day one