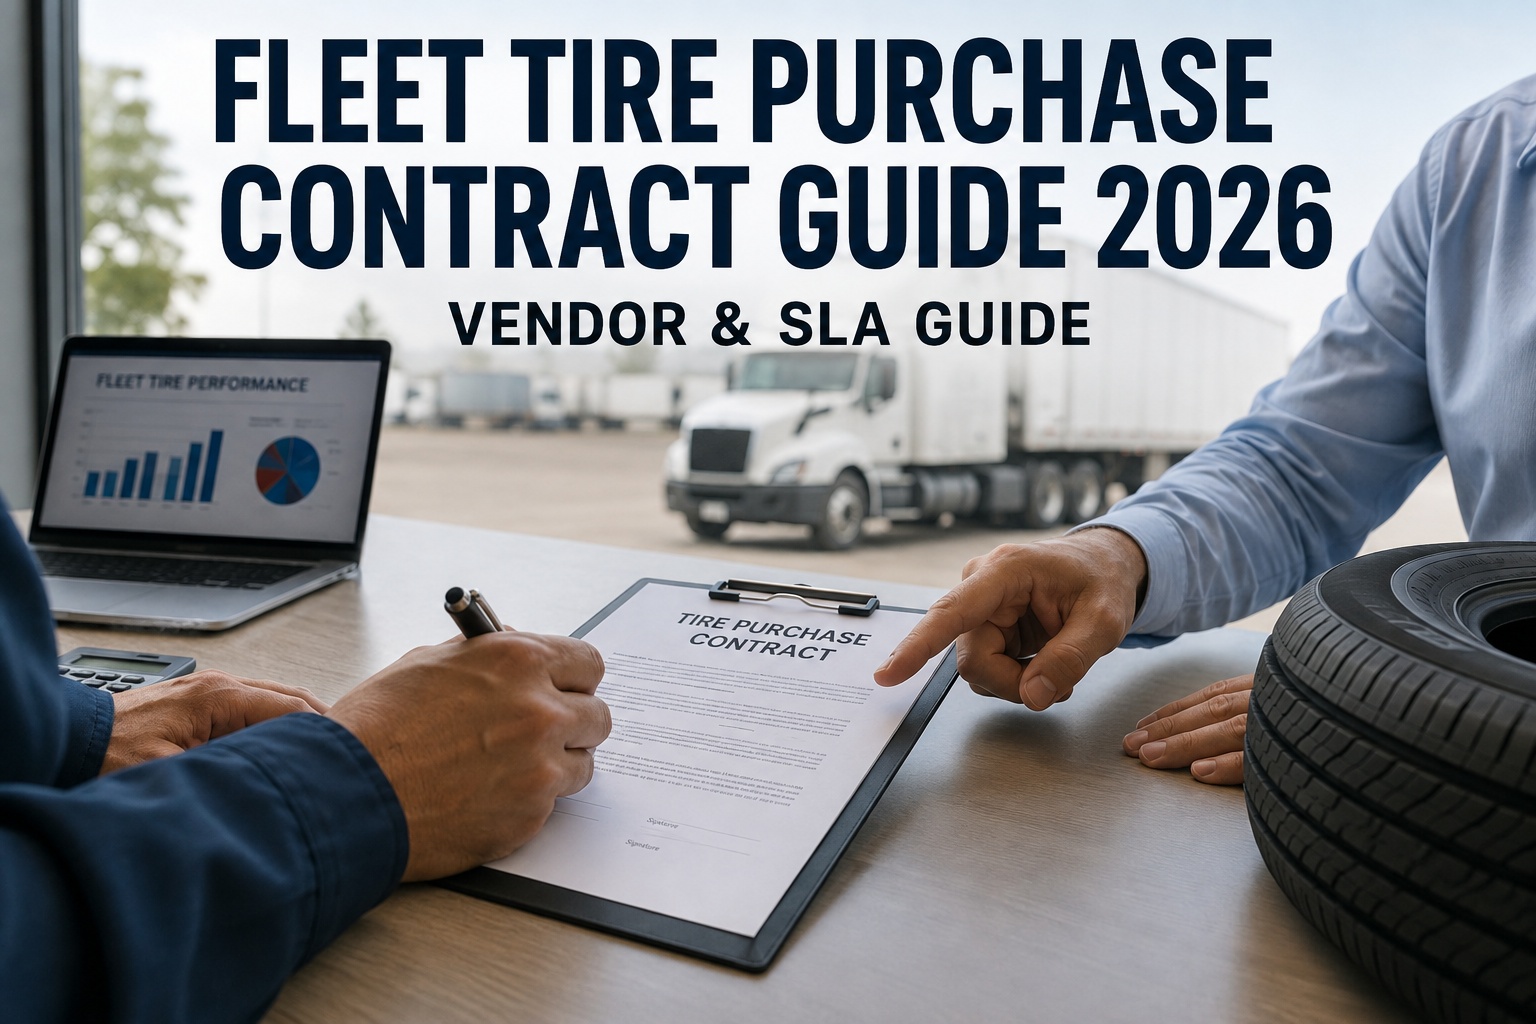
Most fleet tire purchase contracts are priced on one line item: dollars per tire, size by size. That's the number the CFO sees, the number the vendor's sales rep leads with, and the number that almost never determines what the fleet actually pays. Cost per mile does. Roadside response time does. Casing return economics do. This fleet tire purchase contract playbook walks through the seven clauses that separate a real procurement agreement from a wholesale price sheet. Book a demo
The unit price on your tire contract is a distraction. Seven clauses determine what you actually pay.
A well-structured 100-truck fleet tire contract saves 15-25% on total tire spend vs a price-only agreement — without any change in tire brand or fleet operation. The savings come from clauses most purchasing teams never negotiate: CPM SLAs, casing return economics, roadside response penalties, and vendor performance scorecards backed by fleet data.
The 7 clauses that determine total tire spend
A fleet tire purchase contract is not a price sheet. It's a service and economic agreement that runs for 12-36 months and touches every truck in the fleet. The clauses below are what separate the fleets paying $0.028/mile from the fleets paying $0.045/mile on identical equipment. Every purchasing manager should walk into the negotiation with these seven items written down.
The clauses compound. A contract with all seven properly structured typically delivers 15-25% lower total tire spend than a same-vendor same-brand agreement built around unit price alone — even when the unit prices are identical or slightly higher. Book a demo to see how HVI captures the data needed to enforce every clause in the list
Before & after — what a real procurement contract looks like
The gap between a typical vendor-drafted price sheet and a real fleet-drafted procurement contract is easier to see side by side. Below is the same fleet, same vendor, same tire brand — different contract structure.
Both contracts have the same tire prices. The right-hand contract typically delivers 15-25% lower total spend, because the 90% of tire economics that live outside the unit price are actually captured. Start free and build the per-tire history that lets you enforce clauses like these
The vendor scorecard — 6 KPIs the contract enforces
Every clause in the contract has a corresponding measurable KPI. Together they form the vendor performance scorecard that runs the QBR. Below is what a mature fleet-side scorecard looks like — with green/amber/red thresholds tied directly to the contract remedies.
| KPI | Target | Green | Amber | Red / Trigger |
|---|---|---|---|---|
| Tire CPMRolling 90-day | $0.024/mi | < $0.026 | $0.026-0.028 | > $0.028 = rebate |
| Casing rejection ratePulled casings rejected at retreader | < 10% | < 10% | 10-15% | > 15% = review |
| Roadside SLA hit rateResponse within tier target | ≥ 93% | ≥ 93% | 88-93% | < 88% = penalty |
| First-time-fix rateRoadside fixes not requiring repeat | ≥ 90% | ≥ 90% | 85-90% | < 85% = review |
| Same-day fill rateStock orders shipped same day | ≥ 95% | ≥ 95% | 90-95% | < 90% = review |
| Invoice accuracyInvoices matching contract terms without dispute | ≥ 98% | ≥ 98% | 95-98% | < 95% = audit |
The scorecard becomes the contract's teeth. Without it, every clause is aspirational. With it, contract remedies actually trigger — and vendors respond, because they know the fleet has the evidence to enforce or exit. Book a demo to see per-vendor scorecards auto-generated from fleet inspection data
From a Purchasing Manager who renegotiated a $2.4M annual tire contract
We'd been on the same tire vendor for eleven years. Same auto-renewal, same "best efforts" SLA language, same casing return terms that basically meant the vendor decided what our used casings were worth. On paper the unit prices were competitive. In practice, the total tire spend was creeping up 6-8% a year with no explanation.
When I finally walked into the renewal with a 7-clause draft contract and 18 months of our own CPM, casing yield, and roadside response data, the conversation completely changed. The vendor's own scorecard said 94% SLA hit rate. Ours said 84%. When they couldn't reconcile the gap, they conceded roadside penalties, tiered pricing, and a real casing return schedule at $115 per casing instead of "market value." Net savings on the renewal: $340K annually on a $2.4M contract — before we changed a single tire or a single truck. The negotiation leverage isn't the tire market. It's the fleet's own data.
Frequently asked questions
What should a fleet tire purchase contract include beyond unit price?
A well-structured fleet tire purchase contract goes far beyond dollars-per-tire pricing. Seven core clauses determine total tire spend over the life of the agreement. First, tiered pricing by volume and SKU category with defined index-based adjustment triggers rather than open-ended vendor re-pricing. Second, a cost-per-mile SLA that commits the vendor to a measurable CPM target (typically $0.018-0.028 for a Class 8 OTR fleet with mature retread mix) with defined remedies if actual measured CPM misses. Third, casing return and credit terms specifying dollar value per acceptable casing ($80-$150 by size), rejection rate ceilings, and retread turnaround times. Fourth, roadside response SLAs by zone tier (metro / regional / rural) with hit-rate targets and penalty schedules for missed responses. Fifth, on-site service and mount/dismount pricing locked in the contract, not "quoted at time of service." Sixth, a mandated quarterly business review with a defined scorecard of KPIs and vendor right-to-audit. Seventh, invoice dispute and termination clauses giving the fleet exit leverage if scorecard KPIs miss for two consecutive quarters. Contracts with all seven clauses typically deliver 15-25% lower total tire spend than same-vendor price-only agreements.
What CPM target should be written into a tire SLA?
Cost-per-mile targets depend on duty cycle, tire brand tier, and retread program maturity. Realistic 2026 benchmarks: for a 5-axle Class 8 OTR sleeper fleet running 100K-120K miles annually with mature retread program (40-60% retread mix on drives, TPMS-equipped, disciplined inflation management), the target is $0.018-0.028 CPM. Regional or LTL fleets with more scrub and stop-and-go duty typically target $0.026-0.036. On-off-highway or vocational fleets with cut-and-chip exposure target $0.035-0.055. Owner-operator single-truck arrangements typically run $0.022-0.032 for pure highway with premium tire tier. Setting the CPM target in the contract requires establishing a measurement baseline: what tires, what duty cycle, what time period counts as "actual measured CPM." A common structure defines a 90-day rolling window and a specified fleet segment (e.g., the 40 tractors on Route Segment A). If measured CPM exceeds target by more than 10% for two consecutive quarters, contract remedies trigger — typically rebate, extended warranty, or partial tire mix replacement at vendor cost. Vendors will resist committing to CPM SLAs. The fleets that hold firm win the term because CPM is the only metric that captures actual economic performance.
How should casing return terms be structured in the contract?
Casing return economics are one of the largest line items outside the unit price on any fleet tire contract, and one of the least-often negotiated. The contract should specify four elements. Dollar value per acceptable casing, by size and position: typically $80-$150 for commercial drive casings depending on size and quality of the retread process. Rejection criteria explicitly defined and mutually agreed: casing condition standards (belt separation limits, sidewall damage tolerances, tread depth at pull), inspection protocol, and dispute process for rejected casings. Rejection rate ceiling: if vendor rejects more than a contract-specified percentage of returned casings (typically 15%), remedies trigger — joint casing audit, third-party inspection review, or price renegotiation. Retread turnaround: casings sent to the retreader come back to the fleet inventory within a defined window (typically 21-30 days) so the casing pool doesn't get held up in vendor float. Ownership language matters: the casing pool belongs to the fleet, not the vendor. This is what prevents vendor lock-in when the fleet considers switching. Without explicit casing pool ownership language, changing vendors can leave hundreds of thousands of dollars of casing value stranded.
How often should tire vendor performance be reviewed?
Quarterly business reviews (QBRs) are the industry-standard cadence for commercial tire contracts and should be contractually mandated, not requested. The QBR structure that works: vendor delivers signed monthly performance reports on defined scorecard KPIs (CPM by fleet segment, casing yield rate, roadside SLA hit rate, first-time-fix rate, same-day fill rate, invoice accuracy). Fleet compares vendor-reported data against fleet-side measured data from the same period. Deviations trigger discussion at the QBR: reconciliation of measurement methodology, explanation of misses, action plan for the next quarter. Two consecutive quarters of Red-tier performance on any scorecard KPI triggers contract remedy discussion — either rebate, service level upgrade, or termination without penalty depending on the clause structure. The trap most fleets fall into: relying entirely on vendor-provided data at the QBR. Vendor scorecards almost always look better than fleet-side measurements because they exclude events the vendor considers out-of-scope, edge cases, or reporting-timing gaps. The fleet that walks into the QBR with its own independent measurement of the same KPIs controls the conversation and captures the contract's enforcement value. Fleets without independent data end up in a "we said, they said" pattern that erodes contract leverage over time.
How does HVI support tire vendor contract enforcement?
HVI captures the fleet-side data that makes every clause in a tire purchase contract enforceable. Per-vendor cost per mile is tracked automatically from tire purchase records, retread records, mount/dismount labor, and roadside events tied to specific casings and vendors. Casing yield rate is calculated from tire pull records versus retreader accept/reject data, so the vendor's stated rejection rate can be compared against the fleet's actual measurement. Roadside response time is captured from the timestamp of the roadside event (driver flagged tire issue in inspection app) to the timestamp of the vendor's arrival on scene, per zone tier, so SLA hit rate is a fleet-owned measurement rather than a vendor-reported number. First-time-fix rate is captured from follow-up inspection data and repeat roadside events. Same-day fill and invoice accuracy pull from purchase order and AP integration. The QBR scorecard exports as a signed PDF each quarter, ready to walk into the vendor meeting. When the vendor's data says 96% SLA hit rate and yours says 87%, the reconciliation conversation happens against evidence, not memory. For purchasing managers like Marcus P. renegotiating multi-year multi-million-dollar tire contracts, that evidence is what turns a routine renewal into a $340K annual savings. Book a demo to see the vendor scorecard exported live from fleet data.
A tire contract without your own performance data is a wish list. HVI turns it into an agreement.
Track cost per mile per vendor, casing yield, roadside SLA hit rate, and first-time-fix rate. Export QBR-ready scorecards each quarter. Walk into every vendor negotiation with 18 months of your own evidence — the leverage that turns price sheets into procurement contracts.