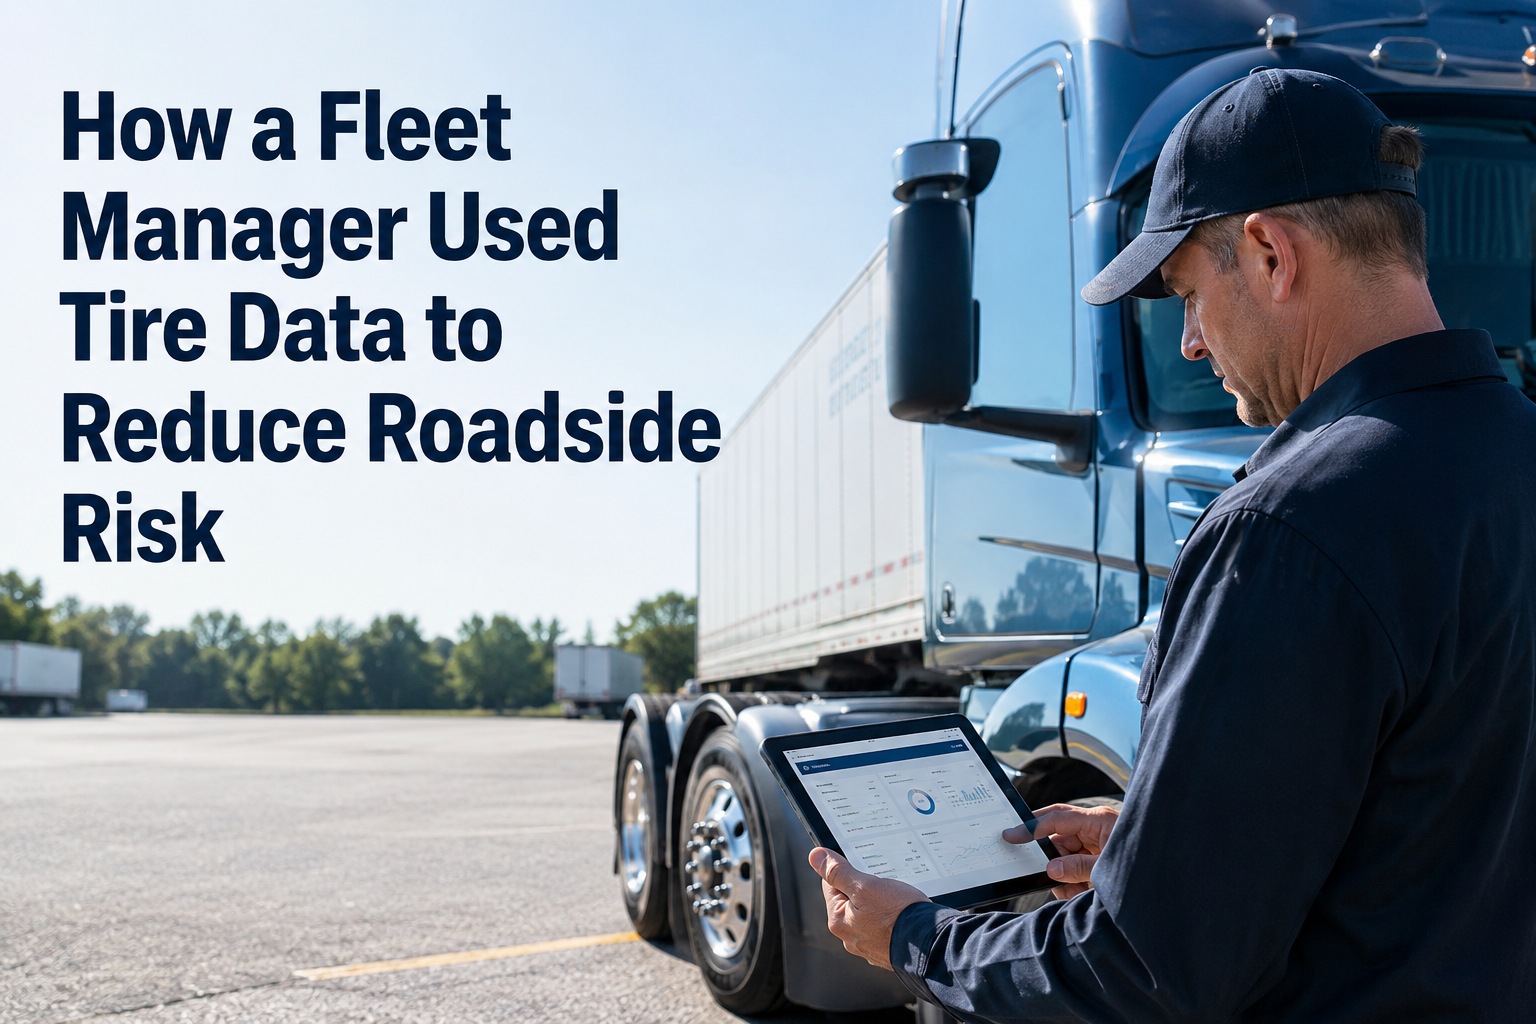
Every fleet manager knows the phone call: a driver stranded on the shoulder, a blown tire, a load running late, and an emergency road-service bill that lands somewhere between $800 and $2,000 once you count towing, the tire, and the downtime. For one regional fleet manager running a few dozen vehicles, those calls had become routine — a line item everyone treated as the unavoidable cost of running vehicles. They weren't unavoidable. The breakthrough wasn't a new tire brand or a bigger budget; it was data. By turning every pre-trip inspection into a tire data point — tread depth, pressure, wear pattern, photo — and letting the system flag problems before they hit the road, this manager watched roadside tire failures fall sharply and tire spend drop with them. This is the story of how that shift happened: the problem, the turning point, exactly what got tracked, the results, and how any fleet can replicate it. The numbers behind it are not unique to one fleet — they're what the data does for anyone who starts collecting it. book a 30-minute walkthrough to see it mapped onto your own fleet.
He stopped treating blowouts as bad luck and started treating them as missed data.
HVI turns every pre-trip into a tire data point — tread depth, pressure, wear pattern, and photo — then fires alerts before a tire reaches the danger zone, routes worn tires to a work order, and builds the record that proves systematic tire management at a DOT inspection.
The problem: bleeding from both sides
Before the change, the fleet was losing money on tires two ways at once — and like most fleets, it only ever noticed the dramatic one.
The roadside blowout
A tire lets go on the highway. vehicle down, emergency service called, replacement at premium cost, driver idle for hours, load late, customer unhappy — $800 to $2,000 gone, plus the lost trust.
The silent premature wear
The quieter drain: underinflation runs undetected for weeks, rotations get missed, tires wear unevenly and get scrapped 20,000 miles early — on every vehicle, every year.
The hardest part wasn't the cost — it was that the cost looked random. A blowout felt like bad luck, an act of the road. But roughly 80% of blowouts trace back to underinflation and slow, undetected air loss, which means they aren't random at all. They're the visible end of a problem that was measurable weeks earlier. The fleet just wasn't measuring it.
The turning point: every pre-trip becomes data
The shift was simple in concept: stop treating the pre-trip inspection as a box-ticking ritual and start treating it as a tire data collection point. The same walk-around, now capturing numbers instead of a checkmark.
Capture at every pre-trip
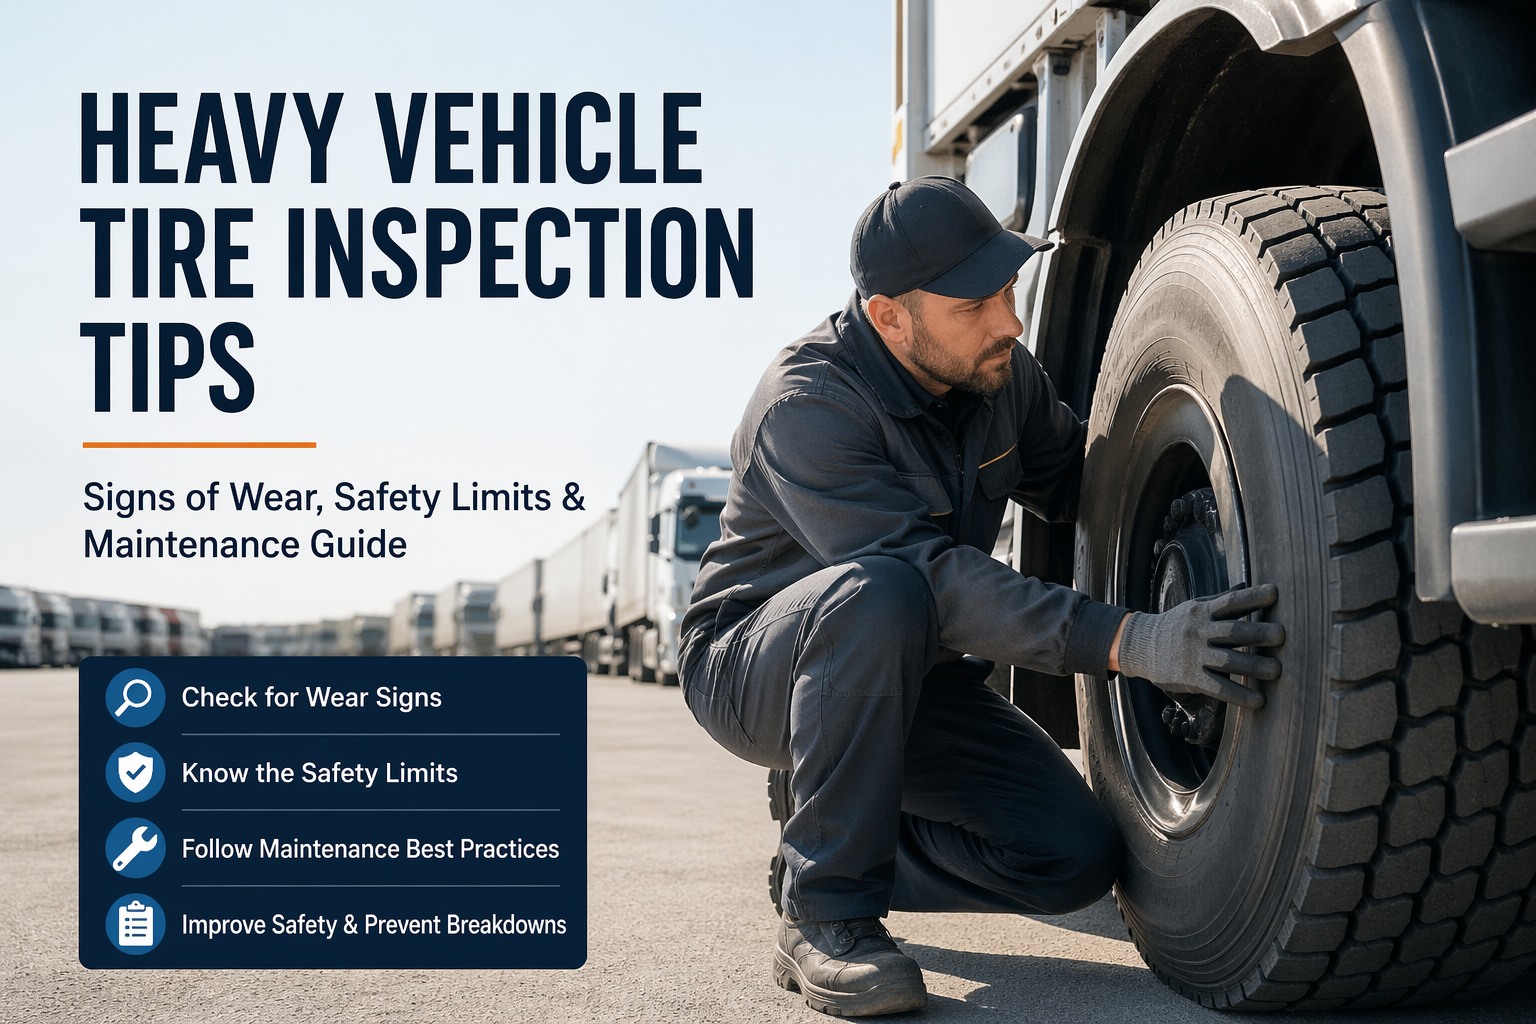
Drivers logged tread depth, pressure, and wear-pattern photos on a phone during the inspection they were already doing — no new hardware, no extra stop.
Let the thresholds do the watching
The system flagged any tire approaching an action threshold automatically — low pressure, shallow tread, or a wear pattern signaling a deeper fault — before it became a failure.
Turn the flag into a fix
Every flagged tire became a work order routed to the shop — so a problem found at 6 a.m. was scheduled, not forgotten, and never left the yard as a roadside risk.
The insight that made it work: a wear pattern is a report card on the whole vehicle. Shoulder wear means inflation, feathering means alignment, cupping means suspension. Photographing and tracking those patterns caught problems weeks before they became roadside failures — and pointed straight at the root cause. HVI builds tread, pressure, and wear-pattern capture into every inspection.
What the data actually tracked
Four data points, captured per tire over time, turned tires from a mystery expense into a managed asset. None required dedicated tire hardware — just the inspection done right.
The fleet wasn't capturing any of these before — just a glance and a checkmark. sign up free and turn every pre-trip into a tread, pressure, and wear-pattern data point, or book a demo to see fleet-wide tire analytics live.
The results: risk down, cost down
Once the data started flowing and the alerts started firing, the change showed up where it mattered — fewer shoulder calls and a smaller tire bill. These are the outcomes structured tire data consistently delivers.
saved on a 100-vehicle fleet. A fleet spending $160,000 a year on tires can save $75,000–$100,000 through structured management — inflation discipline alone drives most of it. Scaled to a few dozen vehicles, the savings are proportional and the math still works: the program pays for itself the first time it prevents a single highway blowout. The risk reduction is the headline; the cost reduction pays the bill.
The bonus: an audit-proof record
There was a second payoff the manager didn't expect. The same data that prevented blowouts also became the proof of a systematic tire program — exactly what a DOT roadside inspection or safety audit wants to see.
Timestamped & signed
Every tread reading, rotation, and wear-pattern photo is timestamped, technician-linked, and tied to the specific vehicle — a complete maintenance trail, not a memory.
Exportable in minutes
When an inspector or auditor asks, the full tire history exports in minutes instead of a scramble through paper logs that may not exist.
Proof of diligence
A documented record of systematic tire management is the cleanest evidence of due diligence — and it lives in the same place as every other inspection.
The record that prevents the blowout is the same record that satisfies the auditor — captured once, used twice. sign up free and build an audit-ready tire history on every vehicle automatically.
How to replicate it on your fleet
None of this required a big project or new hardware. Any fleet can follow the same path with the inspection it already runs.
Before: reactive guesswork
- Pre-trip is a checkmark, not a measurement
- Underinflation runs undetected for weeks
- Rotations missed, tires scrapped 20,000 miles early
- Blowouts treated as random bad luck
- Wear patterns ignored until failure
- No tire history when DOT asks
After: data-driven control
- Every pre-trip captures tread, pressure & photos
- Alerts fire before a tire hits the danger zone
- Rotation reminders keep wear even & life long
- Blowouts prevented at the root cause
- Wear patterns diagnose the fault weeks early
- Audit-ready tire history exports in minutes
The whole shift came down to one decision: capture the data you were already standing in front of. The driver was already at the tire every morning — the only change was logging four numbers instead of one checkmark. HVI makes that change with no new hardware on the vehicle.
Frequently asked questions
How does tire data actually reduce roadside breakdowns?
Because roadside tire failures aren't random — roughly 80% of blowouts trace back to underinflation and slow, undetected air loss, which is measurable weeks before the tire fails. When every pre-trip inspection captures tread depth, pressure, and a wear-pattern photo, the system can flag a tire approaching an action threshold and route it to a work order before it ever leaves the yard. That turns a future highway blowout into a scheduled morning repair. On top of that, wear patterns act as a diagnostic: shoulder wear points to inflation, feathering to alignment, cupping to suspension — so the data catches the root cause, not just the symptom. HVI's inspection and maintenance software builds tread, pressure, and wear-pattern capture into every inspection with automatic alerts at threshold. sign up free and start catching tire problems before the road does.
What tire data should a fleet actually track?
Four data points turn tires from a mystery expense into a managed asset. Tread depth, trended per tire, catches the retread window before it's missed and worn tires before they're a hazard. Inflation pressure is the single biggest lever — every 10 PSI below spec costs roughly 10–15% of tread life and is the leading cause of blowouts. Wear pattern, documented with photos, diagnoses the underlying alignment, suspension, or inflation fault behind uneven wear. And rotation history keeps intervals from slipping so wear stays even across axles, which is the single largest tire cost reduction available without changing tire brand. None of these require dedicated tire hardware — just the pre-trip inspection done as a data point instead of a checkmark. HVI's inspection and maintenance software captures all four per tire and trends them over time. book a demo to see fleet-wide tire analytics.
How much can a fleet save with structured tire management?
The numbers are significant because tires are one of the three largest line items in a fleet, consuming 10–15% of total operating cost, and improper management wastes an estimated $2,500–$4,000 per vehicle every year through premature replacement, wasted fuel, and avoidable breakdowns. Fleets that move to systematic tire management consistently cut total tire costs by around 20%, and comprehensive programs reach higher. For a 100-vehicle fleet spending $160,000 a year on tires, that's $75,000–$100,000 in annual savings, driven mostly by inflation discipline extending tread life and fuel economy. And the payback is fast: preventing a single roadside blowout, at $800–$2,000 each, often covers more than a year of software per vehicle. HVI's inspection and maintenance software delivers that structure without dedicated tire hardware. sign up free and start cutting tire spend.
Do I need special tire sensors or TPMS hardware to do this?
No. While TPMS and automatic inflation systems are excellent and earn a strong ROI, the approach in this story required no dedicated tire hardware at all — it worked by turning the pre-trip inspection the drivers were already doing into a structured data point. A driver with a calibrated tread gauge and a phone captures tread depth, pressure, and a wear-pattern photo in about 60 seconds per tire, and the software handles the trending and alerting. That makes it accessible to fleets of any size, including smaller operations that can't justify a full sensor rollout, and it can always be paired with TPMS later for live pressure data. The point is that most of the value comes from systematically capturing and acting on data, not from the sensor. HVI's inspection and maintenance software is built around exactly that hardware-free approach. book a demo to see the no-hardware setup.
How does HVI help with fleet tire management?
HVI is an inspection and maintenance software platform that turns every pre-trip inspection into a tire data collection point. Drivers log tread depth, pressure, and wear-pattern photos on a phone or tablet as part of the inspection they already run, and the platform automatically flags any tire approaching an action threshold — low pressure, shallow tread, or a wear pattern signaling a deeper fault. Each flagged tire auto-creates a work order routed to the shop, so a problem found at the morning pre-trip is scheduled rather than forgotten and never becomes a roadside failure. It trends tread and pressure per tire to catch retread windows and forecast replacement, tracks rotation history so intervals don't slip, and keeps a timestamped, technician-linked record that exports in minutes for DOT inspections and safety audits. No dedicated tire hardware required, and it lives in the same platform as the rest of your fleet's inspections and work orders. book a demo and we'll map the software onto your fleet on the call.
Stop treating blowouts as bad luck. Start treating them as data you can act on.
HVI turns every pre-trip into a tire data point — tread depth, pressure, wear pattern, and photo — fires alerts before a tire reaches the danger zone, routes worn tires to work orders, trends every tire over time, and builds the audit-ready record that proves systematic tire management. No new hardware, just the inspection done right. Cut roadside risk and tire spend at the same time.
No credit card required · Live in under two weeks · Tread & pressure tracking + wear-pattern photos + threshold alerts + audit-ready records in one platform