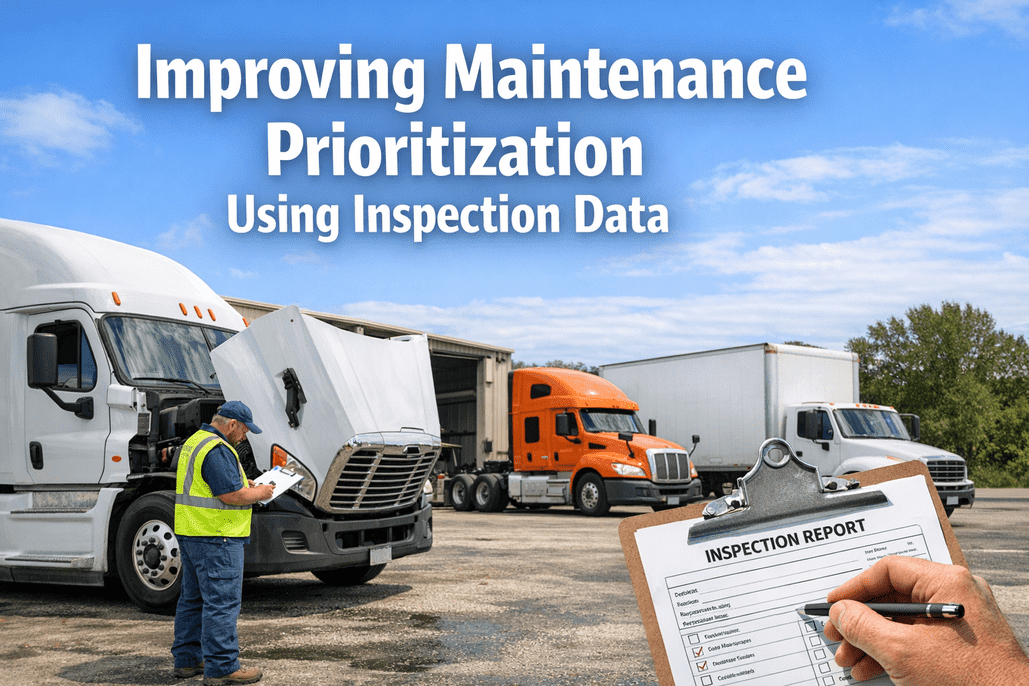
This case study examines how a 118-vehicle fleet transformed its maintenance operations by using inspection data to drive prioritization decisions, reducing unplanned downtime by 41% and cutting emergency repair costs by $127,000 annually. With maintenance teams overwhelmed by competing work orders and no clear system for ranking defect severity, vehicles sat idle while low-priority cosmetic fixes consumed technician hours and critical brake and steering issues waited in queue. By implementing an inspection-driven prioritization framework that classified every defect by safety impact, operational urgency, and regulatory risk, the fleet eliminated guesswork from maintenance scheduling and ensured the right repairs happened first. Fleet managers, maintenance supervisors, and operations directors will find practical strategies for building severity-based triage systems, reducing mean time to repair for critical defects, and connecting daily inspection findings directly to maintenance workflows.
Maintenance Scheduling Challenges
This regional distribution fleet had plenty of maintenance activity—but none of it was guided by data. Work orders piled up, technicians chose tasks based on convenience rather than urgency, and critical defects competed with cosmetic fixes for the same shop time. With unplanned downtime costing commercial fleets an average of $448 to $760 per day per vehicle, every misallocated repair hour carried real financial weight. Schedule a consultation to discuss your maintenance challenges, or start your free trial to see inspection-driven prioritization in action.
Fleet Profile
The Maintenance Bottleneck
12-Month Snapshot Before ChangesUnclear Defect Severity
The root problem wasn't a lack of inspections—drivers were reporting defects. But every defect entered the maintenance queue with the same priority: none. A cracked windshield sat alongside a brake air leak. A burned-out marker light shared queue position with a leaking steering hose. Without severity classification, maintenance became first-come-first-served—and the wrong repairs kept jumping ahead. Explore how inspection best practices can transform defect management in your fleet.
What Entered the Queue vs. What Mattered Most
The Cost of Mis-Prioritization
The Core Problem
Every defect was treated equally because no system existed to classify severity at the point of inspection. Technicians defaulted to what was easiest or loudest, not what was most critical. The inspection process captured problems but didn't prioritize them.
Stop Guessing Which Repairs Come First
See how inspection-driven prioritization eliminates maintenance bottlenecks and focuses resources where they matter most.
Inspection-Based Prioritization
The solution wasn't more technicians or bigger shop space—it was better information at the point of defect capture. The fleet built a four-tier severity classification directly into the digital inspection workflow, so every defect arrived in the maintenance queue already ranked by safety impact, regulatory risk, and operational urgency. Try our inspection platform to see how severity-based triage works.
Four-Tier Defect Severity Framework
From Inspection to Repair: The New Workflow
Driver Reports Defect
Digital inspection captures defect with photo, location, and description
Auto-Classification
System assigns severity tier based on defect type and component category
Priority Queue
Work order enters maintenance queue ranked by severity, age, and vehicle criticality
Smart Assignment
Technicians see highest-priority items first with estimated repair time and parts status
Close + Verify
Repair documented, driver notified, vehicle returned to service with audit trail
Maintenance Queue: Before vs. After Prioritization
| Metric | Before | After | Change |
|---|---|---|---|
| Critical defect response time | 5.7 days | 4 hours | 96% faster |
| Open work order backlog | 47 orders | 12 orders | 74% reduction |
| Technician hours on critical items | 38% | 71% | +87% focus |
| Avg repair turnaround (all tiers) | 8.3 days | 3.1 days | 63% faster |
| Defects re-reported (missed first time) | 18% | 3% | 83% reduction |
Maintenance Efficiency Gains
With every defect entering the queue pre-classified, maintenance operations fundamentally changed. Technicians stopped cherry-picking easy jobs and started working from a data-driven priority list. The same six technicians and four bays handled more critical repairs in less time—not because they worked harder, but because they worked on the right things first. Book a demo to explore how prioritization transforms maintenance output.
Unplanned Downtime Events Per Month (12-Month Trend)
Downtime Reduction
The bottom line: fewer vehicles sitting idle, fewer emergency callouts, and more trucks on the road generating revenue. The fleet didn't add staff or expand shop capacity—it simply ensured the existing resources focused on what mattered most. Research shows that vehicles in scheduled preventive maintenance programs experience roughly 20% fewer maintenance-related downtime days, and this fleet exceeded that benchmark by combining PM compliance with inspection-driven prioritization.
Financial Impact Summary (Annual)
Classify at Capture
Severity must be assigned during inspection, not after. If defects enter the queue unranked, prioritization breaks down immediately.
Trust the Tiers
Technicians must work the priority list, not personal preference. Override capability exists but requires supervisor approval.
Close the Feedback Loop
When drivers see their critical reports generate immediate action, defect reporting quality and volume both increase dramatically.
Measure What Matters
Track response time by severity tier, not just overall turnaround. A 3-day average means nothing if critical items wait 5 days.
Discover more inspection and fleet maintenance strategies at the HVI Learning Center.
Ready to Prioritize Maintenance With Inspection Data?
Stop letting low-priority fixes consume your shop time while critical defects wait. Build a data-driven maintenance queue today.