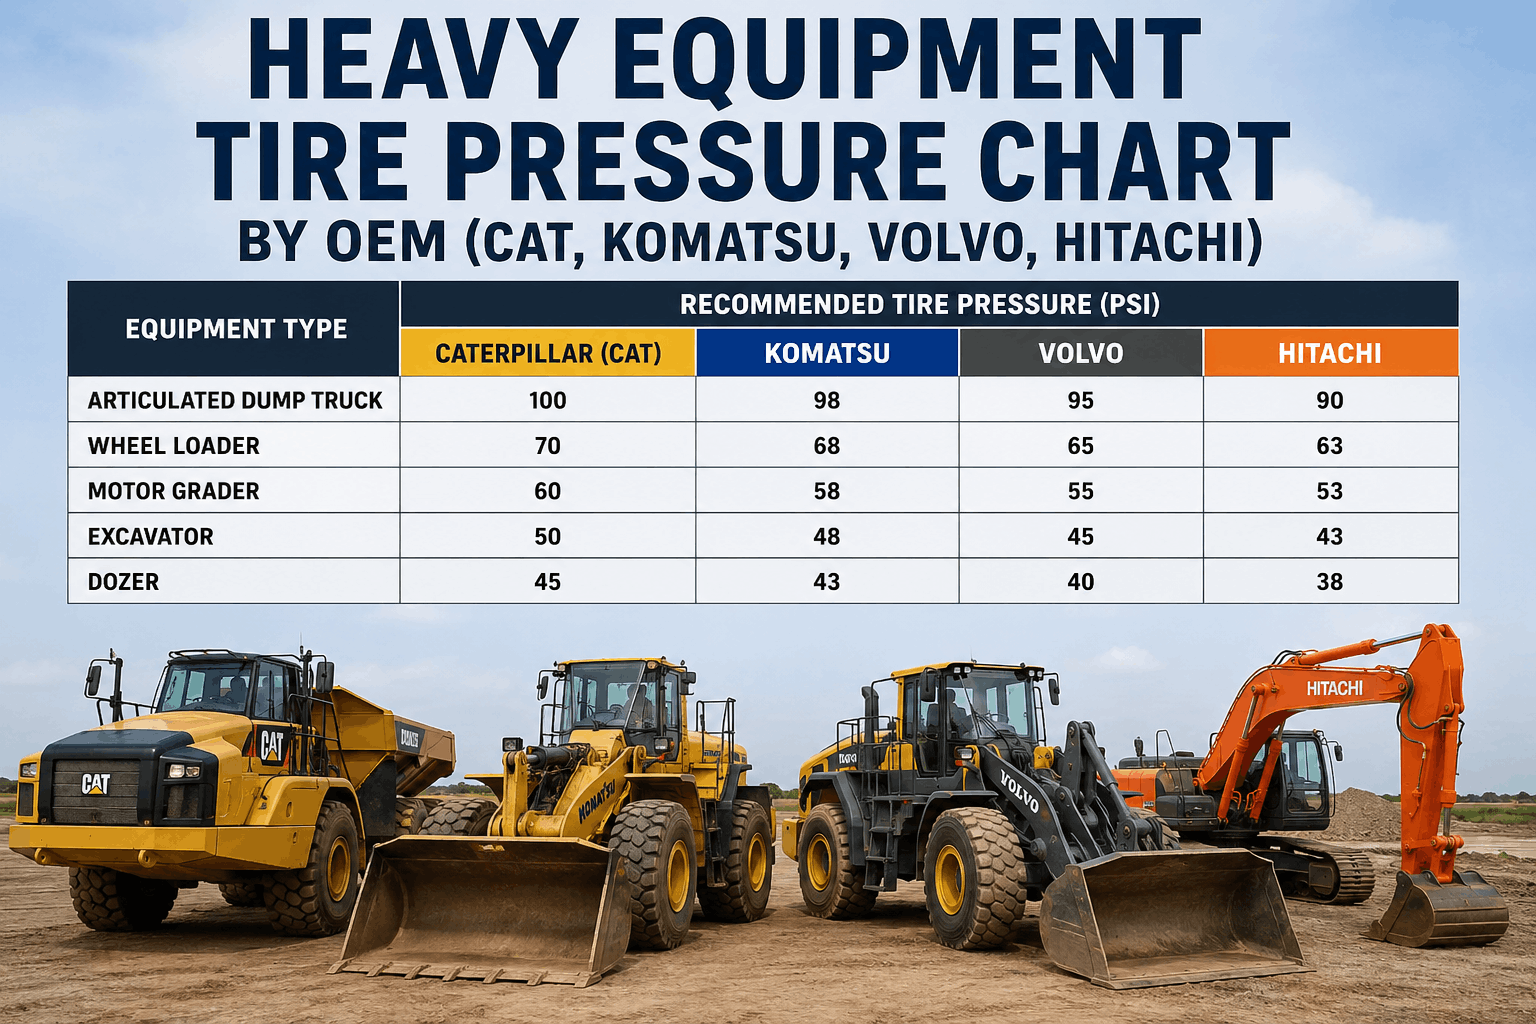
Heavy equipment tire pressure is one of the few maintenance variables where the operator gets a numerical right answer — and one where the wrong answer compounds fast. A wheel loader running 15 PSI below OEM spec loses 3% in fuel economy, 18% in tire life, and an unpredictable amount in operator safety from heat-induced sidewall failure. The same loader 10 PSI above spec gives up traction, increases bucket-cycle vibration, and accelerates uneven tread wear at the shoulders. The right pressure depends on four variables that most field crews never reconcile: OEM specification (Cat, Komatsu, Volvo, Hitachi each publish their own), tire size and ply rating, load class and duty cycle (quarry vs articulated dump vs high-lift), and temperature differential between cold-check and operating conditions. This guide is a reference card for fleet techs and operators — the OEM-specific PSI charts for the most common loader and haul-truck classes, the cold-vs-hot adjustment math (2% PSI per 1% load increase for radials; 120 PSI max either way), the load-class translation tables, and the fuel-economy and tire-life impact data that justifies enforcing the spec rather than running "close enough." HVI's inspection & maintenance software makes tire PSI a required entry field per tire position — so the right number gets recorded, the wrong number gets flagged, and trend tracking warns before a tire crosses the OOS threshold.
Make Every Tire Pressure Reading Count
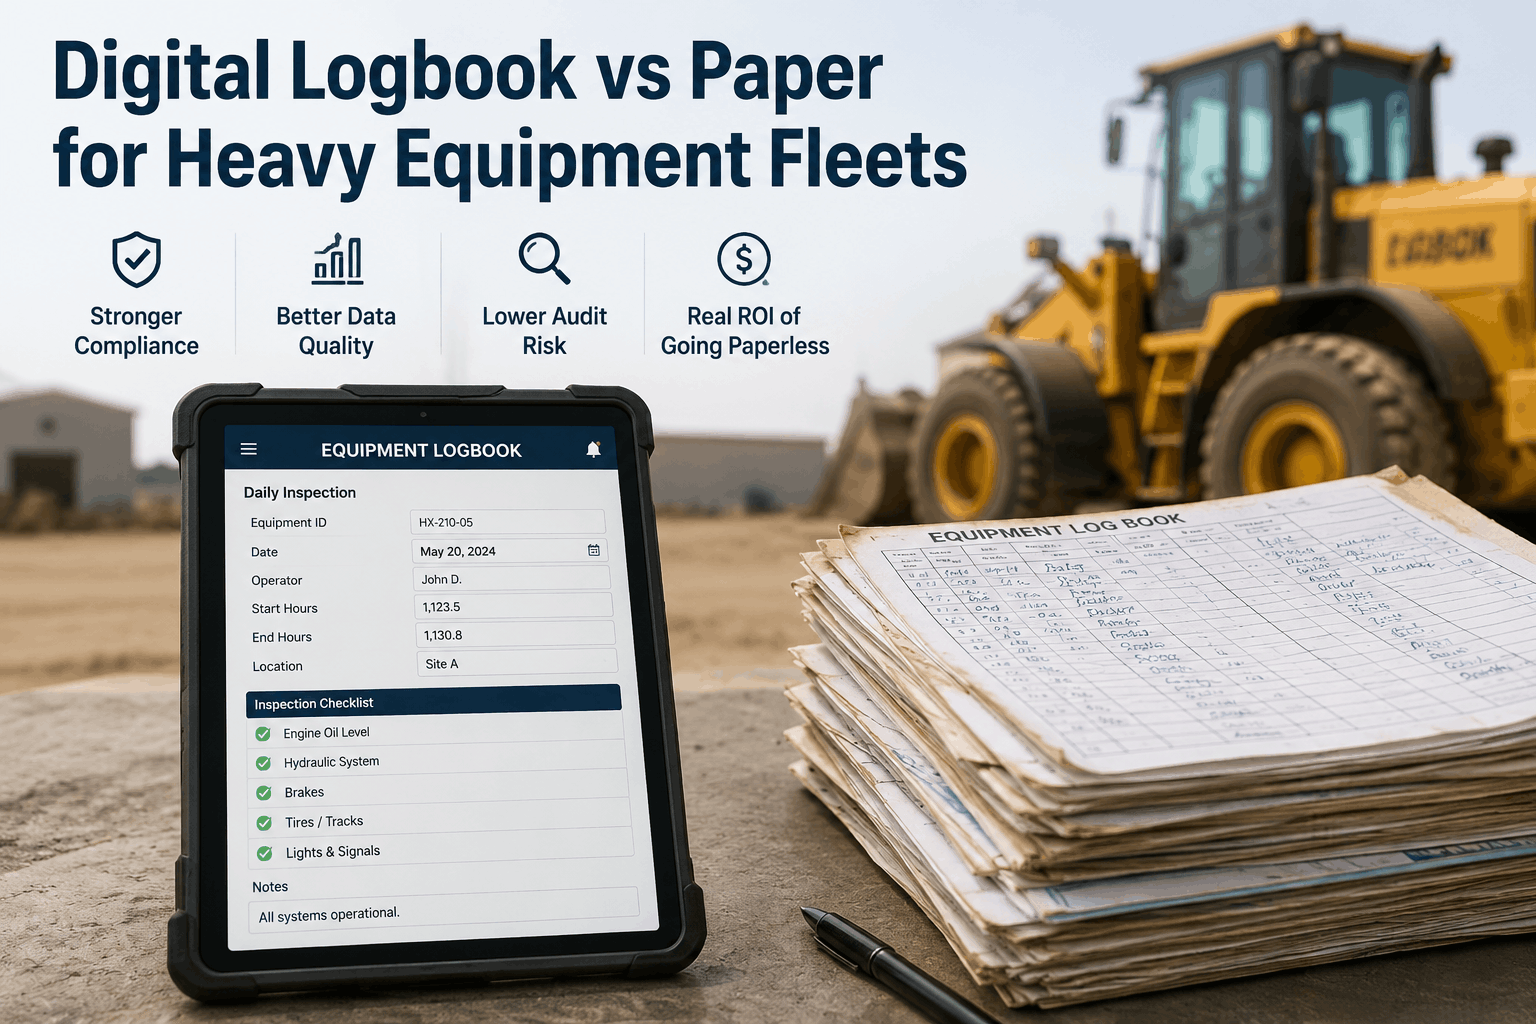
HVI requires PSI entry per tire position during every inspection. Out-of-spec readings auto-flag for maintenance. Trend tracking warns when a tire approaches the OOS threshold — before it crosses it.
The 4 Variables That Determine the Right PSI
Tire pressure is not a single number — it is the output of four inputs. Reading any pressure chart correctly means knowing all four for the vehicle in front of you.
1
OEM Specification
Cat, Komatsu, Volvo, Hitachi each publish their own factory spec per model. Bucket size, axle layout, and chassis weight differ — the spec is not transferable across brands.
2
Tire Size & Ply Rating
Same vehicle, different tire size = different PSI. Higher ply rating = higher max PSI capability. Read the sidewall, not the chart for a different size.
3
Load Class & Duty Cycle
Quarry vs articulated dump vs high-lift loader changes the load on each tire — and therefore the required PSI. A 2-star radial in loader use needs 94 PSI; the same tire in dump-truck use needs 74 PSI.
4
Temperature Differential
Hot tires read 5–15 PSI higher than cold tires. Always set PSI cold — before the first cycle of the shift. Adjusting hot leads to underinflation once the tire cools.
Loader Pressure Chart — 15.5-25 Tire Size, Quarry Operations
The most common heavy-equipment tire size on small-to-mid wheel loaders. Pressure spec varies by OEM model and bucket size. Front PSI runs significantly higher than rear because the front axle carries the bucket and load. Source: OEM load and inflation tables for normal quarry operations.
OEM
Model
Bucket (Cu Yd)
Ply
Front PSI
Rear PSI
Caterpillar
910K
1.7
12
55
35
Caterpillar
910M
2.5
12
70
40
Caterpillar
914G2
1.8
24
55
35
Komatsu
WA150-5
1.6
24
50
35
Hitachi
ZW100
1.7
24
55
35
Hitachi
ZW100 HL
1.4
24
50
35
"HL" indicates high-lift configuration with extended booms — reduced pressure compensates for increased front-axle load moment. Use this chart for baseline; always verify against the OEM operator's manual for your specific model year.
Book a demo to see HVI's tire PSI tracking.
Reference Card: OEM Color-Coded by Brand
Print this and tape it inside the shop. Same data as the table above, organized as quick-reference brand cards for fleet techs running mixed-OEM fleets.
CATERPILLAR
910K55/35
910M70/40
914G255/35
Front PSI / Rear PSI
KOMATSU
Front PSI / Rear PSI
VOLVO
Front PSI / Rear PSI
HITACHI
Front PSI / Rear PSI
Larger Equipment: 29.5R25 and Haul Truck Tires
Bigger machines, bigger numbers, different rules. The 29.5R25 is the standard size for mid-to-large wheel loaders and articulated dump trucks. Haul-truck sizes (40.00R57, 50/80R57) carry haul trucks weighing 130–360 short tons fully loaded.
Tire Size
Equipment Class
Front PSI (Typical)
Rear PSI (Typical)
29.5R25
Mid-large wheel loader
85
60
29.5R25
Articulated dump truck
74
74
40.00R57
Komatsu 830E haul truck (255 ton)
100–115
100–115
50/80R57
Komatsu 930E haul truck (320 ton)
100–120
100–120
120 PSI — THE HARD CEILING
The maximum allowable cold PSI for either radial or bias OTR tires is 120 PSI. Above this threshold, sidewall and bead failure risk increases sharply regardless of the tire's load capacity. Never exceed 120 PSI cold — even when calculations for excess load suggest higher.
Cold vs Hot Adjustment: The Numbers Operators Forget
Pressure changes with temperature. A tire checked at 70 degrees F shop temperature reads differently after a shift in a 110 degrees F quarry — and the difference is enough to push a borderline tire into OOS territory in either direction.
RULE 1
Always Set PSI Cold
Cold = ambient temperature, vehicle parked at least 3 hours, no recent operation. If checked after a shift, subtract estimated heat rise before adjusting.
RULE 2
Hot Reading = Cold + 5–15 PSI
A tire that reads 85 PSI hot is roughly 70–80 PSI cold. Adjusting a hot tire to "spec" puts it underinflated when it cools. Verify cold the next morning.
RULE 3
Excess Load = +2% PSI per 1% Load (Radial)
For radial OTR tires running excess loads, increase cold PSI by 2% for each 1% load increase. Maximum 7% load excess = max 14% PSI increase. Bias tires: 30% PSI max increase for up to 15% excess load.
RULE 4
Speed Reduces Load Capacity
A 2-star radial loader tire rated for 94 PSI at 5 mph drops to 74 PSI when used at higher speeds on articulated dumps. Match PSI to actual speed-load duty cycle.
HVI's PSI entry field accepts the cold reading per tire position. Out-of-spec values auto-flag for maintenance review. Trend over time reveals slow-leak tires before they reach OOS.
Start free with HVI.
The Fuel-Economy and Tire-Life Cost of Wrong PSI
Underinflation looks like nothing. The cost is invisible until the fuel bill arrives, the tire fails six months early, or the OOS inspection results in a citation. Here is the cost stack per tire per year for a typical loader running 10 PSI below spec.
Impact Area
10 PSI Below Spec
20 PSI Below Spec
At OOS Threshold
Fuel Economy Loss
~2%
~4%
~5%+
Tire Life Reduction
~12%
~25%
40%+
Sidewall Heat Risk
Elevated
High
Critical
CSA / OOS Risk
Borderline
Citable
Automatic OOS
Estimated Annual $/Tire Cost
$280–$450
$650–$1,100
$1,400+ plus fines
FUEL-ECONOMY MATH
Industry benchmark: every 1 PSI below spec costs approximately 0.2% in fuel economy. For a wheel loader burning 6 gallons per hour at $4/gallon, 10 PSI underinflation costs $5.76 per shift in fuel alone — before accounting for tire wear, downtime, and compliance risk.
Quick Inspection Routine for Operators
The 5-minute pre-shift PSI check that catches 90% of pressure-related defects before they cause problems. Print and post in the operator cab.
1
Cold check only. Vehicle parked at least 3 hours. If you cannot check cold, log the reading as "post-shift" and recheck cold the next morning.
2
All four (or six) tires. Same routine every position. Skipping a tire because "it looks OK" is how underinflation hides for weeks.
3
Record the actual number. "OK" is not a reading. HVI requires the numerical PSI per tire. Paper checklists that allow "OK" hide the very data you need.
4
Compare to OEM spec. Match brand and model on the chart above (or your operator's manual). More than 5 PSI off spec gets flagged.
5
Visual check + photo. Sidewall bulges, cuts, embedded objects, irregular wear patterns. HVI captures the photo, GPS, and timestamp automatically.
6
Adjust to spec before operating. Cold adjustment only. Never inflate hot tires to "spec" — once they cool, you have created an underinflated tire.
Right PSI Is the Cheapest Maintenance Decision You Can Make
Heavy equipment tire pressure is one of the few maintenance variables where the operator has full control, the OEM publishes the right answer, and the cost of getting it wrong compounds month after month in invisible fuel waste, accelerated tire wear, and avoidable OOS exposure. The pressure charts above cover the most common loaders running 15.5-25 tires across Caterpillar, Komatsu, Volvo, and Hitachi — the OEM-specific numbers that should drive every cold check before every shift. The temperature rules (always cold, never hot-adjusted), the load math (radial +2% PSI per 1% load up to 7%/14% maximum, bias up to 15%/30%, hard 120 PSI ceiling), and the 5-minute pre-shift routine combine into a tire-management discipline that costs nothing to implement and saves $280–$1,400 per tire per year compared to "close enough" practices. HVI's inspection & maintenance software turns this discipline into a workflow: PSI is a required numerical entry per tire position, out-of-spec readings auto-flag for maintenance review, trend tracking surfaces slow-leak tires before they become OOS, and the audit trail satisfies 49 CFR 393.75 documentation requirements. Start free today or book a 30-minute demo to see HVI's tire pressure workflow live on your fleet.
Track Every PSI Reading with HVI
Required numerical PSI entry per tire position. Auto-flag out-of-spec readings. Photo verification of sidewall and tread. Trend tracking before OOS. Cold-check enforcement. Trusted by 25,000+ users worldwide.
Frequently Asked Questions
Q: Why does the front PSI run higher than the rear on wheel loaders?
The front axle of a wheel loader carries the bucket and the load. When the bucket is loaded, front-axle weight can exceed 70% of total vehicle weight. The higher front PSI (typically 50–70 PSI vs 35–40 rear on 15.5-25 tires) compensates for this load distribution and prevents front-tire overload. Reversing the spec causes accelerated front-tire wear and sidewall stress.
Q: Can I use the same PSI when the loader operates on an articulated dump cycle?
No. Articulated dump cycles involve higher speeds, longer hauls, and different weight transfer patterns than loader-only operations. The same 29.5R25 tire that runs 85 PSI in loader use should run closer to 74 PSI in articulated dump cycles. A 2-star radial loader tire rated 94 PSI at 5 mph drops to 74 PSI at higher speeds. Match PSI to actual duty cycle, not just OEM model.
Start free with HVI.
Q: How much higher will tires read when hot vs cold?
5–15 PSI higher hot than cold, depending on ambient temperature, load, speed, and surface conditions. A tire set to 55 PSI cold may read 65–70 PSI after a 4-hour shift in a hot quarry. Always set PSI cold — before the first shift, with the vehicle parked at least 3 hours. Adjusting hot tires to "spec" causes underinflation once the tire cools.
Book a demo for HVI's PSI workflow.
Q: What is the maximum allowable cold PSI for OTR tires?
120 PSI cold is the absolute maximum for either radial or bias OTR tires, regardless of size or ply rating. Above 120 PSI, sidewall and bead failure risk increases sharply and exceeds the tire's structural design limits. For radial tires, the maximum PSI increase for excess load is 14% (corresponding to 7% load excess). For bias tires, maximum is 30% PSI increase (15% load excess). The 120 PSI ceiling applies in both cases.
Q: What does underinflation actually cost per year?
Per tire, on a typical wheel loader: 10 PSI below spec costs $280–$450 per year in fuel and reduced tire life. 20 PSI below spec costs $650–$1,100 per tire per year. At OOS threshold (20% below spec), the cost exceeds $1,400 per tire plus citation risk under 49 CFR 393.75. For a 4-tire loader, systematic 10 PSI underinflation across the fleet adds up to $1,800+ per loader per year in invisible waste.
Q: How does HVI prevent PSI compliance failures?
HVI's tire inspection workflow makes PSI a required numerical field per tire position. Drivers cannot submit "tires OK" — they must enter actual readings. Out-of-spec readings auto-flag for maintenance review. Trend tracking flags slow-leak tires before they reach OOS. Photo verification captures sidewall condition with GPS and timestamp. The full audit trail satisfies 49 CFR 393.75 documentation requirements.
Start free today.