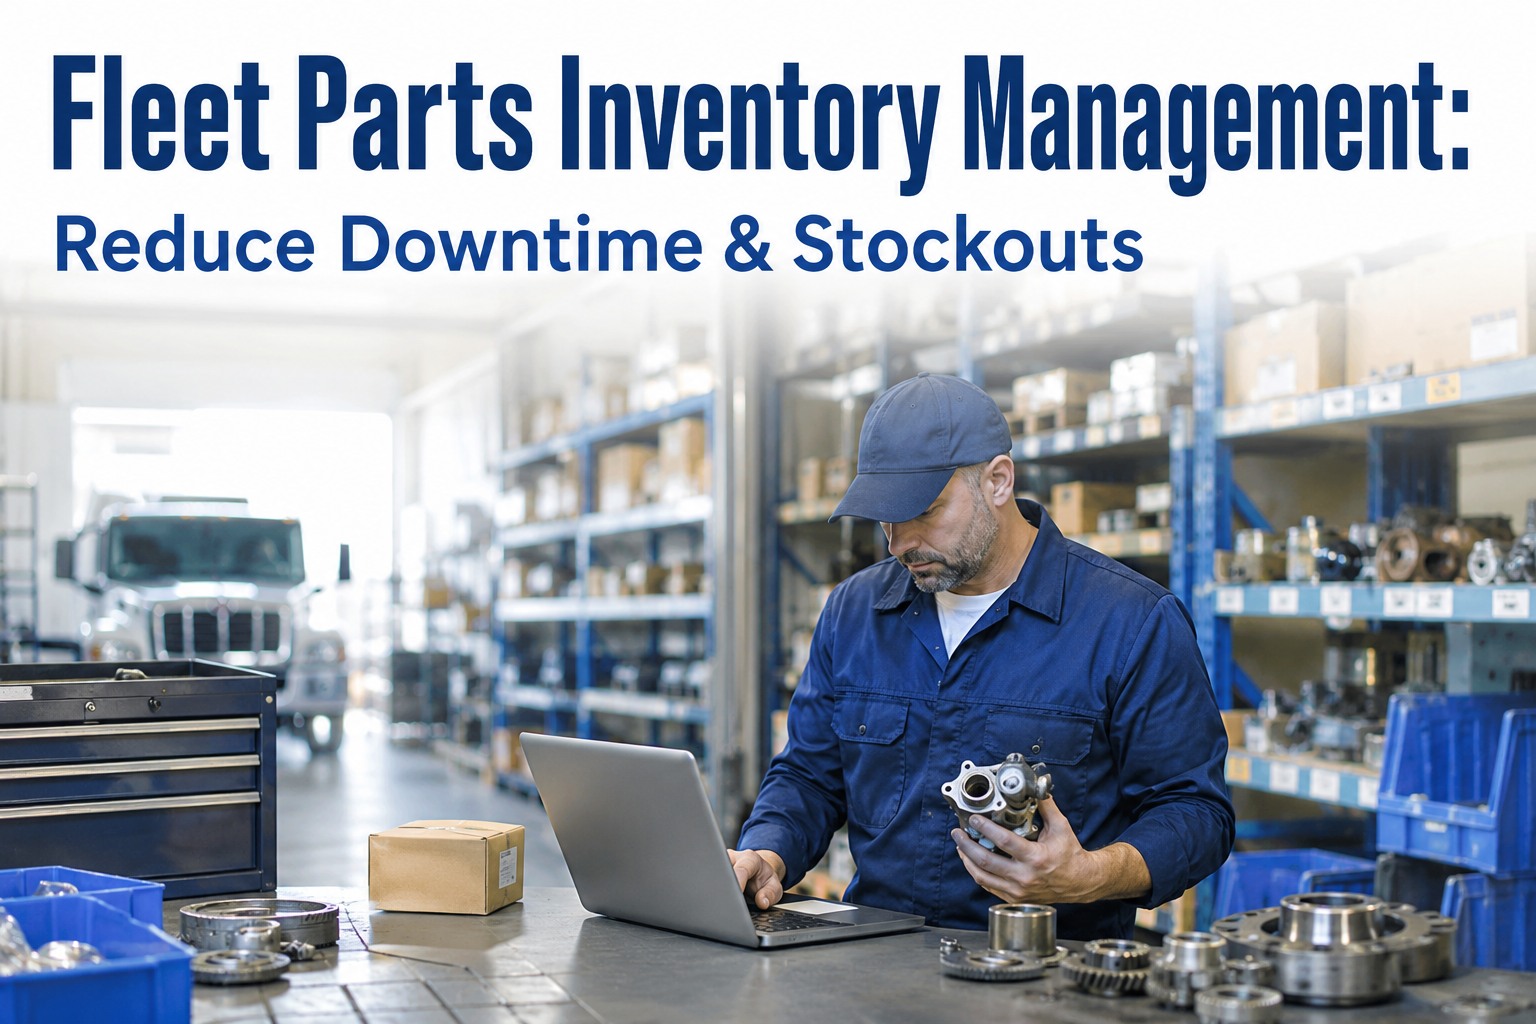
Fleet parts inventory management is the operational discipline that determines whether a scheduled PM completes on time or gets deferred waiting on parts. Q4 2025 parts costs rose 3.7% year-over-year per the Decisiv/TMC benchmark, driven by 50% Section 232 tariffs on steel and aluminum. Well-managed inventory programs reduce carrying costs 30-40%, achieve 95%+ parts availability, and eliminate 91% of stockout events. The framework: ABC classification, calculated reorder points, and KPI-driven optimization. Book an HVI demo to see it running on your fleet.
Not every part deserves equal attention. The framework tells you which.
ABC classification separates the 20% of parts that drive 80% of your inventory value from the 50% of parts that drive only 5%. Different classes, different stocking strategies, different management effort.
- Weekly cycle count
- Tight safety stock (30-100%)
- 20-40 days of stock target
- Never at zero
Engine components, transmissions, aftertreatment
- Biweekly cycle count
- Moderate safety stock (20-40%)
- 40-60 days of stock target
- Automated reorder
Brake components, starters, alternators, tires
- Monthly cycle count
- Larger safety stock (bulk)
- 60-90 days of stock target
- Auto-reorder on bulk
Filters, hoses, clamps, fasteners, seals
What fleet parts inventory management actually covers
Fleet parts inventory management is the systematic control of parts, components, and consumables required to maintain a commercial vehicle fleet. It spans four operational disciplines: classification (which parts matter most), stocking (how much of each to hold), replenishment (when to reorder), and consumption tracking (what got used where). Done well, it keeps PM programs on schedule and repairs completing quickly. Done poorly, it becomes the largest source of maintenance delays.
The stakes have risen sharply in the last two years. Q4 2025 parts costs rose 3.7% year-over-year per the Decisiv/TMC benchmark, with tariff-driven increases on steel and aluminum components adding further pressure. Parts now represent the largest driver of rising maintenance costs, outpacing labor increases for the second consecutive year. Every dollar of overstocked inventory ties up working capital that costs 12-18% annually; every stockout event delays a PM by 3-14 days.
ABC analysis by consumption value; VED analysis (Vital / Essential / Desirable) by criticality; XYZ analysis by demand variability.
Min/max levels, safety stock calibrated to service level target, economic order quantity, cycle stock, and buffer stock strategy per class.
Reorder points automated from consumption history, vendor lead time management, purchase order workflow, backorder tracking.
Parts issued against work orders, cycle counting for accuracy, obsolescence review, scrap and warranty return handling.
Best-in-class fleets treat these four disciplines as integrated systems, not independent activities. The classification determines the stocking policy; the stocking policy drives replenishment triggers; consumption tracking validates the classification. Book an HVI demo to see the four disciplines integrated in one platform
ABC classification — the Pareto principle applied to parts
ABC classification is the foundational framework for fleet parts inventory management. It applies the Pareto principle (80/20 rule) to the parts catalog: approximately 20% of parts drive 80% of inventory value; the remaining 80% drive only 20%. Managing all parts with equal effort wastes storeroom labor on low-value items while under-attending high-value items where errors are expensive.
The classification uses "annual usage value" (annual quantity consumed × unit cost) as the primary sorting variable. A part consuming 50 units per year at $200 each generates $10,000 of annual value; a part consuming 500 units per year at $2 each generates $1,000. Both are legitimate parts — but they demand different management strategies. Fleets implementing ABC classification report 30% improvement in cycle count accuracy and 18% reduction in overall carrying cost as C-class items shift to bulk auto-reorder rather than manual tracking.
High-value critical parts requiring active management. Weekly cycle counts. Aggressive safety stock (30-100% of lead time consumption). Vendor performance tracked closely. Substitute parts and alternative suppliers pre-qualified. Never at zero stock. Examples: engine components, transmissions, aftertreatment modules, differentials.
Medium-value parts with predictable consumption. Biweekly cycle counts. Moderate safety stock (20-40% of lead time consumption). Automated reorder on standard triggers. Vendor performance reviewed quarterly. Examples: brake components, starters, alternators, tires, wheel bearings.
Low-value high-frequency parts managed in bulk. Monthly cycle counts sufficient. Larger safety stock acceptable due to low unit cost. Auto-reorder on economic order quantity. Storeroom labor minimized. Examples: filters, hoses, clamps, fasteners, seals, gaskets, wipers.
The classification is dynamic. Parts move between classes as usage patterns change — a Class C part becoming heavily consumed migrates to Class B; a Class B part with declining usage migrates to Class C. Fleet platforms with automated ABC re-classification maintain current classifications without manual intervention.
Reorder point + safety stock — the math that prevents stockouts
The reorder point is the inventory level that triggers a new purchase order. Set too high and inventory carrying costs balloon; set too low and stockouts strand PMs. The MRO-standard reorder point formula is elementary arithmetic, but the inputs require operational discipline to get right.
Calculated from 12 months of work order consumption history, not estimated. Recalculated monthly.
Actual observed lead time from purchase order to receipt. Updated quarterly. Includes safety margin.
Buffer against demand variability and lead time delays. Class B target: 30% of lead time consumption.
The formula's power is in what it eliminates. Manual reorder based on shop foreman intuition produces reorder points 20-40% off optimal — either wasting working capital or accepting stockout risk. Automated reorder based on the formula produces reorder points calibrated to actual usage and lead time. Start a free trial to run the calculation against your fleet's parts catalog.
The 5 inventory failure modes that break fleet PM programs
Fleet parts inventory management fails in five distinct ways. Each has a specific operational signature and corrective lever. Most fleets suffer from 2-3 of the five simultaneously.
PM comes due but the required parts aren't in stock. Service delays 3-14 days waiting on emergency shipping (3-5x standard cost). Highest-visibility failure — drives PM compliance rate down, breeds distrust in the inventory system. Root cause: reorder points not calibrated to actual consumption, or lead time updates lagging vendor reality.
20-30% of average maintenance storeroom inventory is obsolete or overstocked. Ties up working capital at 12-18% annual carrying cost. Physical space consumed by parts that will never be used. Root cause: manual reorder policies never reviewed, discontinued equipment leaving orphaned parts in stock, ABC classifications not updated as duty cycles change.
Distributed fleets with multiple yards or shops purchase the same parts independently. Total fleet inventory balloons while individual locations still stock out. One of the largest hidden inventory costs for multi-site operations. Root cause: no cross-location visibility, no inter-location transfer workflow.
System says 12 units in stock; physical shelf shows 3. Technician issues part without logging against work order; new PO gets ordered when existing stock would have covered the need. Root cause: parts issued without work order attachment, missed cycle counts, receiving errors not caught.
Upcoming PMs generate predictable parts demand (oil filters for every 15,000-mile service, brake pads on cycles, aftertreatment components on hour intervals). Fleets that don't forecast demand from the PM schedule get surprised by predictable consumption spikes. Root cause: PM system and inventory system not integrated.
Diagnosing which of the five is driving fleet-wide inventory pain requires visibility into consumption patterns and root cause data — something spreadsheets and paper systems can't provide. Digital inventory platforms with PM system integration eliminate 3 of the 5 failure modes structurally and reduce the remaining 2 to manageable exceptions. Book an HVI demo to see the failure modes diagnosed against your fleet's inventory
The 5 KPIs every parts manager should track
Parts inventory management without KPIs is guesswork. Five metrics together produce a complete diagnostic picture of storeroom health.
Percentage of parts requests filled from stock on first request. Below 80% signals understocking or wrong ABC classification. Above 98% may signal overstocking. Track separately by ABC class for meaningful benchmarking.
Annual usage divided by average inventory value. High turnover = lean storeroom; low turnover = overstocking or dead inventory. Class A parts should turn 6-12x; Class C parts 2-4x.
Percentage of work orders delayed or cancelled due to parts unavailability. Above 15% signals systemic reorder point calibration failure. Track cause codes to distinguish supplier delay from usage spike from process failure.
Total annual cost of holding inventory as a percentage of average inventory value. Includes storage, insurance, obsolescence, capital cost. Above 25% justifies aggressive lean-inventory strategies; below 15% may signal understaffing risk.
How long current inventory would last at current consumption. Target varies by ABC class: A parts 20-40 days, B parts 40-60 days, C parts 60-90 days. Values above target flag overstock; below target flag stockout risk.
Track all five monthly at minimum. Publish to fleet management team quarterly. The KPIs that get reported are the KPIs that get managed — and inventory health responds quickly to visibility. Book an HVI demo to see all 5 KPIs on your executive dashboard
The digital parts inventory workflow — from PM to receipt
Digital parts inventory management is a workflow, not a database. The workflow starts with the PM schedule and ends with parts receipt. Every step in between is where paper-based fleets bleed inventory accuracy.
Upcoming PMs create a rolling 30-60 day parts demand forecast. Filters, fluids, brake pads, and other consumables auto-check inventory 2-4 weeks before scheduled work. Shortfalls flagged to storeroom before they become stockouts.
Stock hitting the calculated reorder point auto-generates a purchase order to the preferred vendor. Approval workflows for high-dollar POs; auto-approval for routine reorders under threshold. Backorder tracking built in.
Technician pulls part from storeroom via mobile scan. System deducts from inventory, assigns cost to work order, updates on-hand count. No paper slips. No lost documentation. Cycle count discrepancies become rare exceptions.
PO receipt validated against original order. Shortages or damage logged against vendor performance. Inventory updated in real time. Purchase history builds the data pool for lead time updates and vendor benchmarking.
Each step eliminates a specific paper-based failure point. Together, the four steps transform parts inventory from a source of PM delays into a competitive advantage. Start a free trial to build the workflow for your fleet.
From a Parts Manager who cut fleet-wide carrying costs by $340K
We were carrying $1.8M in parts inventory across four locations. Stockouts were still happening — roughly 8-10 per week. Turned out we were overstocked on the wrong things and understocked on the right ones. Our ABC classification hadn't been updated in three years; our reorder points were still based on 2021 lead times before the tariff hikes hit.
Rebuilt classification from actual consumption history. Recalculated reorder points quarterly with current vendor lead times. Added multi-site visibility so techs could pull from another yard 30 miles away instead of ordering new. Twelve months later: fleet-wide inventory down to $1.46M, stockouts down to 1-2 per week, carrying costs down $340,000 annually. Same parts catalog, same fleet — different math and different visibility.
Frequently asked questions
What is ABC analysis in fleet parts inventory management?
ABC analysis is a classification framework that divides a parts catalog into three tiers based on annual usage value (annual quantity consumed × unit cost). Class A: approximately 20% of SKUs representing 80% of inventory value. These are high-value, business-critical parts requiring tight control — weekly cycle counts, aggressive safety stock (30-100% of lead time consumption), pre-qualified alternative suppliers, and never at zero stock. Examples include engine components, transmissions, aftertreatment modules, and differentials. Class B: approximately 30% of SKUs representing 15% of inventory value. Medium-value parts with predictable consumption requiring regular monitoring — biweekly cycle counts, moderate safety stock (20-40% of lead time consumption), automated reorder on standard triggers. Examples include brake components, starters, alternators, tires, and wheel bearings. Class C: approximately 50% of SKUs representing only 5% of inventory value. Low-value high-frequency parts managed in bulk — monthly cycle counts sufficient, larger safety stock acceptable due to low unit cost, automated reorder on economic order quantity. Examples include filters, hoses, clamps, fasteners, and gaskets. The framework applies the Pareto principle (80/20 rule) to prevent equal effort on unequal parts. Fleets implementing ABC classification report 30% improvement in cycle count accuracy and 18% reduction in overall carrying cost.
How do I calculate the reorder point for a fleet parts inventory?
The MRO-standard reorder point formula is: Reorder Point = (Average Daily Usage × Lead Time in Days) + Safety Stock. Each input requires operational discipline to get right. Average daily usage should be calculated from 12 months of actual work order consumption history stored in your CMMS or parts inventory system — not estimated from memory or extrapolated from short-term data. Recalculate monthly as usage patterns shift. Vendor lead time is the actual observed time from purchase order to receipt, updated quarterly. Include shipping and processing time; exclude time from part failure to purchase order generation (that's PM discipline, not inventory management). If you use secondary suppliers as backup, track their lead times separately. Safety stock is calibrated to your target service level and the demand variability of the specific part. Class A critical parts with long lead times typically carry safety stock equal to 30-100% of average lead time consumption. Class B parts typically 20-40%. Class C parts run on economic order quantity with larger buffers acceptable. Worked example: brake linings averaging 4 units per day usage with 7-day vendor lead time and 12 units safety stock produces a reorder point of 40 units — when stock hits 40, auto-generate purchase order. The formula's power is in what it eliminates: manual reorder based on shop foreman intuition typically runs 20-40% off optimal.
What is a good parts availability rate for a fleet storeroom?
Best-in-class fleet storerooms achieve 95% or higher parts availability (fill rate) — meaning 95%+ of parts requests are filled from stock on first request without backorder or emergency shipping. Below 80% signals systematic understocking or wrong ABC classification driving the storeroom to hold the wrong parts. Above 98% may signal overstocking that ties up working capital unnecessarily. The target should be tracked separately by ABC class for meaningful benchmarking. Class A parts should hit 98%+ availability because stockouts on high-value critical parts are the most expensive. Class B parts should hit 95%+ availability. Class C parts can accept lower availability (90-93%) because emergency replacement of low-cost items is proportionally less painful. Availability below target on Class A parts signals reorder points calibrated incorrectly or lead times not updated to reflect vendor reality — typically fixable within 60-90 days. Availability below target on Class C parts often signals bulk auto-reorder policies that aren't running correctly. Well-managed inventory programs achieve 95%+ overall parts availability while simultaneously reducing carrying costs 30-40% versus reactive baseline. The two metrics are not in tension when the ABC framework and reorder points are correctly applied.
How does parts inventory management integrate with preventive maintenance?
Parts inventory and preventive maintenance are deeply interconnected — and the largest gains in fleet maintenance efficiency come from integrating them rather than running them as separate systems. Every scheduled PM produces predictable parts demand: oil filters for every 15,000-mile service, brake pads on cycles, aftertreatment components on hour intervals. A fleet running 100 trucks generates several hundred scheduled parts consumption events per month, all forecastable weeks in advance from the PM schedule. Integrated platforms use this forecast to check parts availability 2-4 weeks before each scheduled PM — flagging shortfalls to the storeroom before they become stockouts. This eliminates the highest-visibility inventory failure mode (stockouts on scheduled PMs) at the source rather than reactively. Integration also enables demand-driven safety stock — parts scheduled for consumption in the next 30 days get elevated safety stock temporarily, parts with no near-term scheduled use can run leaner. Fleets running separate PM and inventory systems typically see 15-20% higher stockout rates and 10-15% higher carrying costs than fleets running integrated platforms, because the forecast information exists but isn't being used. Digital platforms that combine work order management, PM scheduling, and parts inventory in one integrated system eliminate this operational gap.
Can inventory carrying costs be reduced without increasing stockouts?
Yes — and this is the fundamental value proposition of structured inventory management. The intuitive assumption that lower inventory equals higher stockout risk is only true when inventory is managed as an undifferentiated pool. When ABC classification separates the parts catalog into tiers with different stocking strategies, both outcomes improve simultaneously. Class C parts (50% of SKUs, 5% of value) can typically hold larger safety stock at almost no incremental carrying cost — a $2 filter buffer of 100 units costs $200 total versus the alternative of running out during a routine PM. Class A parts (20% of SKUs, 80% of value) should typically hold smaller safety stock than most fleets carry because tight ABC control combined with vendor-managed inventory arrangements and pre-qualified alternative suppliers reduces the actual stockout risk. The math produces both lower total carrying cost (fewer Class A dollars locked up in excess safety stock) and higher availability (Class C parts always in stock, Class A parts protected by vendor arrangements). Documented fleet case studies show 30-40% carrying cost reduction achieved simultaneously with 91% stockout event reduction using this approach. The other reduction lever is dead inventory identification — 20-30% of average storeroom inventory is obsolete or overstocked from equipment no longer in the fleet or duty cycles that have shifted. Systematic ABC review liquidates this dead inventory, converting carrying cost to working capital.
From storeroom firefighting to 95%+ parts availability — in one quarter.
HVI's parts inventory module ships with MRO-standard ABC classification and automated reorder point calculation. Consumption history builds from work orders; upcoming PMs auto-check parts availability 2-4 weeks ahead; multi-site visibility eliminates duplicate purchasing; executive dashboards deliver all 5 inventory KPIs. Live for your fleet in under three weeks — typical result: 30-40% carrying cost reduction, 91% stockout event reduction, and PM compliance climbing 8-12 points as parts availability stops delaying scheduled service.
MRO methodology · PM-integrated forecasting · Multi-site visibility · SOC 2 Type II